. 2018 Feb 15;554(7692):373-377.
doi: 10.1038/nature25500. Epub 2018 Feb 7.

c-MAF-dependent regulatory T cells mediate immunological tolerance to a gut pathobiont

Affiliations

c-MAF-dependent regulatory T cells mediate immunological tolerance to a gut pathobiont

Mo Xu et al. Nature. .

Erratum in

Abstract

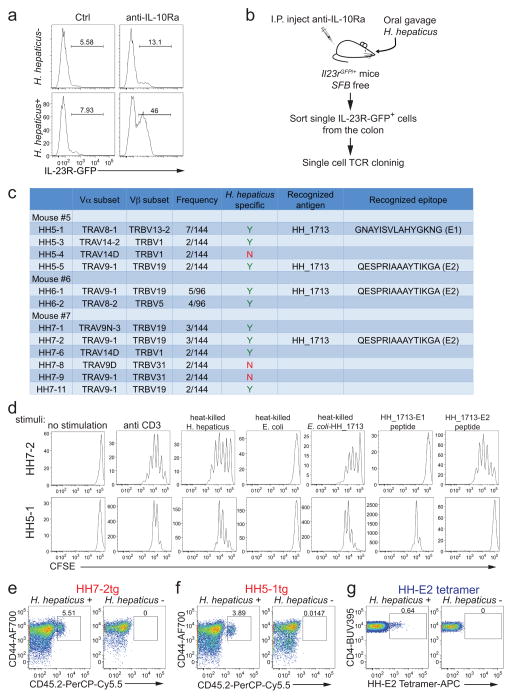
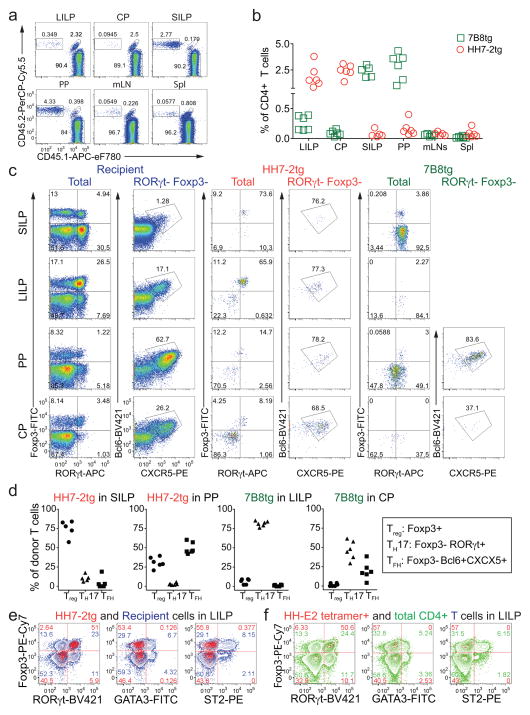
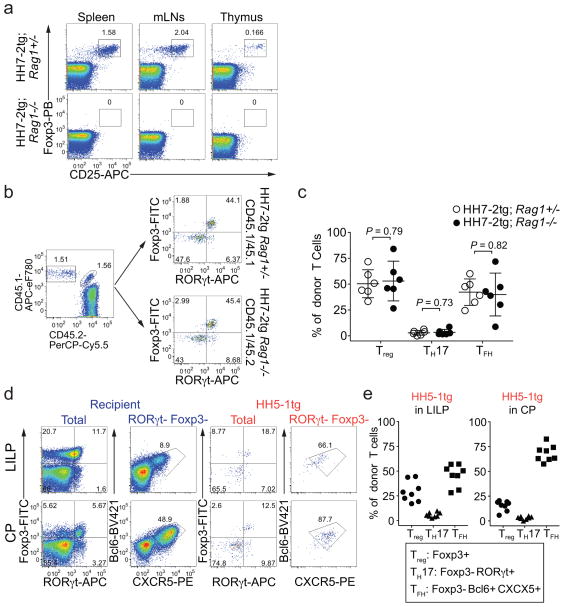
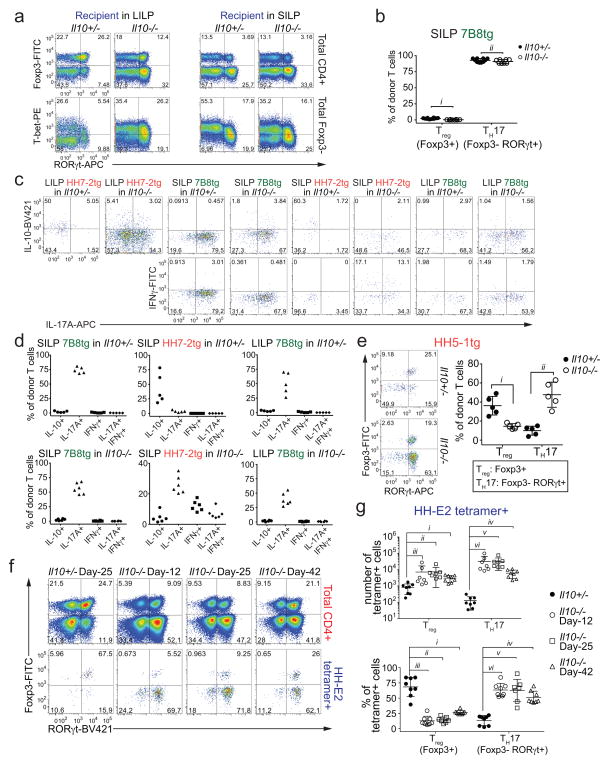
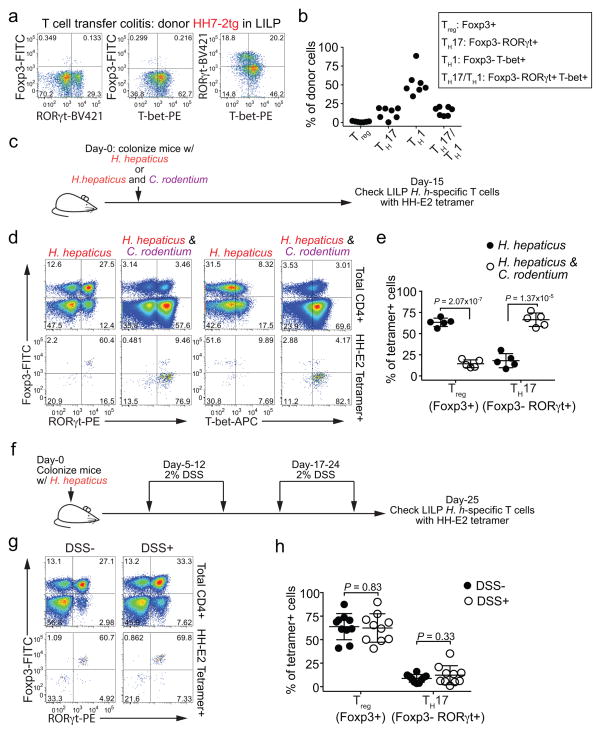
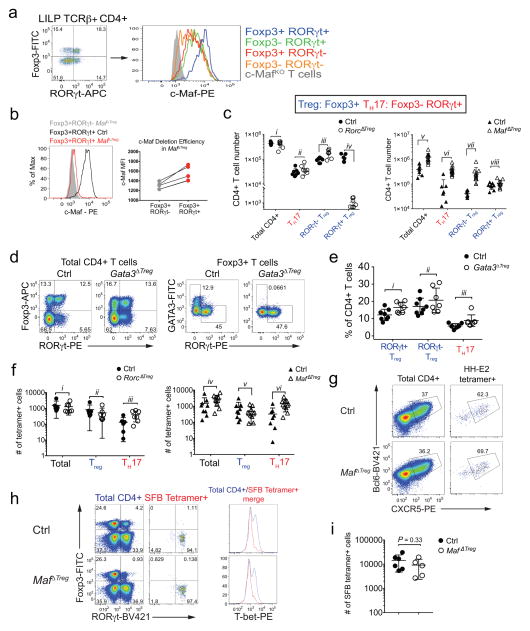
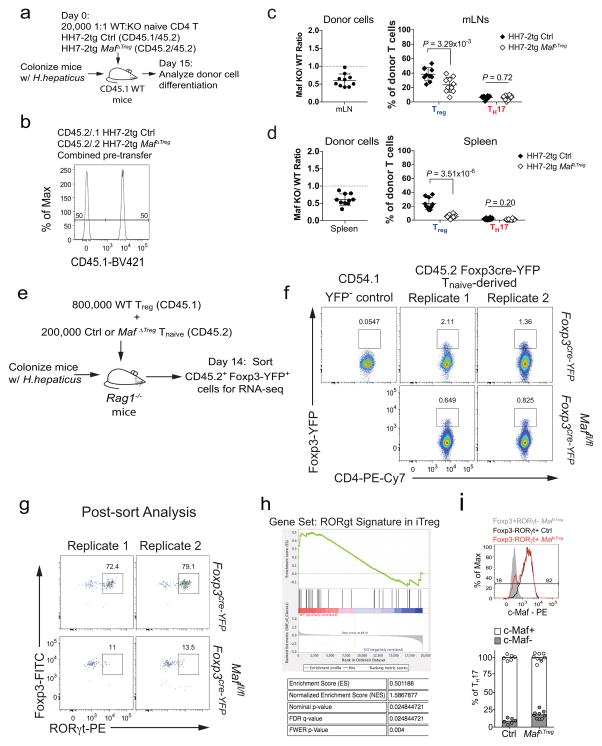
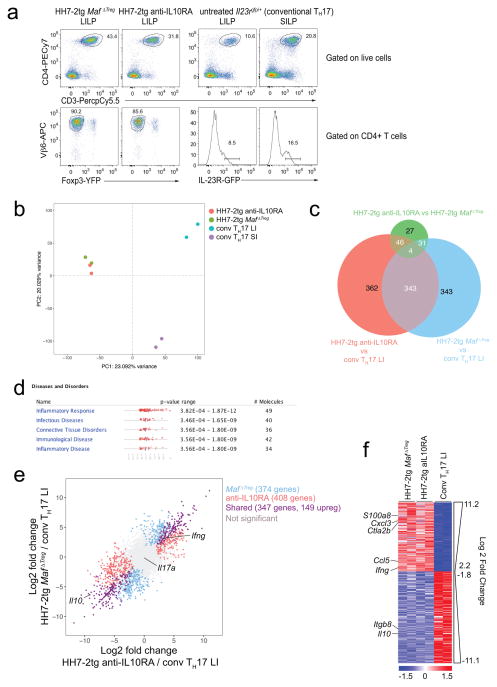
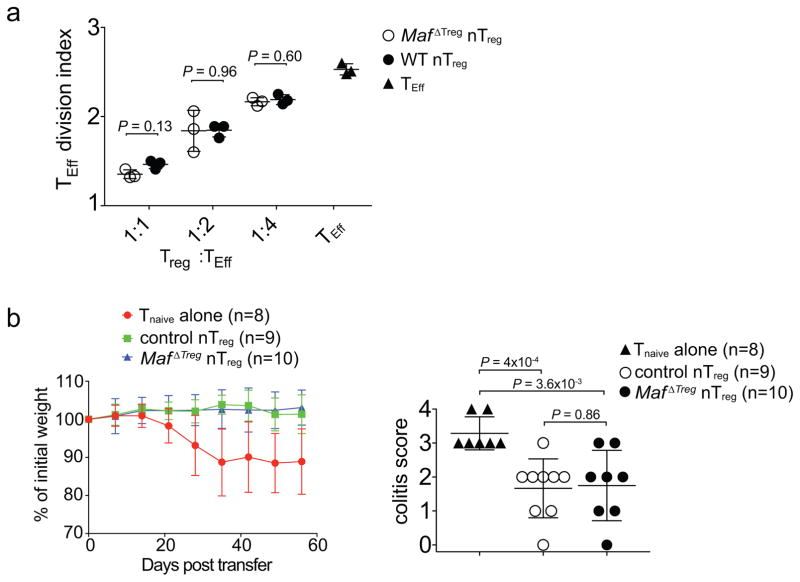
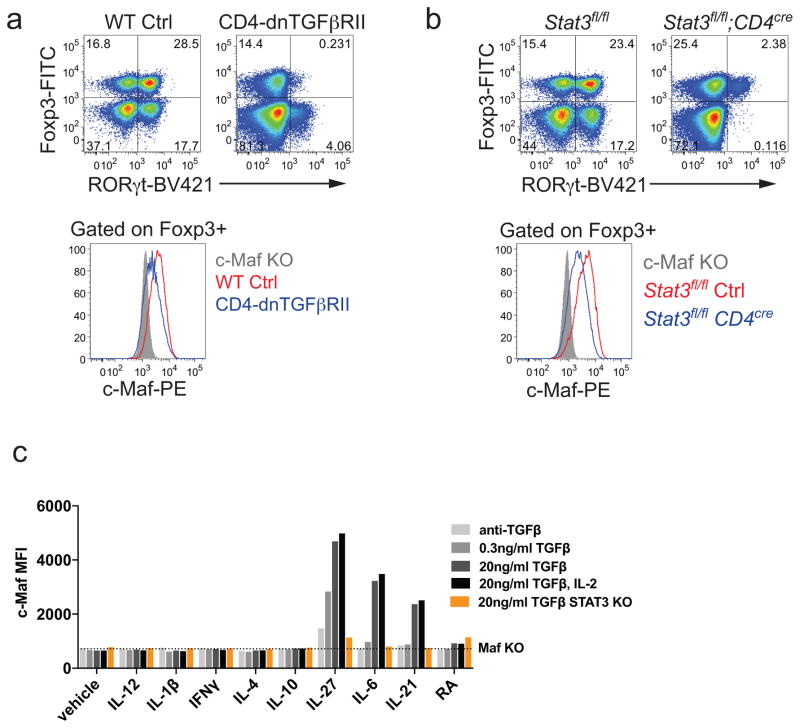
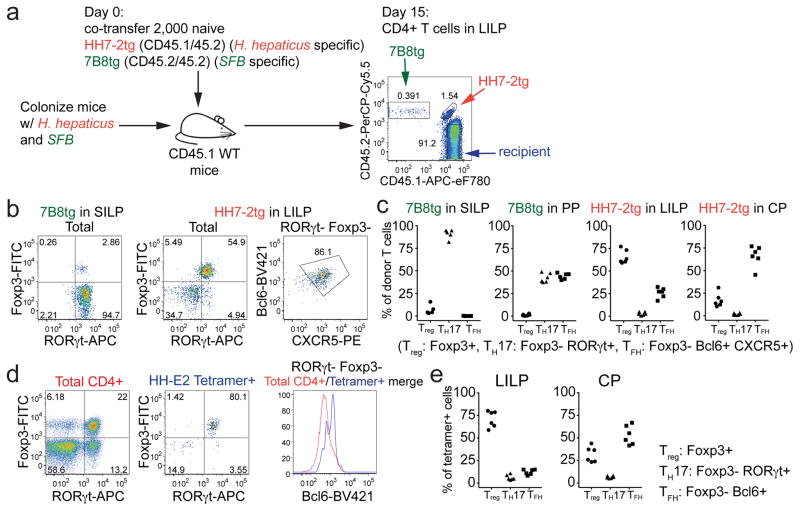
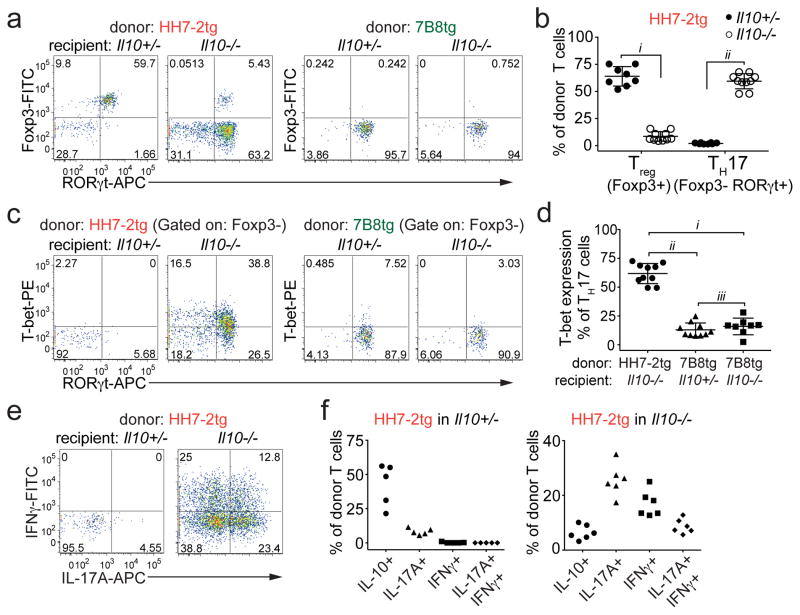
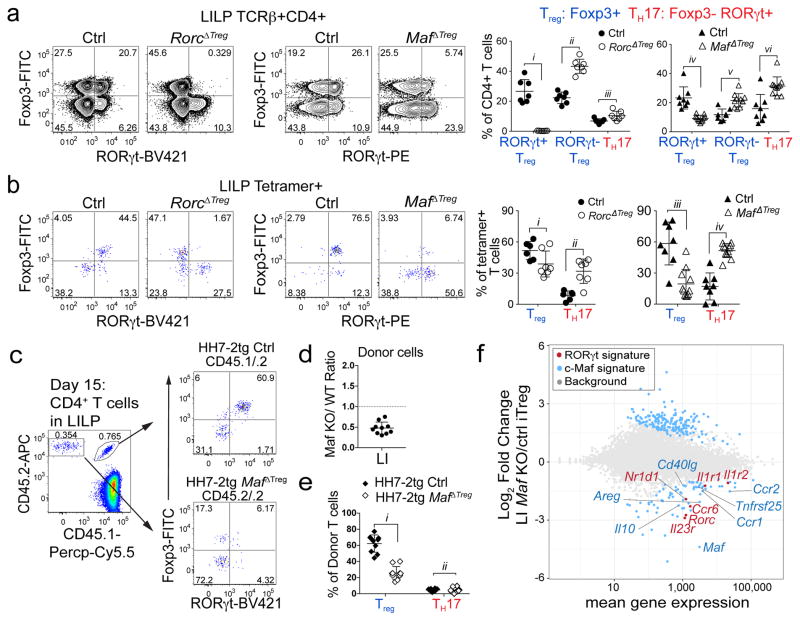
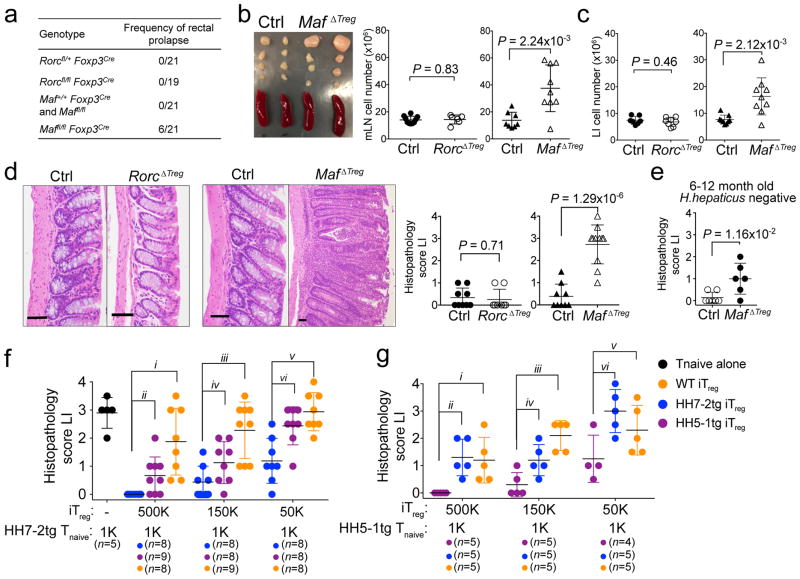
Both microbial and host genetic factors contribute to the pathogenesis of autoimmune diseases. There is accumulating evidence that microbial species that potentiate chronic inflammation, as in inflammatory bowel disease, often also colonize healthy individuals. These microorganisms, including the Helicobacter species, can induce pathogenic T cells and are collectively referred to as pathobionts. However, how such T cells are constrained in healthy individuals is not yet understood. Here we report that host tolerance to a potentially pathogenic bacterium, Helicobacter hepaticus, is mediated by the induction of RORγt+FOXP3+ regulatory T (iTreg) cells that selectively restrain pro-inflammatory T helper 17 (TH17) cells and whose function is dependent on the transcription factor c-MAF. Whereas colonization of wild-type mice by H. hepaticus promoted differentiation of RORγt-expressing microorganism-specific iTreg cells in the large intestine, in disease-susceptible IL-10-deficient mice, there was instead expansion of colitogenic TH17 cells. Inactivation of c-MAF in the Treg cell compartment impaired differentiation and function, including IL-10 production, of bacteria-specific iTreg cells, and resulted in the accumulation of H. hepaticus-specific inflammatory TH17 cells and spontaneous colitis. By contrast, RORγt inactivation in Treg cells had only a minor effect on the bacteria-specific Treg and TH17 cell balance, and did not result in inflammation. Our results suggest that pathobiont-dependent inflammatory bowel disease is driven by microbiota-reactive T cells that have escaped this c-MAF-dependent mechanism of iTreg-TH17 homeostasis.


Conflict of interest statement

The authors declare no competing financial interests.

Figures

Extended Data Figure 1
Extended Data Figure 1. Cloning and characterization of H. hepaticus-specific TH17 TCRs, and generation of TCR transgenic (TCRtg) mice and MHC-II tetramers
a, IL-23R-GFP expression in CD4+ T cells from the large intestines of mice with and without H. hepaticus colonization and after IL-10Ra blockade. Data are from one of five independent experiments. b, Experimental scheme for cloning H. hepaticus-induced single IL-23R-GFP+ (predominantly TH17) cell TCRs under IL-10Ra blockade. c, Summary of the twelve dominant H. hepaticus-induced TH17 TCRs. d, In vitro activation of CFSE-labeled naive HH7-2tg and HH5-1tg cells by indicated stimuli in the presence of antigen-presenting cells. Data are from one of two independent experiments. e, f, Expansion of donor-derived HH7-2tg (e) and HH5-1tg (f) (CD45.2) cells in the large intestine (LI) of H. hepaticus-colonized or -free CD45.1 mice, gated on total CD4+ T cells. Data are from one of three independent experiments. g, HH-E2 tetramer staining of CD4+ T cells from the LI of H. hepaticus-colonized or -free mice. Data are from one of six independent experiments.
Extended Data Figure 2
Extended Data Figure 2. Extended characterization of SFB- and H. hepaticus-specific T cells in distinct anatomical sites in bacteria-colonized WT mice
a, Representative flow cytometry plots of donor-derived HH7-2tg (CD45.1/45.2) and 7B8tg (CD45.2/45.2) T cells in indicated tissues of mice colonized with SFB and H. hepaticus, gated on total CD4+ T cells (CD4+CD3+) (n=15). b, Proportions of donor-derived HH7-2tg and 7B8tg T cells among total CD4+ T cells in indicated tissues. Data in (a) and (b) are from one of 3 experiments, with total of 15 mice in the 3 experiments. c, Representative flow cytometry plots of RORγt, Foxp3, Bcl6 and CXCR5 expression in CD4+ T cells from the host and from HH7-2tg and 7B8tg donors in different tissues (n=15). d, Frequencies of Treg (Foxp3+), TH17 (Foxp3RORγt+) and TFH (Bcl6+CXCR5+) cells among donor-derived HH7-2tg and 7B8tg cells in different tissues. Data are from one of 3 experiments, with total of 15 mice in the 3 experiments. e, Representative flow cytometry plots of Foxp3, RORγt, GATA3 and ST2 expression in CD4+ T cells from the host (blue) and from HH7-2tg donors (red) in the LILP (n=5). f, Representative flow cytometry plots of Foxp3, RORγt, GATA3 and ST2 expression in total CD4+ (green) and HH-E2 tetramer+ (red) T cells in the LILP (n=5). SILP: small intestinal lamina propria; LILP: large intestinal lamina propria; PP: Peyer’s patches; CP: cecal patches; mLNs: mesenteric lymph nodes; and Spl: spleen.
Extended Data Figure 3
Extended Data Figure 3. Extended characterization of H. hepaticus-specific TCRtg cell differentiation
a, HH7-2tg;Rag1−/− mice do not develop Treg cells in the thymus. Representative flow cytometry plots of Treg (Foxp3+CD25+) frequency in indicated tissues of H. hepaticus-free HH7-2tg;Rag1+/− (n=3) or HH7-2tg;Rag1−/− (n=3) mice. b, c, HH7-2tg Rag1−/− and Rag1+/− donor-derived T cells differentiated into equal frequencies of RORγt+ Treg in the LI of WT mice. Equal numbers (2,000) of congenic isotype-labeled HH7-2tg Rag1+/− (CD45.1/45.1) and Rag1−/− (CD45.1/45.2) naïve T cells were co-transferred into H. hepaticus-colonized WT B6 mice. Cells from the LILP were analyzed two weeks after transfer. Data summarize two independent experiments (n=6). b, Representative flow cytometry plots of donor and recipient T cell frequency (left), and RORγt and Foxp3 expression (right) (n=6). c, Frequencies of Treg (Foxp3+), TH17 (Foxp3RORγt+) and TFH (Bcl6+CXCR5+) cells among HH7-2tg Rag1+/− (n=6) and Rag1−/− (n=6) donor-derived T cells. d, e, 2,000 naïve HH5-1tg cells (CD45.1/45.2) were adoptively transferred into WT B6 mice (CD45.2/45.2) colonized with H. hepaticus. Cells from LILP and CP were analyzed two weeks after transfer. d, Representative flow cytometry plots are shown for RORγt, Foxp3, Bcl6 and CXCR5 expression in donor-derived and recipient CD4+ T cells in indicated tissues. e, Frequencies of Treg (Foxp3+), TH17 (Foxp3RORγt+) and TFH (Bcl6+CXCR5+) among HH5-1tg donor T cells (n=8). Data are a summary of eight mice from two independent experiments. All statistics were calculated by unpaired two-sided Welch’s t-test. Error bars: mean ± 1 SD. P values are indicated in the figure.
Extended Data Figure 4
Extended Data Figure 4. Differentiation of SFB- and H. hepaticus-specific T cells in Il10+/− and Il10−/− mice
a–d, Equal numbers (10,000) of congenic isotype-labeled HH7-2tg (CD45.1/45.2) and 7B8tg (CD45.1/45.1) T cells were co-transferred into Il10−/− and Il10+/ mice (CD45.2/45.2) colonized with both H. hepaticus and SFB. Intestinal T cells were examined two weeks later. a, Representative flow cytometry plots of Foxp3, RORγt and T-bet expression in total and Foxp3 host CD4+ T cells in the SILP and LILP of Il10+/− (n=10) and Il10−/− (n=8) mice that received TCR Tg T cell transplants. b, Frequencies of Treg (Foxp3+) and TH17 (Foxp3RORγt+) cells among SILP 7B8tg donor-derived cells in Il10+/− (n=10) and Il10−/− (n=8) mice. Data for (a) and (b) are a summary of four independent experiments. c, Representative flow cytometry plots of IL-10, IL-17A and IFNγ expression in transferred 7B8tg and HH7-2tg cells from LILP and SILP of Il10+/− and Il10−/− mice after re-stimulation (n=5 or 6). d, Proportions of transferred 7B8tg and HH7-2tg cells in the SILP and LILP of Il10+/− and Il10−/− mice that express IL-10, IL-17A and IFNγ after re-stimulation (n =5 or 6). Data for (c) and (d) are a summary of two independent experiments. e, 2000 naïve HH5-1tg cells (CD45.1/45.2) were adoptively transferred into Il10+/− and Il10−/− mice colonized with H. hepaticus. Cells from the LILP were analyzed two weeks after transfer (n=5). Representative flow cytometry plots of RORγt and Foxp3 expression in HH5-1tg donor cells are shown (left), along with a compilation of frequencies of Treg (Foxp3+) and TH17 (Foxp3RORγt+). f, g, RORγt and Foxp3 expression in total CD4+ and HH-E2 tetramer+ T cells (f) and frequencies (above) and absolute numbers (below) of Treg (Foxp3+) and TH17 (Foxp3RORγt+) among HH-E2 tetramer+ T cells (g) in the LILP of Il10+/− (day 25, n=8) and Il10−/− (day-12 n=8, day-25 n=7, day-42 n=8) mice colonized with H. hepaticus for indicated times. All statistics were calculated by unpaired two-sided Welch’s t-test. Error bars: mean ± 1 SD. P values are as follows: b, i=0.062 and ii=0.063. e, i=1.46x10⁻³ and ii=3.10x10⁻⁴. g, (top) i=7.82x10⁻⁴, ii=0.014, iii=0.088, iv=1.48x10⁻⁴, v=1.47x10⁻³ and vi=0.016 and (bottom) i=3.85x10⁻⁶, ii=9.63x10⁻⁷, iii=1.31x10⁻⁶, iv=8.91x10⁻⁷, v=1.15x10⁻⁵ and vi=1.56x10⁻⁷.
Extended Data Figure 5
Extended Data Figure 5. Differentiation of H. hepaticus-specific T cells in colitis models
a, b, Naïve HH7-2tg T cells were adoptively transferred into H. hepaticus-colonized Rag1−/− mice to induce colitis (n=7). Data summarize two independent experiments. Representative expression of Foxp3, RORγt, and T-bet (a), and a compilation of frequencies of Treg (Foxp3+), TH17 (Foxp3RORγt+), TH1 (Foxp3T-bet+) and TH17/TH1 (Foxp3RORγt+T-bet+) in HH7-2tg donor-derived cells in the LILP of recipient mice was analyzed 4 weeks post transfer. c–e, Analysis of H. hepaticus-specific T cell differentiation during C. rodentium-induced colonic inflammation. Data summarize two independent experiments. c, Schematic of experimental design. d, e, Representative flow cytometry plots of Foxp3, RORγt and T-bet expression in total CD4+ and HH-E2 tetramer+ T cells (d) and frequencies of Treg (Foxp3+) and TH17 (Foxp3RORγt+) cells among HH-E2 tetramer+ T cells (e) in the LILP of C. rodentium-infected (n=5) and -uninfected mice (n=5). f–h, Analysis of H. hepaticus-specific T cell differentiation during DSS-colitis. Data are a summary of two independent experiments. f, Schematic of experimental design. g, h, Representative flow cytometry plots of Foxp3, RORγt and T-bet expression in total CD4+ and HH-E2 tetramer+ T cells (g) and a compilation of frequencies of Treg (Foxp3+) and TH17 (Foxp3RORγt+) cells among HH-E2 tetramer+ cells (h) in the LILP of DSS-treated (n=10) and -untreated mice (n=10). All statistics were calculated by unpaired two-sided Welch’s t-test. Error bars: mean ± 1 SD. P values are indicated in the figure.
Extended Data Figure 6
Extended Data Figure 6. Extended characterization of Maf ΔTreg, RorcΔTreg and Gata3ΔTreg animals
a, Expression of c-Maf in the indicated CD4+ T cell subsets in the LILP. b, Incomplete depletion of c-Maf protein in RORγt+ Treg cells in MafΔTreg mice shown by a representative flow cytometry graph from 3 independent experiments (left), and a compilation of mean fluorescence intensities (MFI) in RORγt Tregs and residual RORγt+ Tregs (right). c, Absolute numbers of indicated CD4+ T cell populations in the LILP of indicated mice. Data are a summary of 3 independent experiments for RorcΔTreg (n=7) and littermate controls (n=7) and 4 independent experiments for Maf ΔTreg (n=11) and littermate controls (n=8). d, e, Representative flow cytometry plots of Foxp3, RORγt and GATA3 expression in total and Foxp3+ CD4+ T cells (d) and a compilation of frequencies of RORγt+ and RORγt Treg (Foxp3+) cells and TH17 (Foxp3RORγt+) cells among total CD4+ T cells (e) in the LILP of Gata3ΔTreg (n=8) and littermate controls (n=7). Data summarize two independent experiments. f, Absolute numbers of indicated HH-E2 tetramer+ T cell populations in the LILP of indicated mice. Data are a summary of 3 independent experiments for RorcΔTreg (n=7) and littermate controls (n=6) and 4 independent experiments for Maf ΔTreg (n=11) and littermate controls (n=8). g, Representative flow cytometry plots of TFH markers Bcl6 and CXCR5 among total CD4+ and HH-E2 tetramer+ cells from the CP of MafΔTreg mice and littermate controls (n=4). h, i, SFB-specific T cells did not adopt pro-inflammatory TH17-TH1 phenotype or expand in MafΔTreg mice. Data summarize two experiments, MafΔTreg (n=5) and littermate controls (n=6). Representative flow cytometry plots of Foxp3, RORγt and T-bet expression in total CD4+ and SFB-tetramer+ T cells (h) and absolute number of SFB-tetramer+ cells (i) in the SILP. All statistics were calculated by unpaired two-sided Welch’s t-test. Error bars: mean ± 1 SD. P values are indicated in the figure or as follows: c, i=0.42, ii=0.73, iii=6.38x10⁻³, iv=2.28x10⁻⁴, v=7x10⁻¹¹, vi=7.10x10⁻³, vii=2.99x10⁻² and viii=0.83. e, i=0.081, ii=0.102 and iii=0.16. f, i=0.65, ii=0.41, iii=0.045, iv=0.12, v=0.29 and vi=6.28x10⁻³.
Extended Data Figure 7
Extended Data Figure 7. Analysis of c-Maf function in RORγt+ iTreg cells
a–d, Equal numbers of congenic isotype-labeled naïve Maf+/+;Foxp3cre (Ctrl, CD45.1/45.2) and Maffl/fl;Foxp3cre (CD45.2/45.2) HH7-2tg cells were co-transferred into H. hepaticus-colonized WT CD45.1 mice. Cells from the LILP, mLNs and spleen were analyzed 15 days after transfer. a, Schematic of experimental design. b, Flow cytometry plot depicting ratio of pooled co-transferred naïve T cells prior to transfer. c, d, Left, ratios of MafΔTreg vs control HH7-2tg donor-derived cells in the mLNs and spleen (n=10). Dashed line represents ratio of co-transferred cells prior to transfer. Right, frequencies of Treg (Foxp3+) and TH17 (Foxp3RORγt+) among donor-derived cells (n=10). Statistics were calculated by unpaired two-sided Welch’s t-test. Error bars: mean ± 1 SD. P values are indicated in the figure. e–h, Isolation of Maf-deficient and -sufficient iTreg cells for RNA-seq through a T cell reconstitution system. Two replicates represent two independent experiments. e, Schematic of experimental design. f, Flow cytometry plots indicating the sorting gates from two independent experiments. g, Flow cytometry plots showing Foxp3 and RORγt expression in sorted Foxp3-YFP+ cells from two independent experiments. h, Gene Set Enrichment Analysis performed on RNA-seq dataset of c-Maf-sufficient vs. -deficient iTreg (Foxp3-YFP+) cells (n=2 independent experiments) with gene set of 33 RORγt-dependent transcripts identified previously. i, Top, representative flow cytometry plot of c-Maf expression in TH17 cells (Foxp3 RORγt+) from LILP of control (black) and Maf ΔTreg (red) mice. The c-Maf negative population is defined by gating on Foxp3+RORγt Treg from MafΔTreg mice (solid grey). Bottom, frequency of c-Maf expression in Th17 cells in control (n=6) and Maf ΔTreg (n=9) mice from 3 independent experiments.
Extended Data Figure 8
Extended Data Figure 8. Transcriptional profiling of conventional TH17 and H. hepaticus-specific T effector cells
a–f, RNA-seq was performed on 2 biological replicates of each indicated condition. a, Flow cytometry analysis of HH7-2tg T effector cells from H. hepaticus-colonized mice and conventional IL-23R-GFP+ (predominantly SFB-specific TH17) cells from SFB-colonized mice. GFP+ gates in the lower panel were used for sorting to perform RNA-seq. b, Principal component analysis of RNA-seq data from sorted cell populations. Colored dots represent individual samples (n=2). c, e, f, Differentially expressed genes were calculated in DESeq2 using the Wald test with Benjamini-Hochberg correction to determine FDR. Genes were considered differentially expressed when FDR<0.1 and Log2 fold change > 1.5. c, Venn diagram depicting differentially expressed genes between indicated comparisons. d, Significantly enriched disease pathways in the set of 149 shared genes upregulated in HH7-2tg Maf ΔTreg and HH7-2tg from anti-IL-10RA-treated mice compared to conventional LI TH17. P-values calculated by Ingenuity Pathway Analysis using Fisher’s Exact Test. e, Comparison of transcriptomes of H. hepaticus-specific TH17 cells from mice treated with IL-10Ra blockade or MafΔTreg and conventional TH17 cells. Scatter plot depicting log2 fold change of gene expression. Blue, red and purple dots indicate significant difference. f, Heatmap depicting the 347 shared genes differentially expressed between pathogenic HH7-2 and conventional TH17 cells (purple dots in e). Data for each condition are the mean of 2 biological replicates. Scale bar represents z-scored variance stabilized data (VSD) counts.
Extended Data Figure 9
Extended Data Figure 9. Stat3 and TGFβ signal synergistically to promote c-Maf expression
a, Above, representative flow cytometry plots depicting RORγt and Foxp3 expression in CD4+ T cells in the LILP of CD4-dnTGFbRII and littermate controls (n=3). Below, representative plot of c-Maf expression in Foxp3+ cells from above animals. b, Above, representative flow cytometry plots depicting RORγt and Foxp3 expression in CD4+ T cells in the LILP of Stat3fl/fl; CD4Cre and Stat3fl/fl littermate controls (n=4). Below, representative plot of c-Maf staining in Foxp3+ cells from above animals. c, Mean fluorescence intensity of c-Maf staining in in vitro differentiated CD4+ T cells. Naïve CD4+ T cells from WT, Stat3fl/fl;CD4Cre and Maffl/fl;CD4cre mice were activated for 48 h with α-CD3ε/α-CD28 under indicated conditions. Dashed line represents the MFI of c-Maf in Maffl/fl;CD4cre T cells. Data shows one of two independent experiments.
Extended Data Figure 10
Extended Data Figure 10. c-Maf-deficient nTreg cells retain suppressive function
a, Equivalent inhibitory function of nTreg cells from Maf ΔTreg and control mice in the in vitro proliferative response of CD4+ T cells (TEff). Three data points are from one of two independent replicates. b, Activity of nTreg cells in the transfer-mediated colitis model. Percentage weight change (left) and colitis histology scores (right) of Rag1−/− mice adoptively transferred with naïve T cells alone (n=8), or naïve T cells in combination with nTreg cells from Maf ΔTreg (n=10) or littermate control Foxp3creYFP (n=9) mice. Data are a summary of two independent experiments. All statistics were calculated by unpaired two-sided Welch’s t-test. Error bars: mean ± 1 SD. P values are indicated in the figure.
Figure 1
Figure 1. H. hepaticus induces RORγt+ Treg and TFH responses under steady state
a, Experimental scheme for co-transfer of congenic isotype-labeled HH7-2tg and 7B8tg cells into wild type (WT) mice colonized with H. hepaticus and SFB. b, c, RORγt, Foxp3, Bcl-6 and CXCR5 expression (b) and frequencies of Treg (Foxp3+), TH17 (Foxp3RORγt+) and TFH (Bcl6+CXCR5+) (c) among donor-derived T cells in indicated tissues. Data are from one of 3 experiments, with n=15 in the 3 experiments. d, e, WT mice (n=6) were colonized with H. hepaticus for 3–4 weeks and analyzed for RORγt, Foxp3 and Bcl6 expression in total CD4+ (red) and HH-E2 tetramer+ (blue) T cells from the LILP (d) and frequencies of Treg (Foxp3+), TH17 (Foxp3RORγt+) and TFH (Bcl6+) among HH-E2 tetramer+ T cells in the LILP and CP (e). Data summarize two independent experiments. SILP: small intestinal lamina propria; LILP: large intestinal lamina propria; PP: Peyer’s patches and CP: cecal patch.
Figure 2
Figure 2. H. hepaticus predominantly induces inflammatory TH17 cells in IL-10 deficiency-dependent colitis
a–d, LILP HH7-2tg and SILP 7B8tg donor-derived cells in Il10+/− (n=8) and Il10−/− (n=10) mice were analyzed for Foxp3 and RORγt expression (a), frequencies of Treg (Foxp3+) and TH17 (Foxp3RORγt+) (b), RORγt and T-bet co-expression (c), and frequencies of T-bet expression among TH17 (Foxp3RORγt+) cells (d). Data are from four independent experiments. e, f, IL-17A and IFNγ expression (e) and frequencies of IL-10, IL-17A and IFNγ positive cells (f) among LILP HH7-2tg donor-derived cells in Il10+/− (n=5) and Il10−/− (n=6) mice after re-stimulation. Data summarize two independent experiments. All statistics were calculated by unpaired two-sided Welch’s t-test. Error bars: mean ± 1 SD. P values are as follows: b, i=9.48x10⁻¹² and ii=1.11x10⁻¹³. d, i=2.16x10⁻⁹, ii=1.22x10⁻¹⁰ and iii=0.36.
Figure 3
Figure 3. c-Maf is required for the differentiation and function of induced Treg cells in the gut
a, b, Transcription factor staining in total CD4+ (a) and HH-E2 tetramer+ (b) T cells from the LILP of indicated mice. Left panels: RORγt and Foxp3 expression. Right panels: frequencies of indicated Treg (Foxp3+) and TH17 (Foxp3RORγt+) subsets. Mice were colonized with H. hepaticus for 5~6 weeks before analysis. Data summarize 3 independent experiments for RorcΔTreg (n=7) and littermate controls (n=7 for panel a and n=6 for b), and 4 independent experiments for MafΔTreg (n=10) and littermate controls (n=8). c–e, Co-transfer of MafΔTreg and control HH7-2tg T cells into WT H. hepaticus-colonized mice. c, Left: donor cell composition in the LILP of recipient mice. Right: RORγt and Foxp3 expression in indicated donor-derived cells. d, Ratios of MafΔTreg vs control HH7-2tg donor-derived cells in the LILP. Dashed line represents ratio of co-transferred cells prior to transfer. e, Frequencies of Treg (Foxp3+) and TH17 (Foxp3RORγt+) cells among donor-derived cells. Data are a summary of 10 mice from 2 independent experiments. a, b, e, Statistics were calculated by unpaired two-sided Welch’s t-test. Error bars: mean ± 1 SD. P values are as follows: a, i=1.21x10⁻⁶, ii=8.82x10⁻⁷, iii=0.016, iv=6.38x10⁻⁴, v=8.06x10⁻⁴ and vi=9.89x10⁻⁷. b, i=0.056, ii=7.48x10⁻⁴, iii=7.64x10⁻⁷ and iv=6.01x10⁻⁶. e, i=6x10⁻¹⁴ and ii=0.86. f, MA plot depicting RNA-seq comparison of donor naïve T cell-derived MafΔTreg vs. control Foxp3-YFP+ iTreg cells (mean of 2 biologically independent experiments). Blue dots indicate 190 up-regulated and 75 down-regulated genes in c-Maf-dependent signature. Highlighted blue dots represent down-regulated genes related to Treg function and highlighted red dots indicate genes that are also dependent on RORγt. Differentially expressed genes were calculated in DESeq2 using the Wald test with Benjamini-Hochberg correction to determine FDR (FDR<0.1 and Log2 fold change > 1.5).
Figure 4
Figure 4. RORγt+ iTreg cells are required to maintain gut homeostasis
a, Frequency of rectal prolapse by genotype. b, Spleens and mesenteric lymph nodes (mLNs) from MafΔTreg and littermate controls (left). Total cell numbers in mLNs (right). Data summarize 3 independent experiments for RorcΔTreg (n=6) and littermate controls (n=7), and 4 independent experiments for MafΔTreg (n=9) and littermate controls (n=8). c, Number of leukocytes in the LILP. Data summarize 3 independent experiments for RorcΔTreg (n=7) and littermate controls (n=8), and 4 independent experiments for MafΔTreg and littermate controls (n=9). d, Representative histology of LI sections (left) and colitis scores (right) of mice with indicated genotypes. RorcΔTreg (n=8) and littermate controls (n=9). MafΔTreg (n=11) and littermate controls (n=9). e, Colitis scores in aged H. hepaticus-negative MafΔTreg (n=6) and littermate control (n=7) mice. f, g, Suppression of H. hepaticus-specific TCRtg cell mediated transfer colitis by in vitro differentiated iTreg. Data summarize 2 independent experiments with indicated sample size (n) in total. Colitis scores for Rag1−/− mice that received the indicated TCRtg naïve T cells and iTreg combinations. All statistics were calculated by unpaired two-sided Welch’s t-test. Error bars: mean ± 1 SD. P values are indicated in the figure or as follows: f, i=5.34x10⁻⁴, ii=1.24x10⁻², iii=3.64x10⁻⁴, iv=0.056, v=3.26x10⁻⁴ and vi=4.54x10⁻³. g, i=0.013, ii=2.50x10⁻³, iii=4.59x10⁻⁴, iv=0.024, v=0.12 and vi=0.016.

Comment in

  • Microbiota: Pathobiont peacekeepers.
    Minton K. Minton K. Nat Rev Immunol. 2018 Mar;18(3):152. doi: 10.1038/nri.2018.11. Epub 2018 Feb 16. Nat Rev Immunol. 2018. PMID: 29449703 No abstract available.

References

    1. Round JL, Mazmanian SK. The gut microbiota shapes intestinal immune responses during health and disease. Nat Rev Immunol. 2009;9:313–323. doi: 10.1038/nri2515. - DOI - PMC - PubMed
    1. Hooper LV, Littman DR, Macpherson AJ. Interactions between the microbiota and the immune system. Science. 2012;336:1268–1273. doi: 10.1126/science.1223490. - DOI - PMC - PubMed
    1. Kamada N, Seo SU, Chen GY, Nunez G. Role of the gut microbiota in immunity and inflammatory disease. Nat Rev Immunol. 2013;13:321–335. doi: 10.1038/nri3430. - DOI - PubMed
    1. Chow J, Tang H, Mazmanian SK. Pathobionts of the gastrointestinal microbiota and inflammatory disease. Curr Opin Immunol. 2011;23:473–480. doi: 10.1016/j.coi.2011.07.010. - DOI - PMC - PubMed
    1. Kullberg MC, et al. IL-23 plays a key role in Helicobacter hepaticus-induced T cell-dependent colitis. J Exp Med. 2006;203:2485–2494. doi: 10.1084/jem.20061082. - DOI - PMC - PubMed

Publication types

MeSH terms

Substances