. 2018 Feb 15;554(7692):328-333.
doi: 10.1038/nature25463. Epub 2018 Feb 7.

Teneurin-3 controls topographic circuit assembly in the hippocampus

Affiliations

Teneurin-3 controls topographic circuit assembly in the hippocampus

Dominic S Berns et al. Nature. .

Abstract

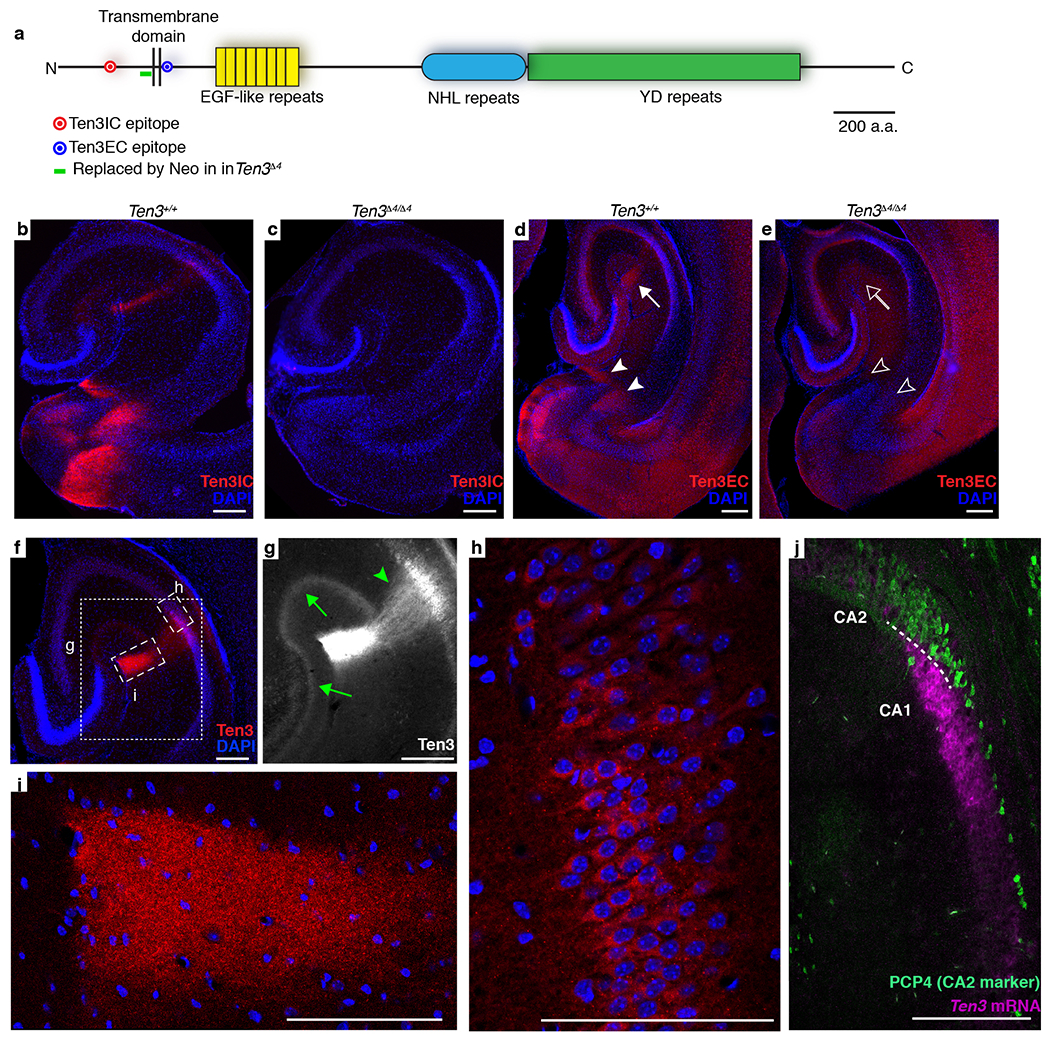
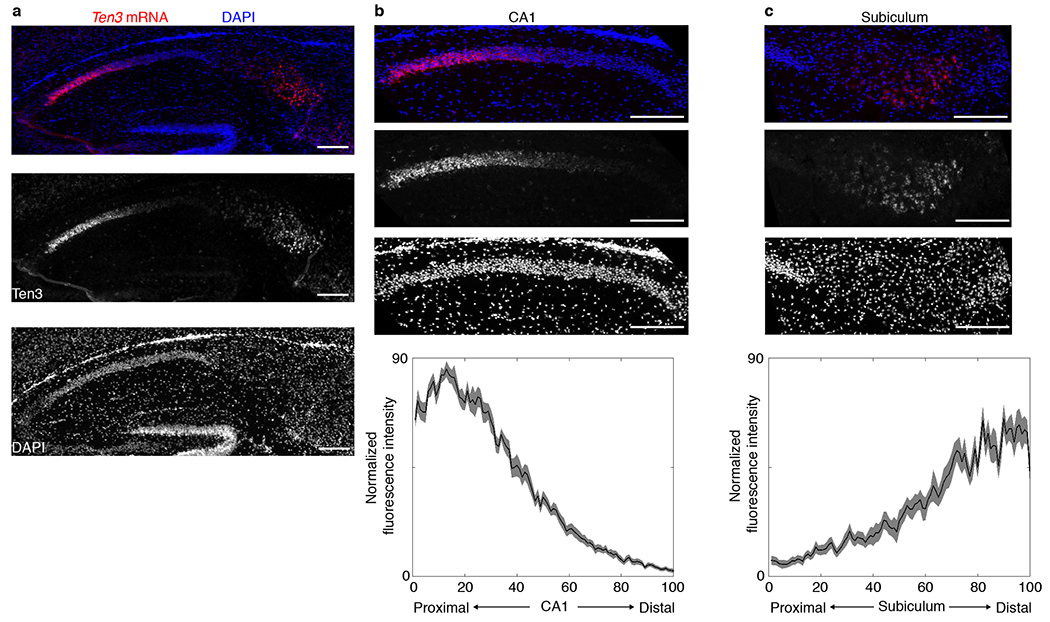
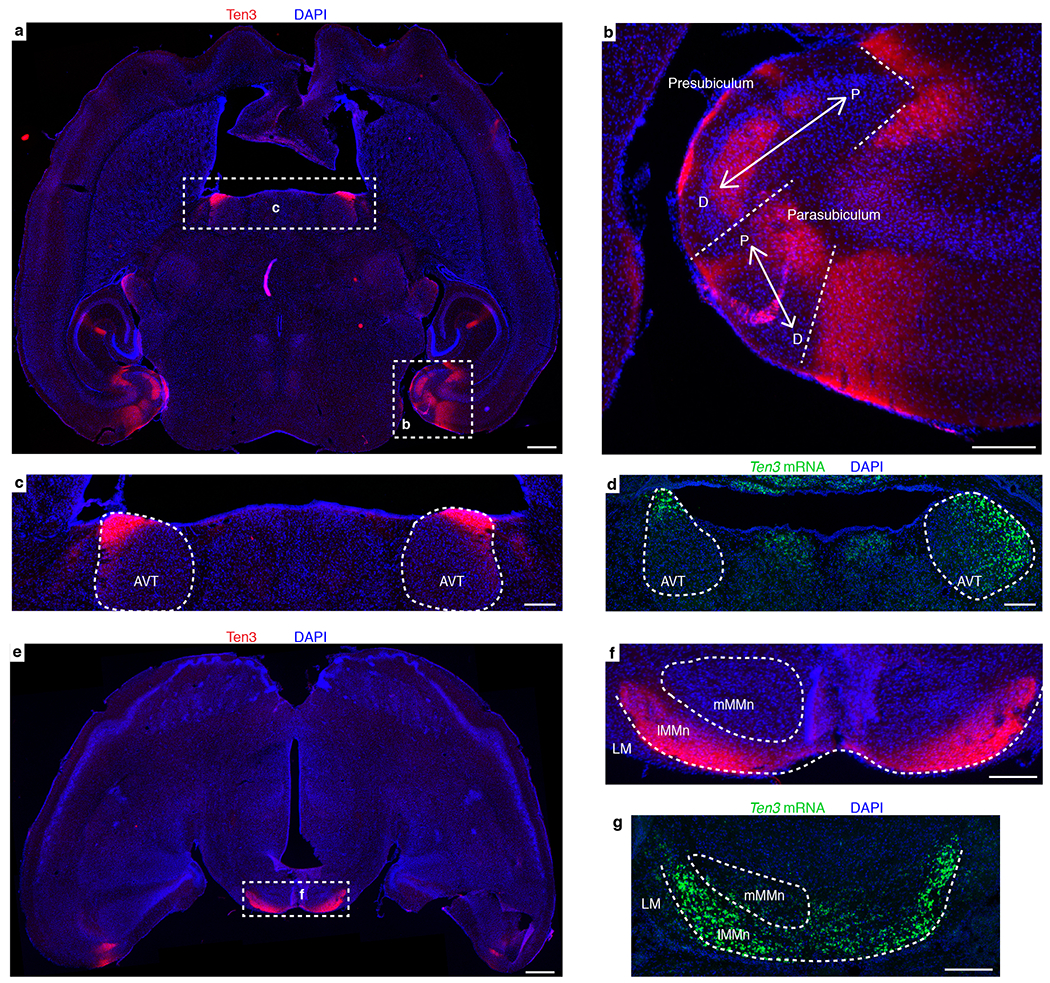
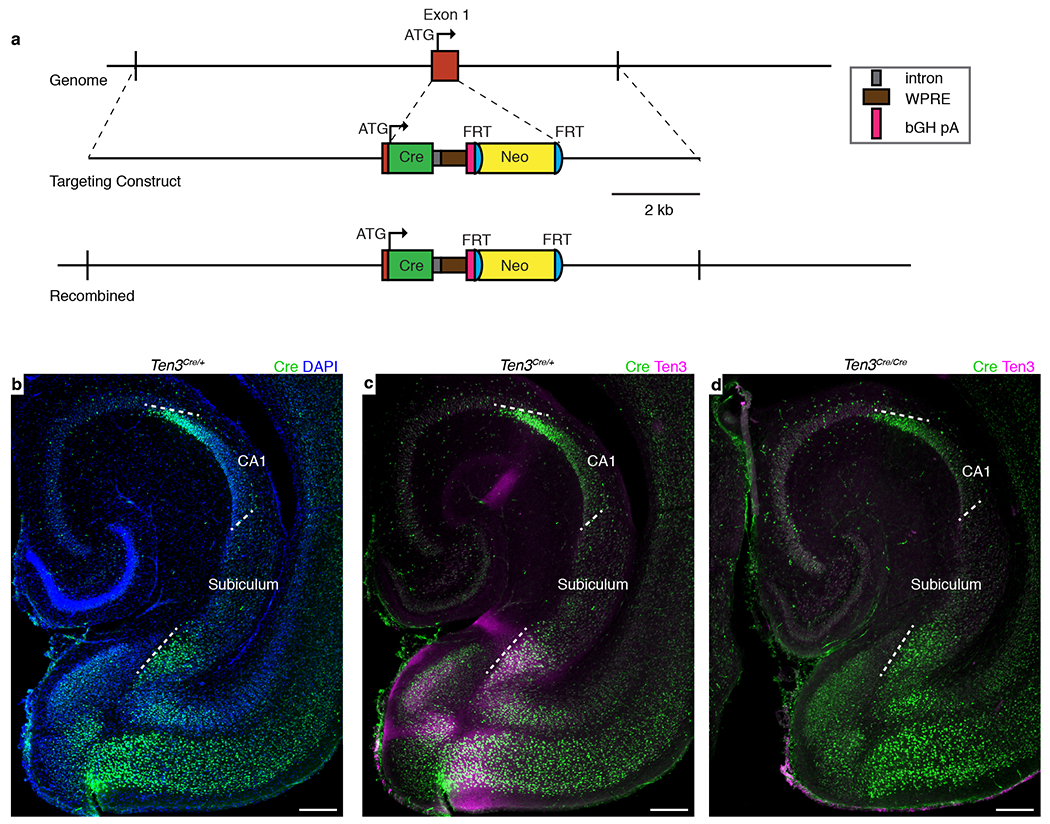
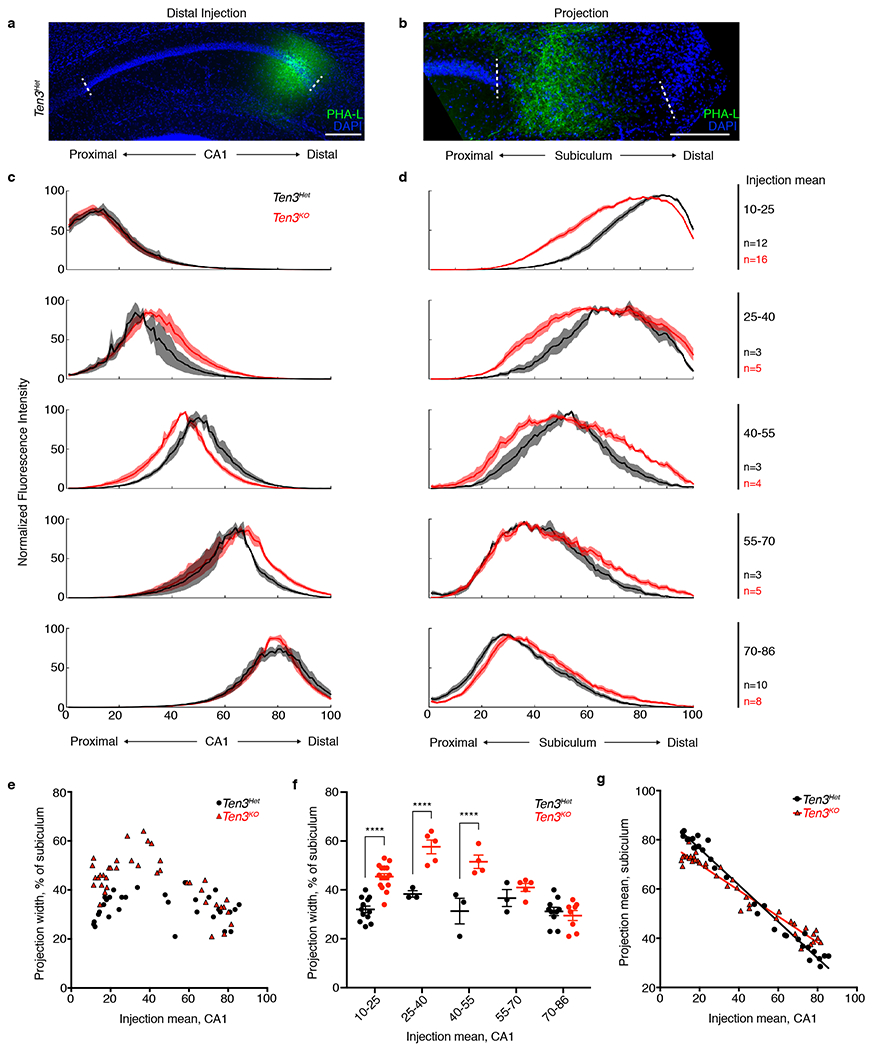
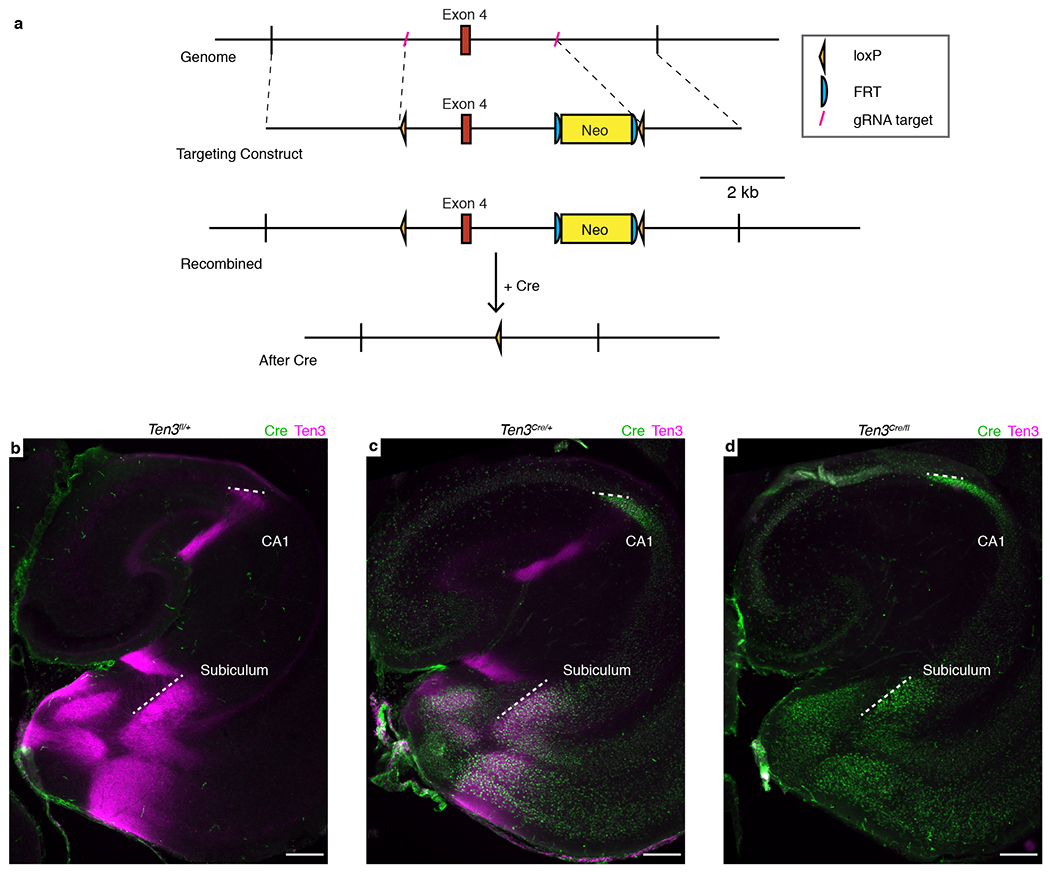
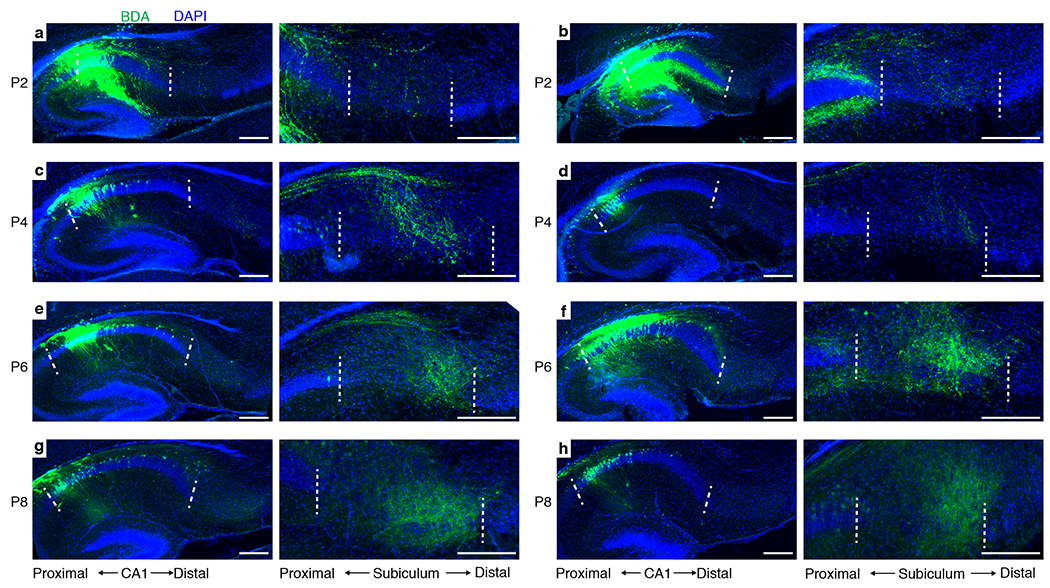
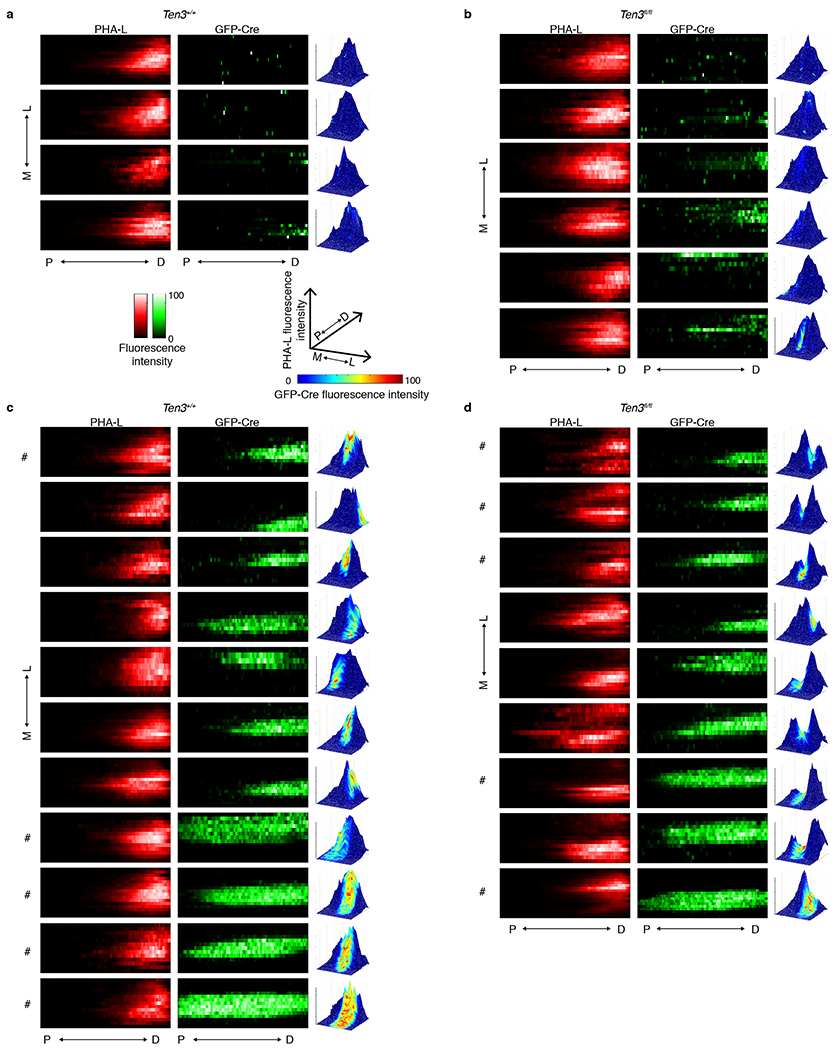
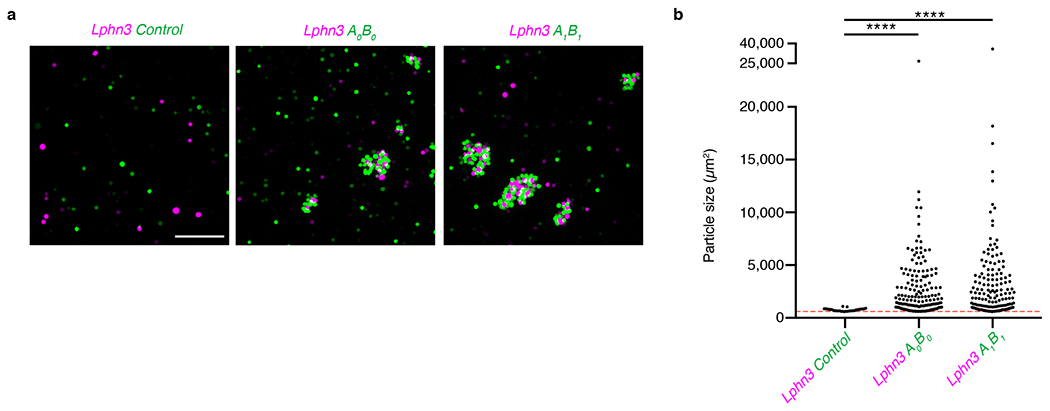
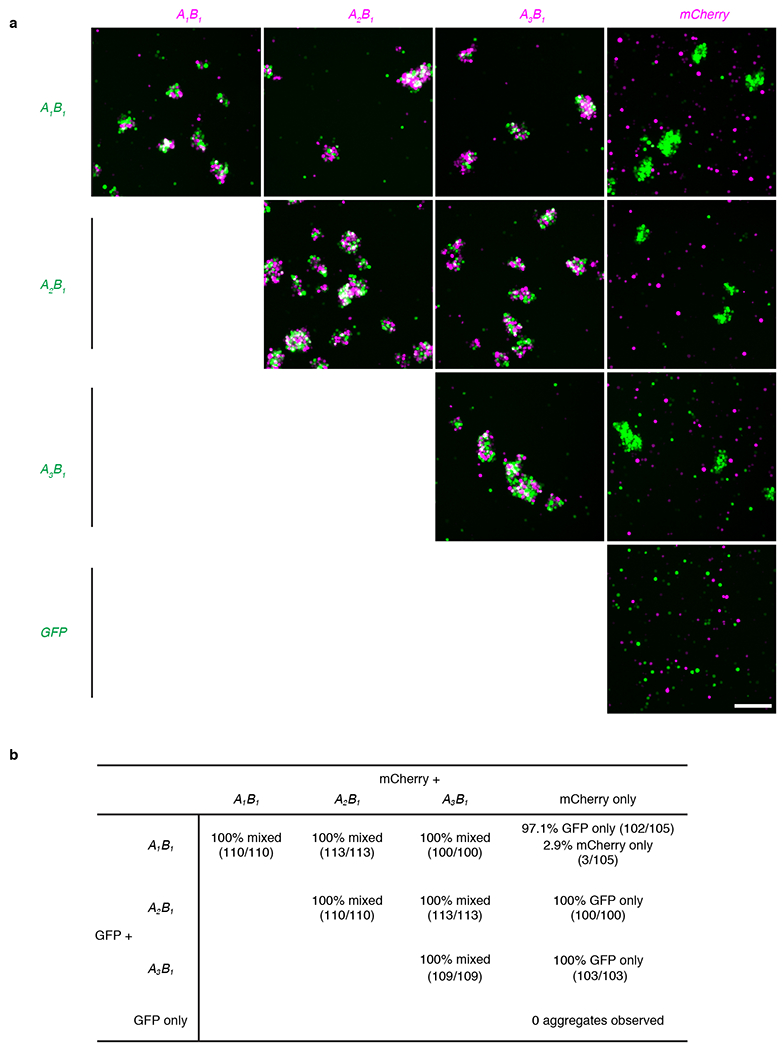
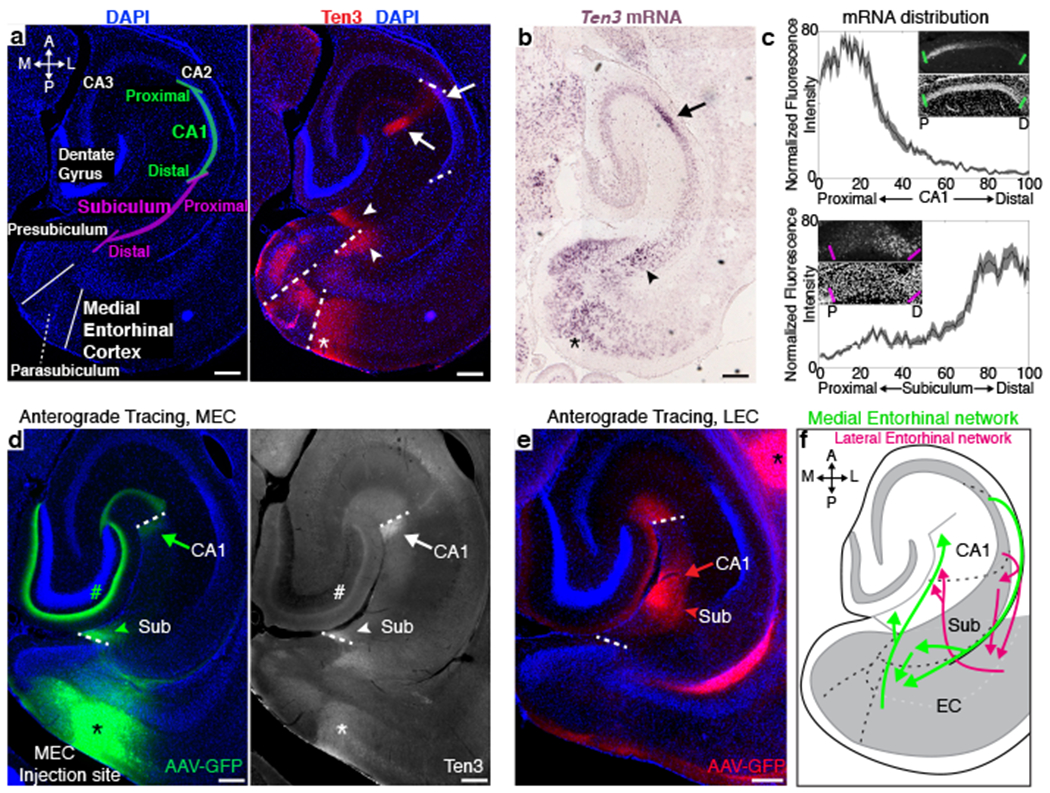
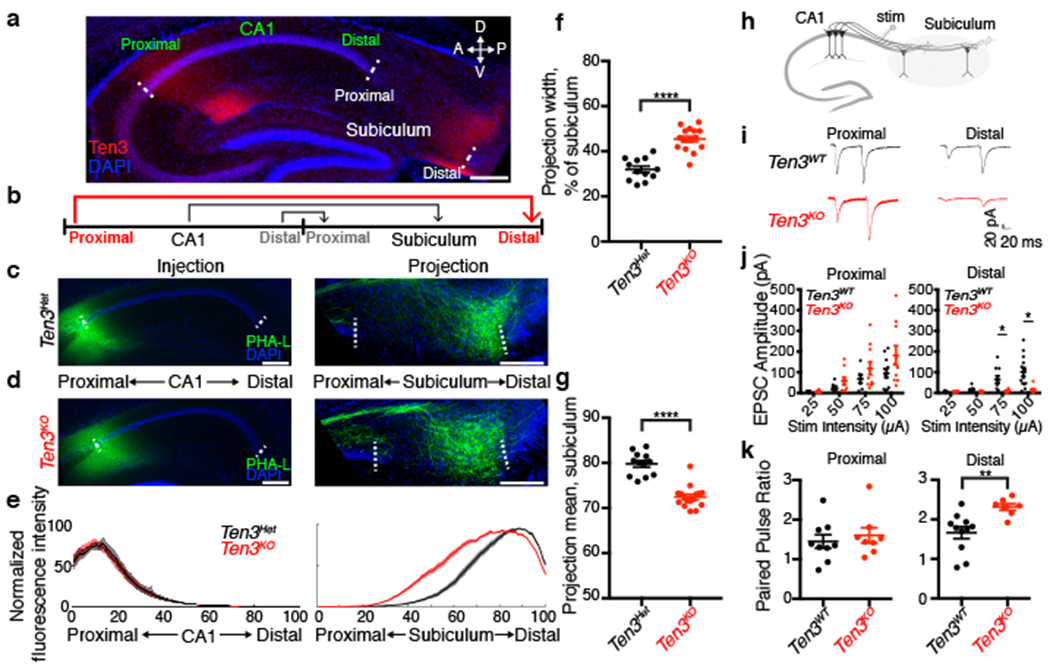
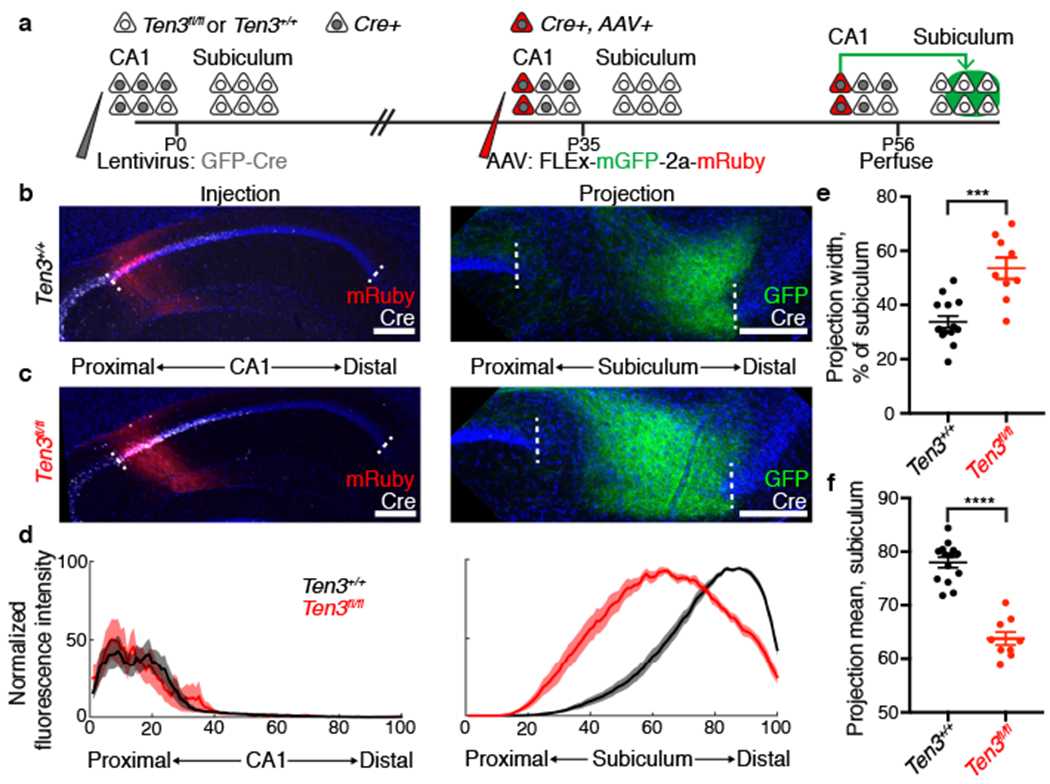
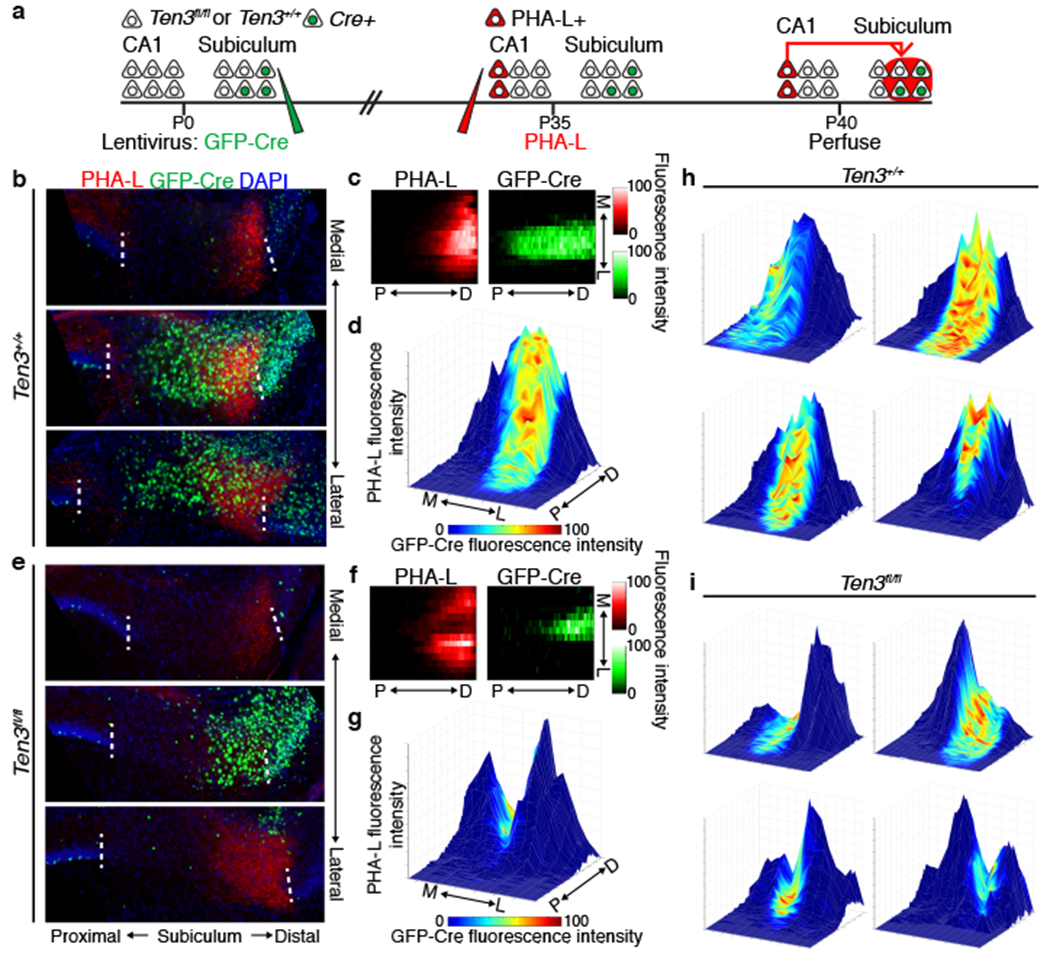
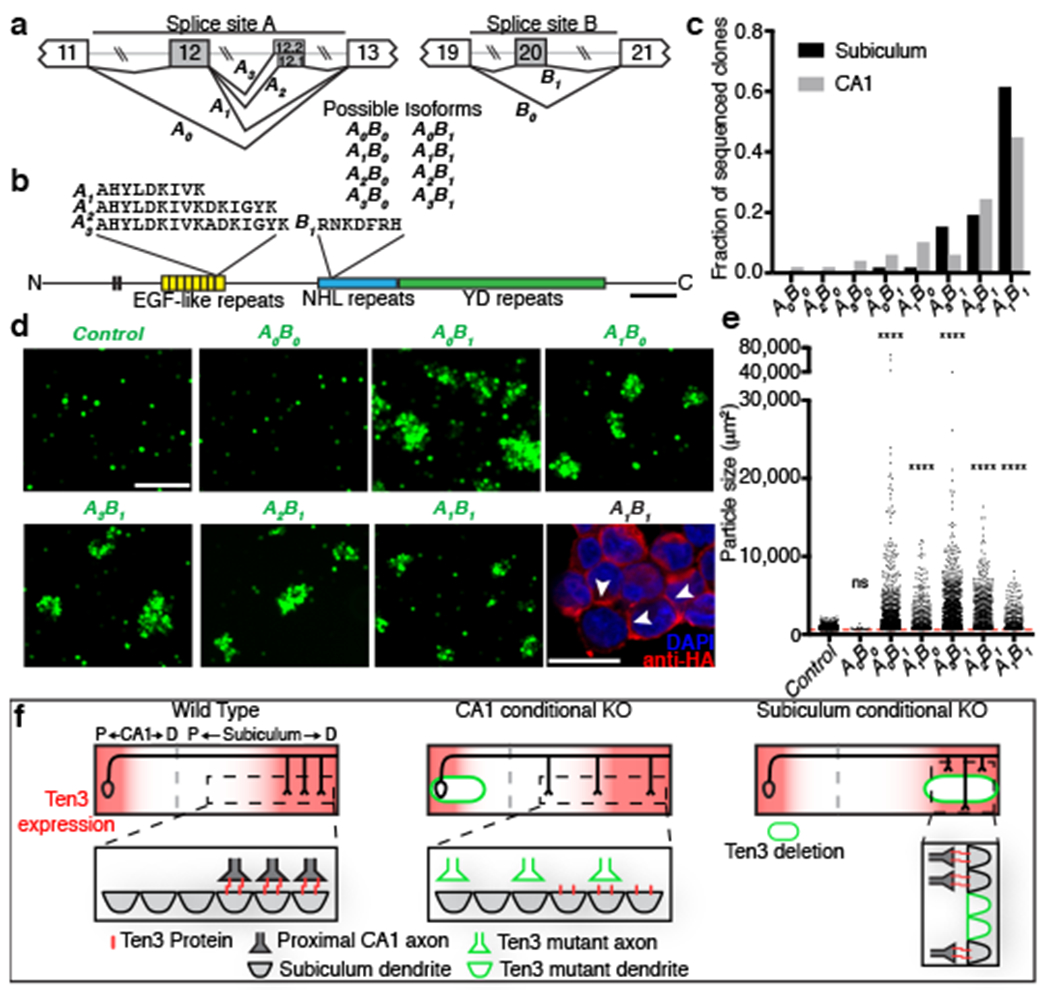
Brain functions rely on specific patterns of connectivity. Teneurins are evolutionarily conserved transmembrane proteins that instruct synaptic partner matching in Drosophila and are required for vertebrate visual system development. The roles of vertebrate teneurins in connectivity beyond the visual system remain largely unknown and their mechanisms of action have not been demonstrated. Here we show that mouse teneurin-3 is expressed in multiple topographically interconnected areas of the hippocampal region, including proximal CA1, distal subiculum, and medial entorhinal cortex. Viral-genetic analyses reveal that teneurin-3 is required in both CA1 and subicular neurons for the precise targeting of proximal CA1 axons to distal subiculum. Furthermore, teneurin-3 promotes homophilic adhesion in vitro in a splicing isoform-dependent manner. These findings demonstrate striking genetic heterogeneity across multiple hippocampal areas and suggest that teneurin-3 may orchestrate the assembly of a complex distributed circuit in the mammalian brain via matching expression and homophilic attraction.


Conflict of interest statement

Author Information The authors declare no competing financial interests.

Figures

Extended Data Figure 1 |
Extended Data Figure 1 |. Ten3 staining details and controls.
a, Diagram of Ten3 protein showing location of antibody epitopes, specific domains, and region deleted in the Ten3Δ4 mutant. In Ten3Δ4, a neomycin resistance cassette replaces 110 bp of sequence directly N-terminal to the transmembrane domain. The Ten3IC antibody is used for all Ten3 staining in the paper except (d, e) of this figure. Scale bar represents 200 amino acids. b, c, Ten3IC staining (red) on P9 horizontal sections of wild-type Ten3+/+ (b) and mutant Ten3Δ44 (c) brains, showing loss of staining in Ten3 mutants. Note that the Ten3IC epitope is located N-terminal to Δ4, suggesting that in Ten3Δ44 either the mRNA undergoes nonsense-mediated decay, or the truncated protein is not stable. d, e, Ten3EC staining on P10 horizontal sections of wild-type Ten3+/+ (d) and mutant Ten3Δ44 (e) brains. Staining has higher background than Ten3IC antibody, but signal is present in proximal CA1 (arrow) and distal subiculum (arrowheads), similar to Ten3IC, which is absent in the knockout (open arrow/arrowheads). f, Ten3 staining (red) on P10 horizontal section with boxes around regions magnified in (g-i). g, Zoom-in showing Ten3 staining in dentate gyrus (DG), CA3, and CA1. Intensity was increased to highlight Ten3 signal in axons and dendrites. Ten3 in stratum radiatum of proximal CA1 (arrowhead) is most likely from CA1 dendrites, since CA3 cells, the major source of axons in this layer, did not express Ten3 mRNA (Fig. 1b). Ten3 in the molecular layers of DG and CA3 (arrows) is likely contributed by the axons of medial entorhinal cortex layer II neurons, since DG and CA3 neurons did not express Ten3 mRNA (Fig. 1b). h, Zoom-in on proximal CA1 pyramidal cell layer showing Ten3 signal in cell bodies. i, Zoom-in on proximal CA1 stratum lacunosum-moleculare, showing Ten3 signal in the region where MEC axons synapse onto CA1 pyramidal neuron dendrites. j, In situ hybridization on P9 horizontal section for Ten3 mRNA (magenta) combined with immunostaining for PCP4 (green), a marker of CA2 neurons. No overlap between Ten3 and PCP4 was observed. Scale bars represent 200 μm in (b–g, j), and 100 μm in (h, i).
Extended Data Figure 2 |
Extended Data Figure 2 |. Distribution of Ten3 mRNA in sagittal sections.
a, In situ hybridization for Ten3 mRNA on sagittal section of P10 brain. Top, merged image with Ten3 mRNA signal in red and DAPI in blue; middle, Ten3 mRNA signal alone; bottom: DAPI signal alone. b, Top panels: magnified image of Ten3 in situ hybridization in CA1; bottom panel: quantification of Ten3 mRNA along the proximal-distal axis of CA1 (n=12 sections, 4 animals), showing a graded signal that peaks in proximal CA1 and decreases to a minimum in distal CA1. Proximal-distal axis is divided into 100 bins, with 1 being most proximal and 100 most distal. Shaded curves represent mean ± s.e.m. c, Top panels: magnified image of Ten3 in situ hybridization in subiculum; bottom panel: quantification of Ten3 mRNA along the proximal-distal axis of subiculum (n=14 sections, 4 animals) showing a graded signal that peaks in distal subiculum and decreases to a minimum in proximal subiculum. The distributions in CA1 and subiculum are similarly shaped but reversed along the proximal-distal axis, reflecting the graded topographic connections along this axis (see Fig. 2, Extended Data Fig. 5c). Scale bars represent 200 μm in all panels.
Extended Data Figure 3 |
Extended Data Figure 3 |. Ten3 expression and topography details.
a, Ten3 staining (red) on P10 horizontal section. Dotted rectangles highlight staining in the hippocampal region and anteroventral thalamic nucleus, which are magnified in (b) and (c). b, Zoom-in on parahippocampal region, showing expression of Ten3 relative to the proximal-distal (P-D) axes (arrows) in the presubiculum and parasubiculum. The connectivity of these regions is complex,, but appears to be consistent with preferential connectivity between Ten3-expressing subregions. Ten3 is expressed in distal presubiculum (close to parasubiculum), which projects to medial entorhinal cortex near the parasubicular border, and receives projections from distal subiculum, both Ten3-high subregions. Ten3 is also expressed in proximal parasubiculum, which projects to medial entorhinal cortex and receives projections from distal subiculum, again both Ten3-high subregions. c, Zoom-in on anteroventral thalamus, showing intense Ten3 staining in anterior and lateral division of the anteroventral thalamic nucleus (AVT, outlined). Distal subiculum, another Ten3-high region, projects to the AVT, whereas proximal subiculum projects to the anteromedial thalamus. d, In situ hybridization for Ten3 mRNA (green) on P9 horizontal section from similar location as (c). e, Ten3 staining (red) on P10 horizontal section, more ventral than (a). Dotted rectangle highlights intense staining in medial mammillary nucleus, which is magnified in (f). f, Zoom-in on medial mammillary nucleus, showing Ten3 labeling in the lateral division of the medial mammillary nucleus (lMMn). Outlines show location of lateral mammillary nucleus (LM), lMMn, and medial subdivision of the medial mammillary nucleus (mMMn). Proximal subicular neurons project to mMMn, whereas Ten3-high distal subicular neurons project to Ten3-high lMMn,–. lMMn neurons project to Ten3-high AVT, while mMMn neurons project to the anteromedial thalamic nucleus. g, In situ hybridization for Ten3 mRNA (green) on P9 horizontal section from similar location as (f). Scale bars represent 500 μm in (a) and (e) and 200 μm elsewhere. In summary, the pattern of Ten3-high to Ten3-high connectivity observed for CA1, subiculum, and entorhinal cortex appears to extend to many of the topographic projections formed between these subregions and the presubiculum, parasubiculum, thalamus, and mammillary nucleus.
Extended Data Figure 4 |
Extended Data Figure 4 |. Generation and characterization of Ten3Cre.
a, Design of Ten3Cre. Top – Region of chromosome 8 containing Ten3 exon 1, which contains the start codon (ATG). Middle – Targeting construct with Cre open reading frame inserted directly after the Ten3 start codon. Cre is followed by a synthetic intron, woodchuck hepatitis virus posttranscriptional regulatory element (WPRE), and bovine growth hormone polyadenylation sequence (bGH pA) (see key on right). The neomycin resistance cassette (Neo) includes PGK promoter driving the resistance gene. Bottom – Genomic region after homologous recombination. The endogenous exon 1 sequence after the start codon is replaced with Cre. Neo cassette was not removed by FLP-mediated recombination in the mice used in Fig. 2. b-d, Cre and Ten3 protein expression in P10 horizontal sections from Ten3Cre mice. White dotted lines highlight proximal and distal borders of CA1 and subiculum. (b, c) Cre expression (green) mimics the distribution of Ten3 expression (magenta) in Ten3Cre/+ mice. (d) In Ten3Cre/Cre mice, Ten3 immunostaining is absent. Scale bars, 200 μm.
Extended Data Figure 5 |
Extended Data Figure 5 |. Analysis of CA1→subiculum projections with various injection sites in Ten3Het control and Ten3KO mice.
a, b, PHA-L (green) injection in distal CA1 (a) and corresponding projection in proximal subiculum (b) in Ten3Het mouse. Scale bars, 200 μm c, d Averaged normalized injection (c) and projection (d) traces of all Ten3Het (black) and Ten3KO (red) mice analyzed, binned into 5 groups by the mean position of the injection, and plotted from most proximal (top) to most distal (bottom) injections (bin limits and number of animals per bin listed on the right of (d). Proximal-distal axis position is numbered from 1 (most proximal) to 100 (most distal). Shaded error curves represent mean ± s.e.m. at each bin. e, Projection width in subiculum versus injection mean position in CA1 for all animals (Ten3Het: n = 31, black circles; Ten3KO: n = 38, red triangles). f, Projection width data binned by injection mean. Number of animals per bin same as (d). Projection width was significantly increased in Ten3KO for the 3 most proximal bins. **** denotes p < 0.0001; multiplicity adjusted p-values after 2-way ANOVA with Sidak correction for multiple comparisons. Error bars are mean ± s.e.m. g, Projection mean position in subiculum versus injection mean position in CA1 for all animals used (Ten3Het: n = 31; Ten3KO: n = 38), with superimposed linear regression lines (Ten3Het: R2 = 0.9812; Ten3KO: R2 = 0.9515). The slopes were significantly different (p < 0.0001), indicating a less sharp topography in Ten3KO mice. Bin 1 data (most proximal, injection mean 10-25) in (c–g) is the same data as in Fig. 2e–g.
Extended Data Figure 6 |
Extended Data Figure 6 |. Generation and characterization of Ten3flox.
a, Design of Ten3fl. Top – region of chromosome 8 containing Ten3 exon 4, which is 239 base pairs long and encodes 19 of the 21 amino acids in the transmembrane domain. Guide RNA (gRNA) targets shown in red (see key at right). Line 2 – targeting construct with loxP sites inserted 5’ and 3’ of exon 4. The neomycin resistance cassette (Neo) includes PGK promoter driving the resistance gene. Line 3 – genomic region after homology-directed repair. Bottom – deletion of exon 4 after Cre-mediated recombination between loxP sites. Neo cassette was removed by FLP-mediated recombination in some of the mice used in Fig. 3 and 4. In addition to deleting exon 4, the reading frame 3’ to exon 4 is frame-shifted with respect to the reading frame 5’ to exon 4. b–d, Cre (green) and Ten3 (magenta) protein expression in P10 horizontal sections from Ten3fl/+ (b), Ten3Cre/+ (c), and Ten3Cre/fl (d) mice. Ten3 staining is absent in Ten3Cre/fl mice. White dotted lines highlight proximal and distal borders of CA1 and subiculum. Scale bars, 200 μm.
Extended Data Figure 7 |
Extended Data Figure 7 |. Time-course of CA1→subiculum projection development.
Sagittal sections from animals injected with BDA (green) in CA1 at P0, and perfused for staining at P2 (a, b), P4 (c, d), P6 (e, f), or P8 (g, h). 2 animals are shown for each time point with a pair of images per animal. Within each pair, the left image shows the section that contains the center of the injection site at CA1, whereas the right panel shows a magnified image of the section that contains the highest density of projection at subiculum. Dashed lines mark proximal and distal CA1 borders in the left panels and proximal and distal subicular borders in the right panels. CA1 axons are largely absent at subiculum at P2, and increase intensity from P4 to P8. Scale bars, 200 μm.
Extended Data Figure 8 |
Extended Data Figure 8 |. Subiculum conditional knockout plots.
a, b, Plots from Ten3+/+ (a) and Ten3fl/fl (b) animals with minimal GFP-Cre expression. Heatmaps show normalized PHA-L fluorescence intensity (red, left) and normalized GFP-Cre intensity (green, middle) in subiculum, same animals. Each row is one section, 120 μm between rows, colorbars shown below (a), and proximal-distal position is on the x-axis. Surface plots are shown to the right of the corresponding heatmaps, and show PHA-L fluorescence intensity as height and GFP-Cre fluorescence intensity according to the colormap shown below (a). P, proximal; D, distal; M, medial; L, lateral. Projections are similar between Ten3+/+ and Ten3fl/fl. c, d, Plots from Ten3+/+ (c) and Ten3fl/fl (d) animals with high GFP-Cre expression in subiculum. In Ten3fl/fl animals, PHA-L signal is decreased in GFP-Cre regions. # denotes animals shown in Fig. 4.
Extended Data Figure 9 |
Extended Data Figure 9 |. Latrophilin-3 and Ten3 aggregation assay.
a, Images from aggregation assay with cells co-transfected with Latrophilin-3 (Lphn3) and mCherry (magenta) mixed with cells co-transfected with GFP and empty vector (left), A0B0 isoform of Ten3 (middle), or A1B1 isoform of Ten3 (right). Scale bar, 200 μm, applies to all images. b, Quantification of aggregate sizes pooled from three biological replicates. Dotted red line shows cutoff at 600 μm2, the size of a large GFP+ cell from the control images. Asterisks denote significance from Dunn’s multiple comparisons test after Kruskal-Wallis test, comparing all conditions to the Lphn3 and control mix, Lphn3 + control: n = 32 particles above threshold; Lphn3 + A0B0: n = 172; Lphn3 + A1B1: n = 159. ns, not significant; **** p ≤ 0.0001, multiplicity adjusted p-values.
Extended Data Figure 10 |
Extended Data Figure 10 |. Aggregation assays for cells expressing different Ten3 splicing isoforms.
a, Cell aggregation assay with combinations of K562 cells expressing the A1B1, A2B1, or A3B1 Ten3 isoform along with GFP or mCherry. Scale bar in bottom right panel, 200 μm, applies to all images. b, Quantification of aggregates observed in 3 biological replicates of the aggregation experiment in a. At least 100 aggregates were counted across the 3 replicates in each of the 10 mixing conditions, except for the GFP-alone and mCherry-alone control, where no aggregates were observed. 100% of aggregates were mixed in combinations where both cell populations expressed a Ten3 isoform. No mixed aggregates were observed in combinations of Ten3-expressing cells with cells expressing mCherry alone, confirming that the aggregation is Ten3-dependent and not due to an endogenously expressed interaction partner. Fractions in parentheses indicate aggregates of a particular type out of all aggregates counted in that condition.
Figure 1 |
Figure 1 |. Ten3 expression in the developing hippocampal region.
a, Left, diagram of the hippocampal region on a horizontal section of P10 mouse brain. A, anterior; P, posterior; M, medial; L, lateral. Right, same section with Ten3 immunostaining. b, In situ hybridization for Ten3 mRNA on a P9 horizontal section. In (a) and (b),_arrows denote proximal CA1; arrowheads, distal subiculum; asterisk, MEC. c, Quantification of Ten3 mRNA along the proximal-distal (P-D) axis of CA1 (n=12 sections, 4 animals) and subiculum (n=14 sections, 4 animals) of P10 horizontal sections. Insets: Ten3 mRNA (top) and DAPI staining (bottom). x-axis represents bin along the proximal-distal axis of CA1 or subiculum. Shaded curves, mean ± s.e.m. d, Labeling of MEC axons projecting to hippocampus in P70 brain after AAV1-CMV-GFP injection in MEC (asterisk) (left) and Ten3 staining on the same section (right). GFP in layer III MEC axons overlaps with Ten3 in proximal CA1 (arrows) and distal subiculum (arrowheads); GFP in layer II MEC axons also overlaps with Ten3 in dentate gyrus (#). e, Labeling of LEC axons in P55 brain projecting to distal CA1 (arrow) and proximal subiculum (arrowhead). Asterisk identifies track to the more ventral injection site. f, Summary of topographic connections between MEC, proximal CA1, and distal subiculum (green arrows), and between LEC, distal CA1, and proximal subiculum (red arrows). Scale bars, 200 μm.
Figure 2 |
Figure 2 |. Ten3 is required for the precise CA1→subiculum projection.
a, Sagittal section of P11 hippocampus, showing Ten3 expression in proximal CA1 and distal subiculum. A, anterior; P, posterior; D, dorsal; V, ventral. b, Diagram of the CA1→subiculum topographic projection, with Ten3-high regions and axons in red. c, d, PHA-L (green) injections in proximal CA1 and corresponding projections in subiculum of Ten3Het (c) or Ten3KO (d) mice. e, Averaged normalized fluorescence intensity traces for proximal injections in CA1 (left) and corresponding projections in subiculum (right) for Ten3Het (black, n=12 animals) and Ten3KO (red, n=16 animals). x-axis represents bin along the proximal-distal axis of CA1 or subiculum. Shaded curves represent mean ± s.e.m. at each bin. f, g, Projection width-at-half-max (f) and mean position (g) for Ten3Het and Ten3KO. **** p < 0.0001 (Ten3Het: n=12; Ten3KO: n=16; two-tailed t-test). h, Diagram of stimulating electrode (stim) and recording sites. i, EPSC traces from proximal and distal subicular cells in Ten3WT and Ten3KO. j, Average EPSC amplitude in proximal (left) and distal (right) subicular cells from Ten3WT and Ten3KO at increasing stimulation intensities (Proximal: Ten3WT, n = 12 cells; Ten3KO, n = 11 cells; p > 0.05 for all stimulation intensities. Distal: Ten3WT, n = 14 cells, 6 animals; Ten3KO, n = 9 cells, 7 animals; 75 μA stim, p = 0.035; 100 μA stim, p = 0.022, adjusted p-values from two-tailed t-tests with Holm-Sidak correction). k, Paired pulse ratio for proximal (left) and distal (right) subicular cells from Ten3WT and Ten3KO mice. (Proximal: Ten3WT, n = 9 cells, 6 animals; Ten3KO, n = 8 cells, 7 animals; p = 0.5566. Distal, Ten3WT: n = 11 cells, 6 animals; Ten3KO: n = 7 cells, 7 animals; p = 0.0049, two-tailed t-test). Scale bars, 200 μm. Error bars represent mean ± s.e.m.
Figure 3 |
Figure 3 |. Ten3 conditional knockout in CA1.
a, Experimental scheme. b, c, AAV injections in proximal CA1 (left) and corresponding projections in subiculum (right) of Ten3+/+ (b) and Ten3fl/fl (c) animals. Red, injections; green, projections; white, Cre staining. d, Average normalized fluorescence intensity traces for proximal CA1 injections (left) and corresponding subicular projections (right) for control (black, n = 14) and CA1 conditional knockout (red, n = 9) animals. e, f, Projection width-at-half-max (e) and mean position (f) for control and knockout animals. ***p = 0.0001, **** p < 0.0001, two-tailed t-tests. Scale bars, 200 μm. Error bars, mean ± s.e.m.
Figure 4 |
Figure 4 |. Ten3 conditional knockout in subiculum.
a, Experimental scheme. b, e, Example images from Ten3+/+ (b) and Ten3fl/fl (e) animals, showing axons from proximal CA1 PHA-L injection in red, and GFP-Cre in subiculum in green. Three 60-μm sections are arranged from medial to lateral, 480-600 μm between sections. c, f, Heatmaps showing normalized PHA-L fluorescence intensity (red, left) and normalized GFP-Cre intensity (green, right) in subiculum, same animals as (b) and (e). Each row is one section, 120 μm between rows. P, proximal; D, distal; M, medial; L, lateral. d, g, Surface plots showing normalized PHA-L intensity as height, and normalized GFP-Cre intensity as color according to the color map below, same data as (b, c) and (e, f). h, i, Surface plots from additional Ten3+/+ (h) and Ten3fl/fl (i) animals. See Extended Data Fig. 8 for all animals analyzed.
Figure 5 |
Figure 5 |. Ten3 promotes homophilic adhesion in a splicing isoform-dependent manner.
a, Partial Ten3 genomic regions (top) highlighting alternatively spliced exons (gray boxes) and constitutive exons (white boxes). Splice variant names are next to corresponding splicing pattern. b, Locations of alternative splicing sites A and B in Ten3 protein, and amino acid sequences produced. Scale bar, 200 amino acids. c, Summary of cDNA sequencing from P8 subiculum (n=52 clones) and CA1 (n=49 clones). d, Aggregation of K562 cells expressing different Ten3 isoforms and GFP. Scale bar, 200 μm. Bottom right panel: A1B1 aggregate stained for the N-terminal HA tag (red). Arrowheads highlight membrane-localized Ten3 at cell-cell junctions. Scale bar, 20 μm. e, Quantification of aggregate sizes pooled from three biological replicates. Dotted red line shows size cutoff at 600 μm2. ns, not significant; **** p ≤ 0.0001, adjusted p-values from Dunn’s multiple comparisons test after Kruskal-Wallis test, comparing all conditions to GFP. GFP, n = 1449 particles above threshold; A0B0, n = 26; A0B1, n = 1179; A1B0, n= 411; A3B1, n = 1268; A2B1, n= 628; A1B1, n= 336. f, Summary of data (top) and working model (bottom). See Discussion for details.

References

    1. Scoville WB & Milner B Loss of recent memory after bilateral hippocampal lesions. J. Neurol. Neurosurg. Psychiatry 20, 11–21 (1957). - PMC - PubMed
    1. Squire LR, Stark CEL & Clark RE The medial temporal lobe. Annu. Rev. Neurosci 27, 279–306 (2004). - PubMed
    1. O’Keefe J & Dostrovsky J The hippocampus as a spatial map. Preliminary evidence from unit activity in the freely-moving rat. Brain Res. 34, 171–175 (1971). - PubMed
    1. Hafting T, Fyhn M, Molden S, Moser M & Moser EI Microstructure of a spatial map in the entorhinal cortex. Nature 436, 801–806 (2005). - PubMed
    1. van Strien NM, Cappaert NLM & Witter MP The anatomy of memory: an interactive overview of the parahippocampal–hippocampal network. Nat. Rev. Neurosci 10, 272–282 (2009). - PubMed

Additional References:

    1. Witter M in The Mouse Nervous System p112–139 (Elsevier Inc, 2012).
    1. Kohara K et al. Cell type-specific genetic and optogenetic tools reveal hippocampal CA2 circuits. Nat. Neurosci 17, 269–279 (2014). - PMC - PubMed
    1. Caballero-Bleda M & Witter MP Regional and laminar organization of projections from the presubiculum and parasubiculum to the entorhinal cortex: an anterograde tracing study in the rat. J. Comp. Neurol 328, 115–129 (1993). - PubMed
    1. Honda Y & Ishizuka N Organization of Connectivity of the Rat Presubiculum: I. Efferent Projections to the Medial Entorhinal Cortex. J. Comp. Neurol 473, 463–484 (2004). - PubMed
    1. O’Reilly KC, Gulden Dahl A, Ulsaker Kruge I & Witter MP Subicular-parahippocampal projections revisited: Development of a complex topography in the rat. J. Comp. Neurol 521, 4284–4299 (2013). - PubMed

Publication types

MeSH terms