

Diversity, distribution and conservation of the terrestrial reptiles of Oman (Sauropsida, Squamata)
- PMID: 29414999
- PMCID: PMC5802441
- DOI: 10.1371/journal.pone.0190389
Diversity, distribution and conservation of the terrestrial reptiles of Oman (Sauropsida, Squamata)
Abstract
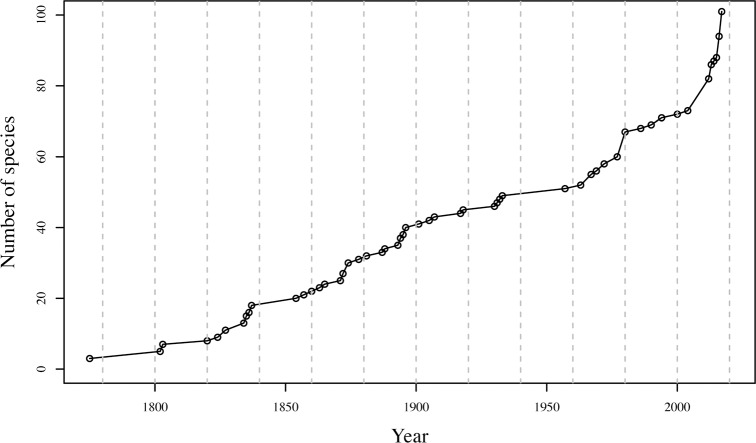
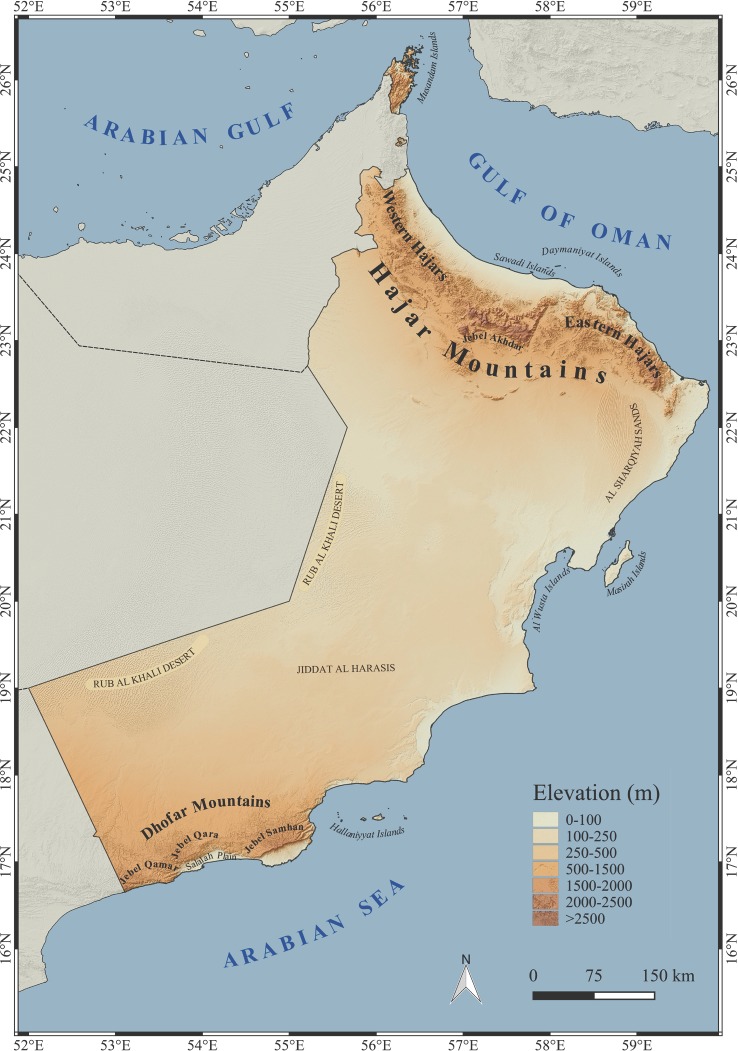
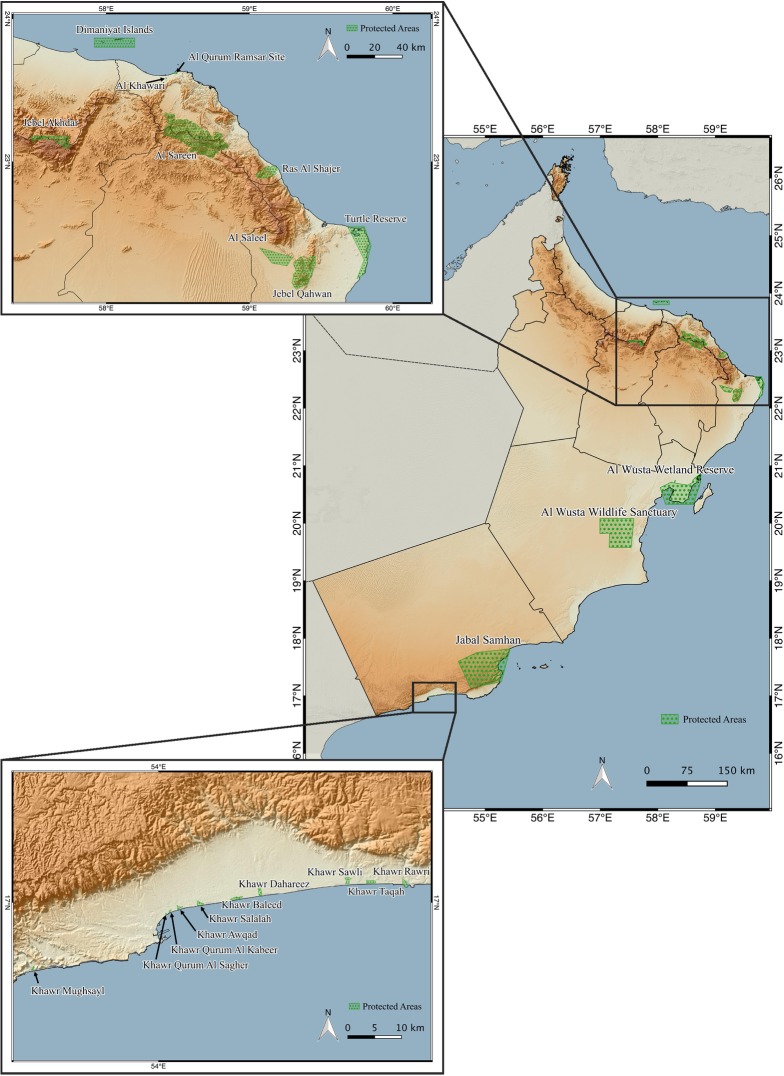
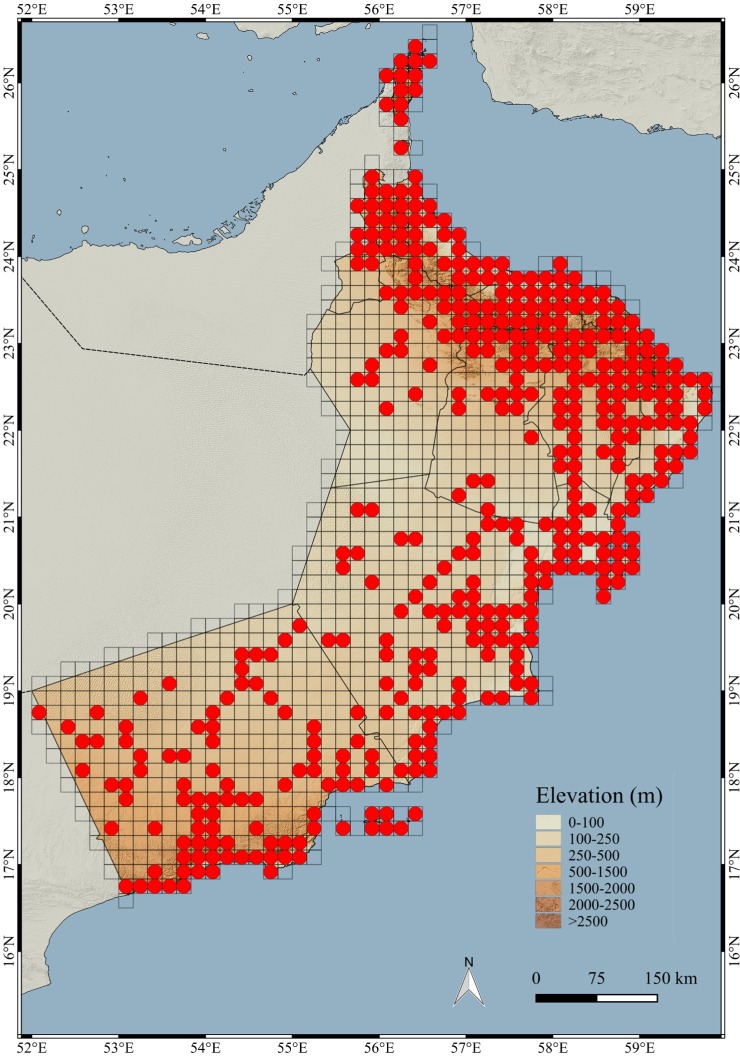
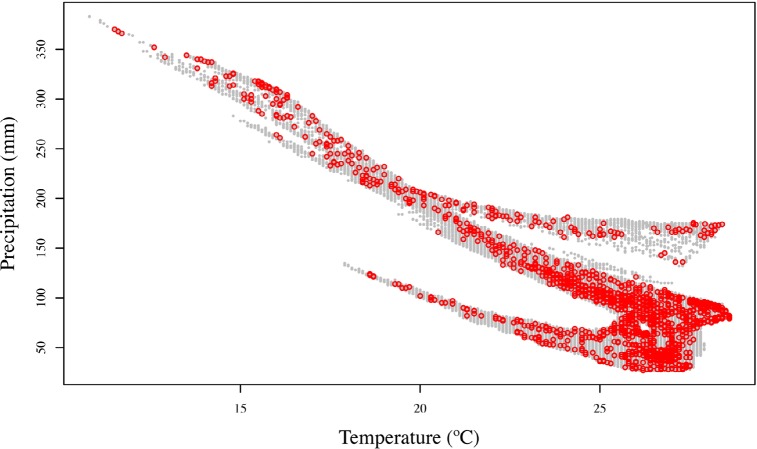
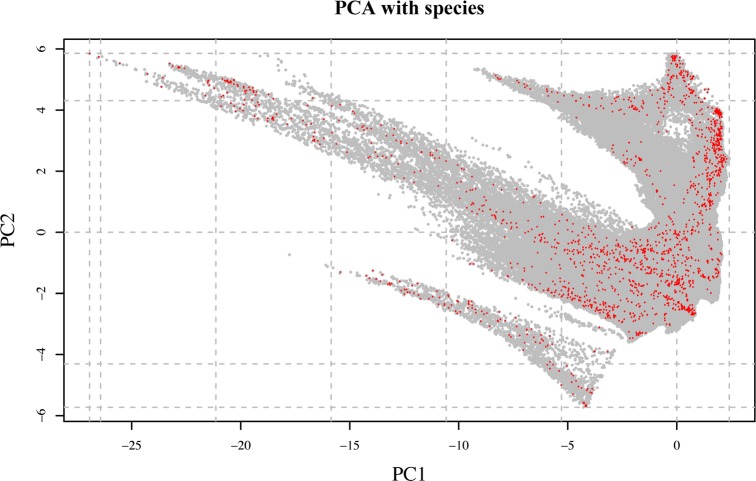
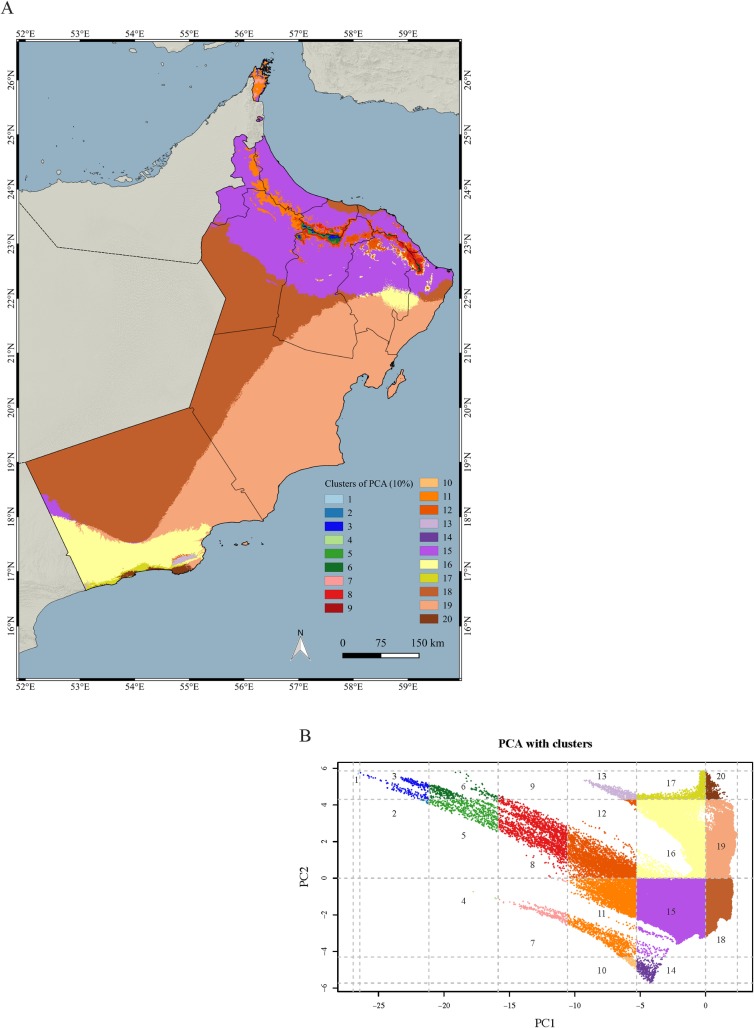
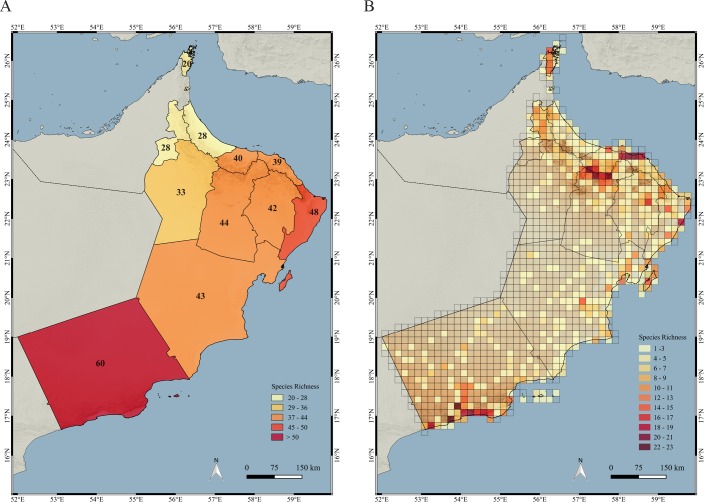
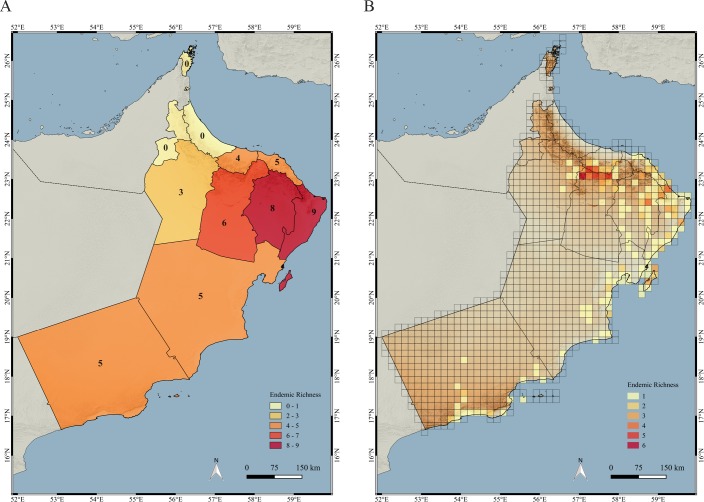
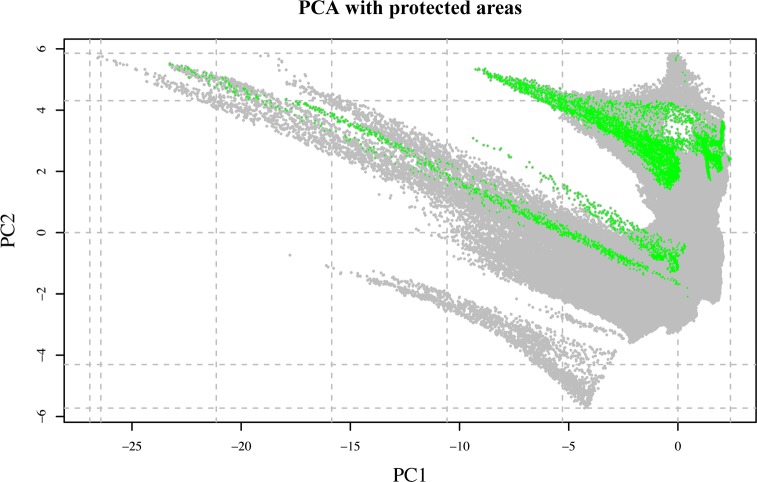
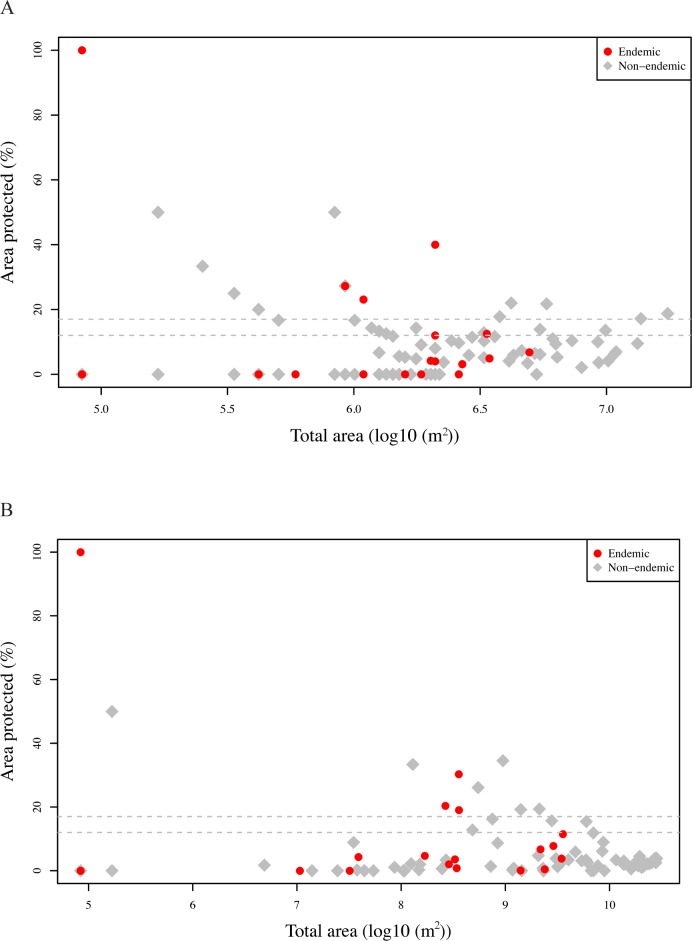
In the present work, we use an exceptional database including 5,359 records of 101 species of Oman's terrestrial reptiles together with spatial tools to infer the spatial patterns of species richness and endemicity, to infer the habitat preference of each species and to better define conservation priorities, with especial focus on the effectiveness of the protected areas in preserving this unique arid fauna. Our results indicate that the sampling effort is not only remarkable from a taxonomic point of view, with multiple observations for most species, but also for the spatial coverage achieved. The observations are distributed almost continuously across the two-dimensional climatic space of Oman defined by the mean annual temperature and the total annual precipitation and across the Principal Component Analysis (PCA) of the multivariate climatic space and are well represented within 17 out of the 20 climatic clusters grouping 10% of the explained climatic variance defined by PC1 and PC2. Species richness is highest in the Hajar and Dhofar Mountains, two of the most biodiverse areas of the Arabian Peninsula, and endemic species richness is greatest in the Jebel Akhdar, the highest part of the Hajar Mountains. Oman's 22 protected areas cover only 3.91% of the country, including within their limits 63.37% of terrestrial reptiles and 50% of all endemics. Our analyses show that large areas of the climatic space of Oman lie outside protected areas and that seven of the 20 climatic clusters are not protected at all. The results of the gap analysis indicate that most of the species are below the conservation target of 17% or even the less restrictive 12% of their total area within a protected area in order to be considered adequately protected. Therefore, an evaluation of the coverage of the current network of protected areas and the identification of priority protected areas for reptiles using reserve design algorithms are urgently needed. Our study also shows that more than half of the species are still pending of a definitive evaluation by the International Union for Conservation of Nature (IUCN).
Conflict of interest statement
Figures
References
-
- Uetz P, Goll J, Hallerman, J. The Reptile Database; 2016. Available from: http://wwwreptile-databaseorg (accessed June 2017).
-
- Pincheira-Donoso D, Bauer AM, Meiri S, Uetz P. Global Taxonomic Diversity of Living Reptiles. PLoS One. 2013; 8(3), e59741 doi: 10.1371/journal.pone.0059741 - DOI - PMC - PubMed
-
- Carranza S, Arnold EN, Mateo J, Lopez-Jurado L. Long-distance colonization and radiation in gekkonid lizards, Tarentola (Reptilia: Gekkonidae), revealed by mitochondrial DNA sequences. Proc R Soc Lond B Biol Sci. 2000; 267, 637–649. doi: 10.1098/rspb.2000.1050 - DOI - PMC - PubMed
-
- Carranza S, Arnold EN. Investigating the origin of transoceanic distributions: mtDNA shows Mabuya lizards (Reptilia, Scincidae) crossed the Atlantic twice. Syst Biodivers. 2003; 1: 275–282. doi: 10.1017/S1477200003001099 - DOI
-
- De Queiroz A. The resurrection of oceanic dispersal in historical biogeography. Trends Ecol Evol. 2005; 20, 68–73. doi: 10.1016/j.tree.2004.11.006 - DOI - PubMed
Publication types
MeSH terms
LinkOut - more resources
Full Text Sources
Other Literature Sources
Research Materials
Miscellaneous
