. 2018 Feb 7;13(2):e0191109.
doi: 10.1371/journal.pone.0191109. eCollection 2018.

Organoids with cancer stem cell-like properties secrete exosomes and HSP90 in a 3D nanoenvironment

Affiliations

Organoids with cancer stem cell-like properties secrete exosomes and HSP90 in a 3D nanoenvironment

Takanori Eguchi et al. PLoS One. .

Abstract

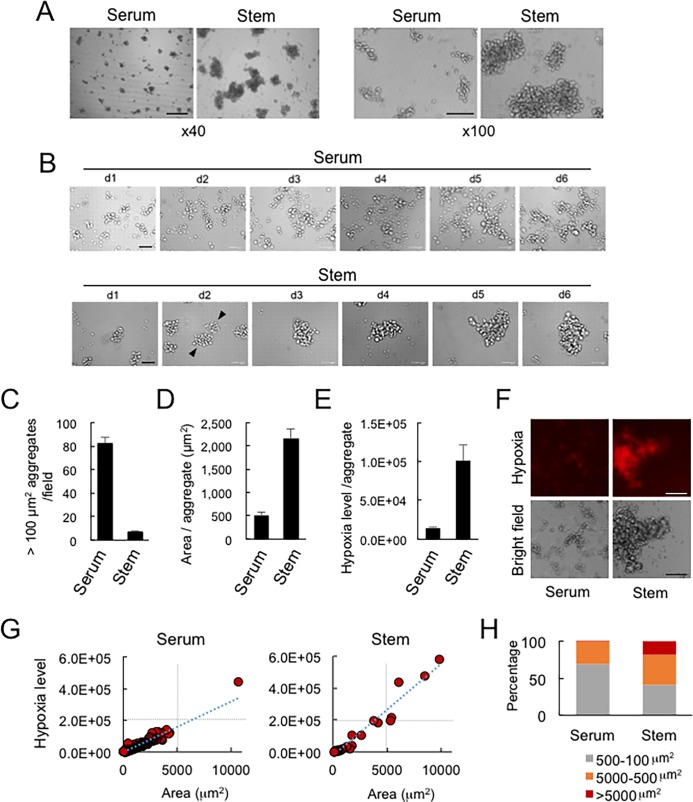
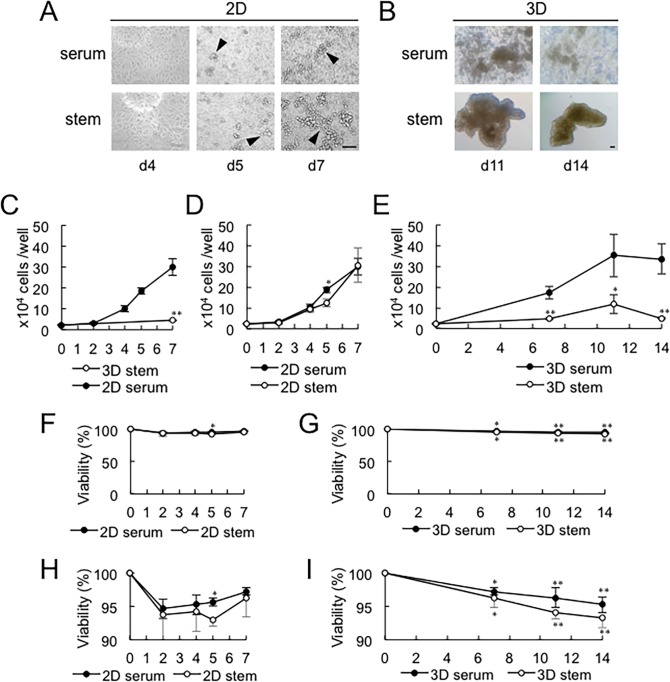
Ability to form cellular aggregations such as tumorspheres and spheroids have been used as a morphological marker of malignant cancer cells and in particular cancer stem cells (CSC). However, the common definition of the types of cellular aggregation formed by cancer cells has not been available. We examined morphologies of 67 cell lines cultured on three dimensional morphology enhancing NanoCulture Plates (NCP) and classified the types of cellular aggregates that form. Among the 67 cell lines, 49 cell lines formed spheres or spheroids, 8 cell lines formed grape-like aggregation (GLA), 8 cell lines formed other types of aggregation, and 3 cell lines formed monolayer sheets. Seven GLA-forming cell lines were derived from adenocarcinoma among the 8 lines. A neuroendocrine adenocarcinoma cell line PC-3 formed asymmetric GLA with ductal structures on the NCPs and rapidly growing asymmetric tumors that metastasized to lymph nodes in immunocompromised mice. In contrast, another adenocarcinoma cell line DU-145 formed spheroids in vitro and spheroid-like tumors in vivo that did not metastasize to lymph nodes until day 50 after transplantation. Culture in the 3D nanoenvironment and in a defined stem cell medium enabled the neuroendocrine adenocarcinoma cells to form slowly growing large organoids that expressed multiple stem cell markers, neuroendocrine markers, intercellular adhesion molecules, and oncogenes in vitro. In contrast, the more commonly used 2D serum-contained environment reduced intercellular adhesion and induced mesenchymal transition and promoted rapid growth of the cells. In addition, the 3D stemness nanoenvironment promoted secretion of HSP90 and EpCAM-exosomes, a marker of CSC phenotype, from the neuroendocrine organoids. These findings indicate that the NCP-based 3D environment enables cells to form stem cell tumoroids with multipotency and model more accurately the in vivo tumor status at the levels of morphology and gene expression.


Conflict of interest statement

Competing Interests: Ryosuke Iinuma, Manabu Itoh and Kazuya Arai are employed by JSR Life Sciences Coorporation. There are no patents, products in development or marketed products to declare. This does not alter our adherence to all the PLOS ONE policies on sharing data and materials, as detailed online in the guide for authors.

Figures

Fig 1
Fig 1. Representative morphologies of the various types of cell aggregates formed on NanoCulture Plates (NCP).
(A) Grape-like aggregation (GLA) of PC-3 cells formed in F12K medium with 10% FBS. (B) Spheroids of CAL 27 cells formed in DMEM with 10% FBS. (C) Cell aggregation of FaDu cells formed in DMEM with 10% FBS. (D) Epithelial monolayer sheet of RT7 cells formed in KGM2 medium. Scale bar, 100 μm. The morphological classification of 67 cell lines on NCP is shown in Table 1.
Fig 2
Fig 2. The difference in tumorigenicity and metastatic potentials between spheroid-forming and GLA-forming adenocarcinomas.
(A) In vivo tumorigenicity of PC-3 (GLA-forming), DU-145 (spheroid-forming), LNCaP (other type of aggregates), and RWPE-1 (monolayer sheet-forming) cells. Each cell line was pre-cultured under the 2D conditions and transplanted to SCID mice. The PC-3 cells were pre-cultured in 2D or 3D conditions. The photographs on day 27, 52, 72, and 79 after the transplantation were shown. Arrows indicate tumors. Margins of tumors were traced with dotted lines. Tumor sizes were shown in Table 2. (B) Tumor growth of each cell line. (C) Primary tumor and lymph node metastasis of the PC-3 cells on day 52. The primary tumor was shown with dotted line. Metastasis was seen in the regional lymph nodes of the prostate (white arrows) and an axilla lymph node (arrow).
Fig 3
Fig 3. Quantification of size and hypoxia level of GLAs in serum-stimulated and stemness-induction conditions.
(A) The grape-like aggregation (GLA) of PC-3 cells in the serum-contained or stem-cell medium. Scale bar, 100 μm. (B) Time-lapse imaging of maturation of GLA of PC-3 cells. Fusion of small GLAs was seen to form larger GLAs in the stem cell induction condition. Arrowheads indicate pre-fusion aggregates. Scale bar, 100 μm. (C) Numbers of cellular aggregations per field. A cellular aggregation sized more than 100 μm2 diameters was defined as a GLA. A well of a 96-well plate was sectionized to 9 fields, and the area of 1 field is 2,632 μm2. n = 4. Biological replicates. (D) The average area of GLAs. n = 3. Biological replicates. (E) Hypoxia levels of the aggregations. n = 3. Biological replicates. (F) Hypoxia imaging by using a hypoxia probe. Scale bars, 200 μm. (G) Scatter plot analysis of areas and hypoxic levels of the GLAs. GLAs in random 4 fields were analyzed. Approximate straight lines were shown. Left, n = 1338. Right, n = 27. (H) The difference in sizes of GLAs. Gray, 100 to 500 μm2; orange, 500 to 5000 μm2. Red, > 5000 μm2.
Fig 4
Fig 4. Enlargement of GLA due to slow cell proliferation and inter-gla fusion in the 3d stemness-inducing nanoenvironment.
(A) Representative photomicrographs of PC-3 cells after reaching confluent. Cells were cultured in the 2D condition. Cellular morphologies at day 4, 5, and 7 were shown. Arrowheads indicate GLA on the 2D monolayer cells. Scale bar, 100 μm. (B) Representative photomicrographs of PC-3 cells in the 3D culture condition. Cellular morphologies at day 11 and 14 were shown. Scale bar, 100 μm. (C) Growth curves of PC-3 cells cultured in 2D serum-contained and 3D stem cell medium conditions. Cells were cultured in a 96-well plate. **P < 0.01 (2D serum vs 3D stem), n = 3. (D) Growth curves of PC-3 cells cultured in 2D serum-contained and 2D stem cell medium conditions. *P < 0.05 (2D stem vs 2D serum), n = 3. (E) Growth curves of PC-3 cells cultured in 3D serum-contained and 3D stem cell medium conditions. *P < 0.05 (3D stem vs 3D serum), n = 3. **P < 0.01 (3D stem vs 3D serum), n = 3. (F-H) Viabilities of PC-3 cells cultured in 2D or 3D conditions in serum-contained or stem cell media. Same data with different vertical axis values were shown between F and H and between G and I. (F, H) P < 0.05 (2D serum vs 2D stem), n = 3. (G, I) *P < 0.05 (vs day 0), n = 3. **P < 0.01 (vs day 0), n = 3. 3D serum d0 vs d7, P = 0.028. 3D serum d0 vs d11, P = 0.0052. 3D serum d0 vs d14, P = 0.0012. 3D stem d0 vs d7, P = 0.0138. 3D stem d0 vs d11, P = 0.0007. 3D stem d0 vs d14, P = 0.0004.
Fig 5
Fig 5. Gene expression switching of Epithelial-Splicing Regulatory Proteins (ESRPs), CD44 variant, and stem cell markers depending on cell culture nanoEnvironments.
(A) Representative morphologies of PC-3 cells cultured in the 4 different conditions. Cells were cultured in 10% serum-containing F12K medium or mTeSR1 stem-cell medium on 2D plates or 3D NCPs. Arrows indicate projections of cells. Scale bars, 100 μm. (B) Schematic structures of CD44 gene, CD44 variant 8–10 (CD44v8-10) and CD44 standard (CD44s). Blue and gray rectangles represent standard exons (exon 1 to 10) and variant exons (V1 to V10), respectively. The red primer pair is for all variants and the CD44s. The green primer pair is for CD44v containing exon V9. The blue primer pair is for CD44s only. (C) Agarose gel electrophoresis analysis of RT-PCR amplicons of CD44v and CD44s. An arrow indicates CD44v8-10 amplicon. An arrowhead indicates CD44s amplicon. M1k, a 1 kbp DNA ladder marker. M100, a 100 bp DNA ladder marker. ACTB, β-actin mRNA as an internal control. (D) qRT-PCR analysis of stem-cell-related and epithelial-splicing regulatory genes. The mRNA expression levels of CD44s, CD44v, ECAD/CDH1, ESRP1, ESRP2, and CD133 were examined. Relative mRNA expression levels versus those of GAPDH are shown. n = 3. (E) Flow cytometry analysis of CD44v9. PC-3 cells were cultured in serum-containing medium and passage number 1, 7, and 13 were examined by flow cytometry. An anti-prostate-specific antigen (PSA) antibody was used as a negative control. Serum promoted differentiation of the cells and reduced stemness.
Fig 6
Fig 6. Gene expression profiling of CSC markers in the 2D and 3D culture nanoenvironments.
PC-3 cells were cultured in four different conditions designated: 2D, serum; 2D, stem; 3D, serum; 3D, stem conditions. (A) Clustergram and dendrogram analysis of stem-cell-related genes. (B) Building block analysis of stem-cell-related genes. (C) Scatter plot analysis. Genes were plotted according to the mRNA expression levels in the 3D stem-cell condition (ordinate) and the 2D serum-containing condition (abscissa). #These gene’s average threshold cycle is relatively high (> 30) in any sample, and is reasonably low in the other sample (< 30).
Fig 7
Fig 7. Gene expression of stem cell markers in the 3D GLAs and differentiation markers in the 2D cells.
(A) Fold expression changes in the large GLA-forming 3D stem-cell condition vs 2D serum-containing condition. (B) Fold expression changes in the small-GLA-forming 3D serum-containing condition vs 2D serum-containing condition. (C) Fold expression changes in the 2D stem-cell condition vs 2D serum-containing condition. Orange bars, gene expression changed more than 8-fold. Blue bars, gene expression changed more than 2-fold and less than 8-fold. #These gene’s average threshold cycle is relatively high (> 30) in any sample, and is reasonably low in the other sample (< 30).
Fig 8
Fig 8. Secretion of EpCAM-exosomes, CD9-exosomes, and HSP90 by 3D aggregates of multipotent neuroendocrine adenocarcinoma cells.
(A) TEM of exosomes secreted by PC-3 cells. Scale bar, 100 nm. (B, C) Cellular (B) and exosome (C) protein concentrations per million cells. PC-3 cells were pre-cultured the four different conditions and further cultured in serum-free medium for 2 days to prepare exosome and non-exosome fractions. (D) Western blotting analysis of EpCAM, CD9, and HSP90α in cellular, exosome, and non-exosome fractions. Each protein sample per 3 x 10⁵ cells was used for analysis of exosome, per 1 x 10⁵ cells was used for analysis of non-exosome fraction, and per 2 x 10⁴ cells was used for analysis of cell lysates. (E) Western blotting analysis of E-cadherin and Vimentin. Each protein sample per 2 x 10⁴ cells was loaded. β-actin and GAPDH were analyzed as loading controls. (F) Immunocytochemistry of EpCAM, vimentin, chromogranin A (CHGA), synaptophysin (SYP), and CD34 in the 2D culture conditions. Scale bar, 50 μm. Percentages of positive cells were shown in Table 4. Photomicrographs taken at a 20 x magnification is shown in S1 Fig.
Fig 9
Fig 9. Subcellular localization of EpCAM, E-cadherin, and vimentin in the CSC-like 3D aggregates of neuroendocrine adenocarcinoma cells.
PC-3 cells were cultured in 3D stem (A, C, E) and in 3D serum (B, D, F) conditions. Immunohistochemistry was carried out of EpCAM (A, B), E-cadherin (C, D) and Vimentin (E, F). DNA was stained with DAPI. Scale bars, 100 μm. Arrow indicates acinus-like structures. Arrowhead indicates duct-like structures.

Similar articles

Cited by

References

    1. Welsh M, Mangravite L, Medina MW, Tantisira K, Zhang W, Huang RS, et al. Pharmacogenomic discovery using cell-based models. Pharmacol Rev. 2009;61(4):413–29. doi: 10.1124/pr.109.001461 - DOI - PMC - PubMed
    1. Mizushima H, Wang X, Miyamoto S, Mekada E. Integrin signal masks growth-promotion activity of HB-EGF in monolayer cell cultures. J Cell Sci. 2009;122(Pt 23):4277–86. doi: 10.1242/jcs.054551 - DOI - PubMed
    1. Baker BM, Chen CS. Deconstructing the third dimension: how 3D culture microenvironments alter cellular cues. J Cell Sci. 2012;125(Pt 13):3015–24. doi: 10.1242/jcs.079509 - DOI - PMC - PubMed
    1. Kumar M, Allison DF, Baranova NN, Wamsley JJ, Katz AJ, Bekiranov S, et al. NF-kappaB regulates mesenchymal transition for the induction of non-small cell lung cancer initiating cells. PLoS One. 2013;8(7):e68597 doi: 10.1371/journal.pone.0068597 - DOI - PMC - PubMed
    1. Arai K, Eguchi T, Rahman MM, Sakamoto R, Masuda N, Nakatsura T, et al. A Novel High-Throughput 3D Screening System for EMT Inhibitors: A Pilot Screening Discovered the EMT Inhibitory Activity of CDK2 Inhibitor SU9516. PLoS One. 2016;11(9):e0162394 doi: 10.1371/journal.pone.0162394 - DOI - PMC - PubMed

Publication types

Substances

LinkOut - more resources