. 2018 Mar 1;141(3):673-687.
doi: 10.1093/brain/awx375.

HDAC6 is a therapeutic target in mutant GARS-induced Charcot-Marie-Tooth disease

Affiliations

HDAC6 is a therapeutic target in mutant GARS-induced Charcot-Marie-Tooth disease

Veronick Benoy et al. Brain. .

Abstract

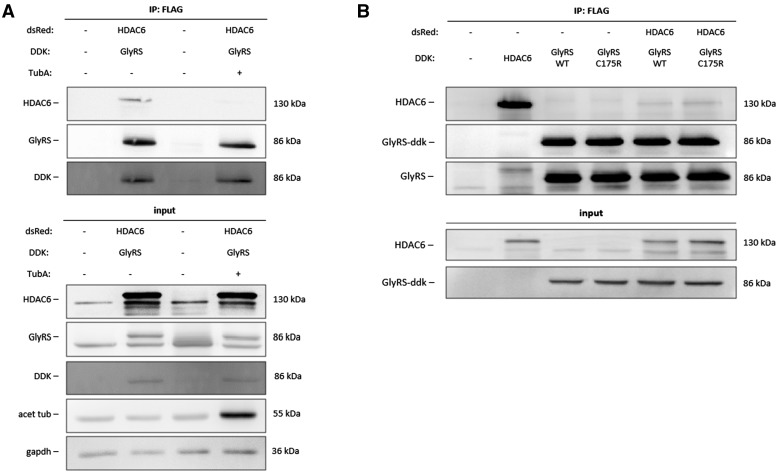
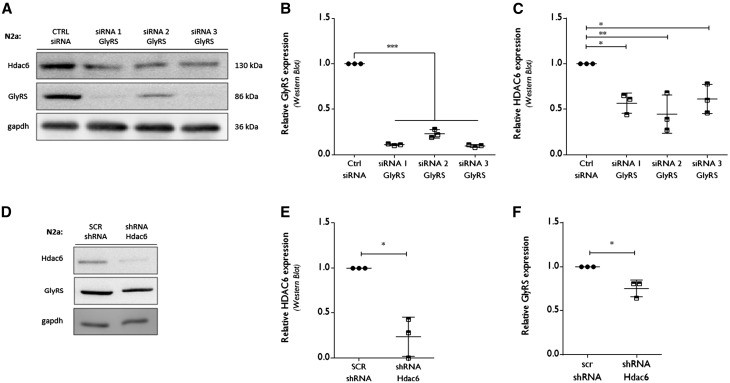
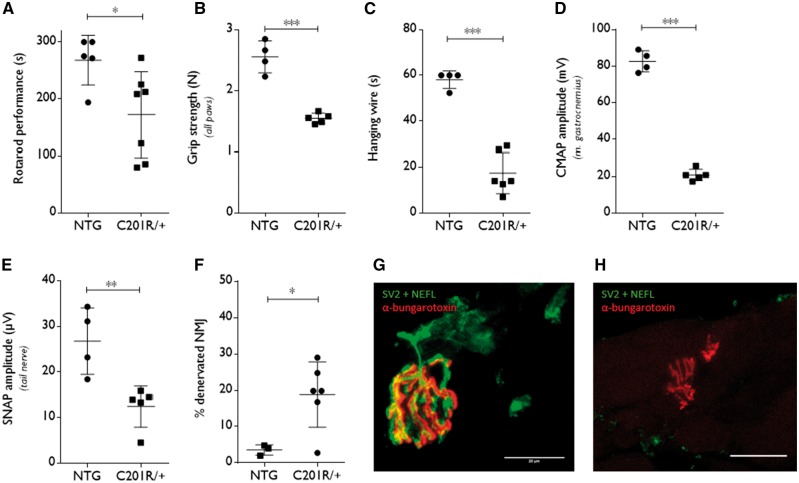
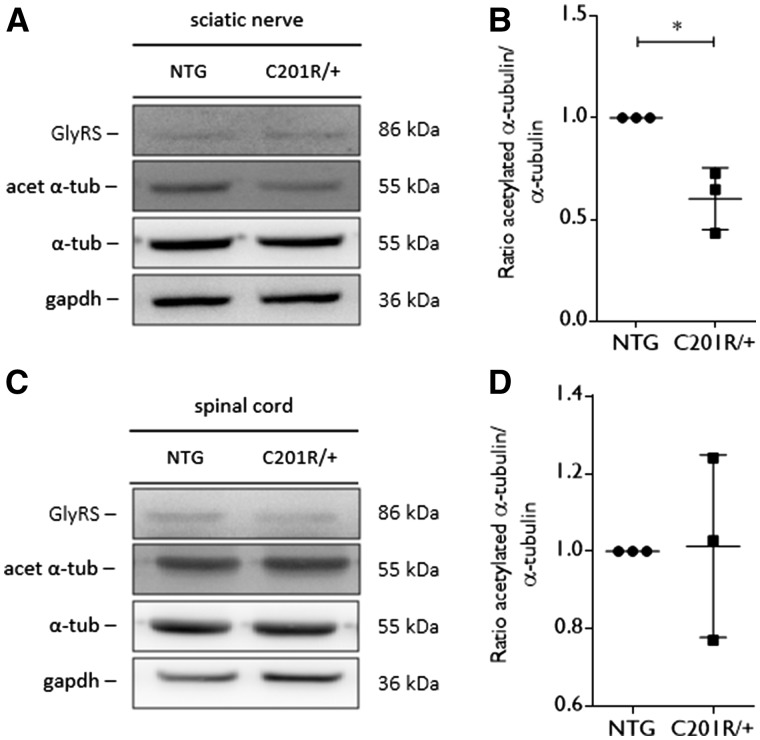
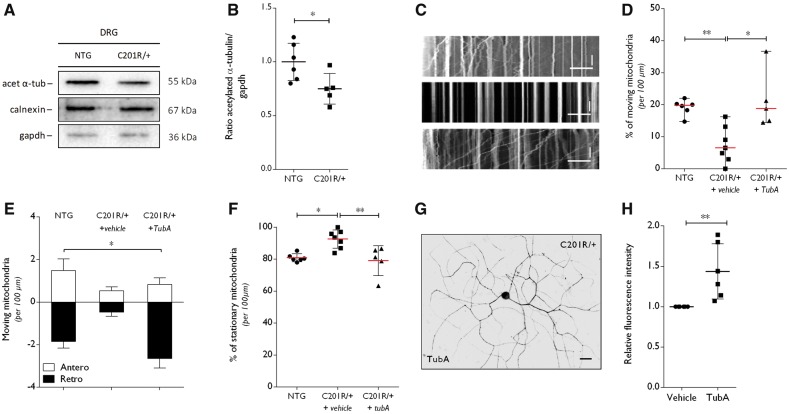
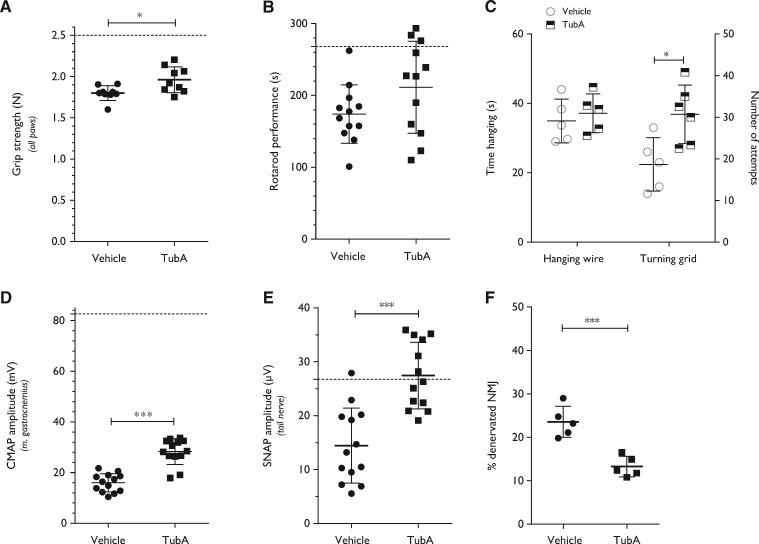
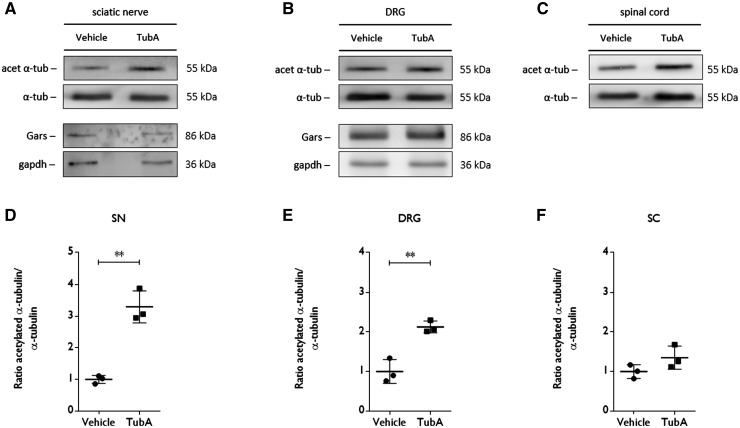
Peripheral nerve axons require a well-organized axonal microtubule network for efficient transport to ensure the constant crosstalk between soma and synapse. Mutations in more than 80 different genes cause Charcot-Marie-Tooth disease, which is the most common inherited disorder affecting peripheral nerves. This genetic heterogeneity has hampered the development of therapeutics for Charcot-Marie-Tooth disease. The aim of this study was to explore whether histone deacetylase 6 (HDAC6) can serve as a therapeutic target focusing on the mutant glycyl-tRNA synthetase (GlyRS/GARS)-induced peripheral neuropathy. Peripheral nerves and dorsal root ganglia from the C201R mutant Gars mouse model showed reduced acetylated α-tubulin levels. In primary dorsal root ganglion neurons, mutant GlyRS affected neurite length and disrupted normal mitochondrial transport. We demonstrated that GlyRS co-immunoprecipitated with HDAC6 and that this interaction was blocked by tubastatin A, a selective inhibitor of the deacetylating function of HDAC6. Moreover, HDAC6 inhibition restored mitochondrial axonal transport in mutant GlyRS-expressing neurons. Systemic delivery of a specific HDAC6 inhibitor increased α-tubulin acetylation in peripheral nerves and partially restored nerve conduction and motor behaviour in mutant Gars mice. Our study demonstrates that α-tubulin deacetylation and disrupted axonal transport may represent a common pathogenic mechanism underlying Charcot-Marie-Tooth disease and it broadens the therapeutic potential of selective HDAC6 inhibition to other genetic forms of axonal Charcot-Marie-Tooth disease.


Figures

Figure 1
Figure 1
HDAC6 co-immunoprecipitates with GlyRS. (A) N2a cells were transiently transfected with either pCMV-DDK-tagged human cDNA encoding GlyRS or pCMV-dsRed-tagged human cDNA encoding HDAC6. Co-immunoprecipitation was performed using agarose beads conjugated to an antibody directed against the DDK peptide. Transfected N2a cells were pre-treated with 1 µM tubastatin A (TubA) or vehicle (DMSO). Western blot analysis was performed to check for equal protein expression and co-immunoprecipitation of HDAC6. (B) N2a cells were transiently transfected with either pCMV-DDK-tagged human cDNA encoding wild-type or C175R mutant GlyRS or pCMV-dsRed-tagged human cDNA encoding HDAC6. Co-immunoprecipitation was performed using agarose beads conjugated to an antibody directed against the DDK peptide. Transfected N2a cells were pretreated with 1 µM tubastatin A or vehicle (DMSO). Western blot analysis was performed to check for equal protein expression and co-immunoprecipitation of HDAC6.
Figure 2
Figure 2
RNA interference-mediated knock down of GlyRS affects HDAC6 expression. (A) N2a cells were transfected with siRNA molecules directed against Gars (GlyRS) mRNA or a control siRNA. At 72 h post transfection, cells were collected to check protein expression levels by western blot analysis. GAPDH was used as a loading control. (B) Using densitometry, the GlyRS protein expression level was determined, relative to GAPDH. All values were normalized to control siRNA samples within each experiment: control siRNA 1.00 ± 0.00, n = 3 versus siRNA 1 GlyRS 0.11 ± 0.01, n = 3 versus siRNA 2 GlyRS 0.23 ± 0.05, n = 3 versus siRNA 3 GlyRS 0.09 ± 0.02; one-way ANOVA, F(3,8) = 1.935, P < 0.0001. (C) The HDAC6 expression levels were analysed using densitometry, relative to the gapdh expression levels and normalized to control siRNA values: control siRNA 1.0 ± 0, n = 3 versus siRNA 1 GlyRS 0.57 ± 0.11, n = 3 and siRNA 2 GlyRS 0. 45 ± 0.21, n = 3 and siRNA 3 GlyRS 0.61 ± 0.16, n = 3; One-way ANOVA, F(3,8) = 8.327, P = 0.0076; Dunnett’s multiple comparisons test. (D) pCMV-dsRed plasmids containing either a scrambled shRNA or short hairpin RNA (shRNA) directed against Hdac6 mRNA were transfected in N2a cells. At 72 h post transfection, cells were collected to check protein expression levels by western blot analysis. (E) HDAC6 expression was checked by western blot analysis after 72 h shRNA-mediated knockdown. Densitometry was used to calculate HDAC6 expression levels, relative to GAPDH and all values were normalized to scrambled (SCR) shRNA samples: scrambled shRNA 1.00 ± 0.00, n = 3 versus shRNA Hdac6 0.24 ± 0.22, n = 3; one-sample t-test, t = 6.088, P = 0.0259. (F) The relative GlyRS expression levels were calculated using densitometry, relative to GAPDH levels and normalized to scrambled shRNA values: scrambled shRNA 1.0 ± 0.0, n = 3 versus shRNA Hdac6 0.75 ± 0.09, n = 3; one sample t-test, t = 4.353, P = 0.0489.
Figure 3
Figure 3
Motor and sensory deficits reminiscent of CMT2D are present in 1-year old GarsC201R/+ mice. (A) The motor performance of GarsC201R/+ mice and littermate controls (non-transgenic, NTG) was assessed by a rotarod test which accelerates from 4 to 40 rpm for 5 min: non-transgenic 268 ± 43.68 s, n = 5 mice versus GarsC201R/+ 172 ± 75.51 s, n = 7 mice; unpaired t-test t = 2.531, P = 0.0298. B. Grip strength was measured in all paws using a grid in combination with a dynamometer: non-transgenic 2.55 ± 0.26 N, n = 4 mice versus GarsC201R/+ 1.54 ± 0.08 N, n = 5 mice; unpaired t-test t = 8.211, P < 0.0001. (C) Mice were tested for the ability to hold on to a grid in the hanging wire test and the time spent hanging was measured with a maximum time limit of 60 s: non-transgenic 58.08 ± 3.84 s, n = 4 mice versus GarsC201R/+ 17.45 ± 8.96 s, n = 6 mice; unpaired t-test t = 8.436, P < 0.0001. (D) CMAP amplitudes were recorded in the gastrocnemius muscle: non-transgenic 82.68 ± 5.79 mV, n = 4 mice versus GarsC201R/+ 20.84 ± 3.14 mV, n = 5 mice; unpaired t-test t = 20.61, P < 0.0001. (E) SNAP amplitudes were measured in the tail nerve: non-transgenic 26.75 ± 7.263 µV, n = 4 mice versus GarsC201R/+ 12.42 ± 4.53 µV, n = 5 mice; unpaired t-test t = 3.645, P = 0.0082. (F) The innervation of neuromuscular junctions was evaluated by quantifying the percentage of neuromuscular junctions demonstrating overlap of neurofilament light, NEFL/synaptic vesicle glycoprotein 2A, SV2 and α-bungarotoxin staining: non-transgenic 3.57 ± 1.43%, n = 3 mice versus GarsC201R/+ 18.81 ± 8.98 %, n = 6 mice; unpaired t-test t = 2.826, P = 0.0255. (G and H) Innervated (G) and denervated (H) neuromuscular junctions (NMJs) in the gastrocnemius muscle were visualized by immunofluorescence (green: NEFL + SV2; red: α-bungarotoxin). Confocal images are represented. Scale bar = 20 µm. For colour blind corrected figure, see Supplementary Fig. 2F and G.
Figure 4
Figure 4
Acetylated α-tubulin levels are altered in peripheral nerve tissue from GarsC201R/+ mice. (A) Western blot analysis was used to determine the acetylation status of α-tubulin in tissue homogenates from GarsC201R/+ and littermate control mice (non-transgenic, NTG). An antibody directed against GlyRS was used to assess GlyRS expression levels. GAPDH expression levels were used as a control for equal sample loading. (B) The amount of acetylated α-tubulin compared to the total α-tubulin levels was quantified by densitometry and the values were normalized to the non-transgenic samples: non-transgenic 1.00 ± 0.00, n = 3 samples versus GarsC201R/+ 0.60 ± 0.15 ms, n = 3 samples; unpaired t-test: t = 4.518, P = 0.0107. (C) The level of acetylated α-tubulin was detected by western blot analysis in tissue homogenates from spinal cord from GarsC201R/+ and littermate control (non-transgenic) mice. GlyRS expression levels were checked and GAPDH was used as a loading control. (D) The ratio between acetylated α-tubulin and total α-tubulin was quantified by densitometry and values were normalized to non-transgenic samples. n = 3 mice.
Figure 5
Figure 5
Altered α-tubulin acetylation and disturbances in mitochondrial axonal transport in DRGs from GarsC201R/+ mice are rescued by selective HDAC6 inhibition. (A) Western blot analysis was used to determine the acetylation status of α-tubulin in DRG homogenates from GarsC201R/+ and littermate control mice (non-transgenic, NTG). GAPDH and calnexin were used as loading control. (B) Densitometry was used to quantify the ratio of acetylated α-tubulin to GAPDH levels. Values were normalized to non-transgenic samples. Non-transgenic 1.00 ± 0.17, n = 6 mice versus GarsC201R/+ 0.75 ± 0.14, n = 5 mice; unpaired t-test t = 2.574, P = 0.0300. (C) Representative kymographs from the analysis of mitochondrial movement in non-transgenic (top) and GarsC201R/+ (middle and bottom) DRG neurons. Stationary mitochondria are represented by vertical lines. Lines deflecting to the right or left are anterograde or retrograde moving mitochondria, respectively. Horizontal scale bar = 30 μm. Vertical scale bar = 80 s. DRG neurons were treated with vehicle or 1 µM tubastatin A (TubA). (D) Mitochondrial movement was quantified within one neurite per cell, relative to the total number of mitochondria per 100 µm. GarsC201R/+ DRG neurons were treated with vehicle or with 1 µm tubastatin A (TubA): non-transgenic 19.14 ± 2.48% moving mitochondria, n = 6 different DRG primary cultures versus GarsC201R/+ + vehicle 7.53 ± 5.69% moving mitochondria, n = 7 different DRG primary cultures versus GarsC201R/+ + tubastatin A 21.21 ± 9.07% moving mitochondria, n = 5 different DRG primary cultures; Kruskal-Wallis test, P = 0.0015. (E) Anterograde and retrograde moving mitochondria were quantified from the kymographs obtained from non-transgenic, vehicle-treated and tubastatin A-treated GarsC201R/+ DRG neurons: antero 0.95 ± 0.46 mitochondria, n = 3 versus retro −1.66 ± 1.10 mitochondria, n = 3 different DRG primary cultures; two-way ANOVA, treatment F(2,18) = 3.898, P = 0.0392, direction of transport F(1,18) = 81.20, P < 0.0001. (F) The number of stationary mitochondria in the neurites from non-transgenic or GarsC201R/+ DRG neurons was quantified relative to the total number of mitochondria, in the absence or presence of tubastatin A was assessed. Non-transgenic 80.87 ± 2.48% stationary mitochondria, n = 6 different DRG primary cultures versus GarsC201R/+ + vehicle 92.57 ± 5.75% stationary mitochondria, n = 7 different DRG primary cultures versus GarsC201R/+ + tubastatin A 79.09 ± 9.34, n = 5 different DRG primary cultures; one-way ANOVA, F(2,15) = 1.515, P = 0.0030. (G) The acetylation of α-tubulin was determined by immunocytochemistry in GarsC201R/+ DRG neuron cultures on tubastatin A treatment. (H) Quantification of the intensity of acetylated α-tubulin in neurites of DRG neuron cultures normalized to the fluorescence length: GarsC201R/++vehicle 1.00 ± 0.0, n = 6 different DRG primary cultures versus GarsC201R/+ + tubastatin A 1.44 ± 0.34, n = 6 cells from six different DRG primary cultures; Mann-Whitney test, P = 0.0022.
Figure 6
Figure 6
Treatment of GarsC201R/+ mice with a HDAC6 inhibitor improves motor behaviour and stimulates regeneration of motor and sensory nerves in 4-month-old mice. (A) After daily intraperitoneal injections during 40 consecutive days with tubastatin A (50 mg/kg), the grip strength in all paws of vehicle- versus tubastatin A-treated GarsC201R/+ mice was assessed: vehicle 1.80 ± 0.09 N, n = 9 mice versus tubastatin A 1.96 ± 0.16 N, n = 12 mice; unpaired t-test: t = 2.697, P = 0.0159. (B) The motor behaviour after treatment was measured by the accelerated rotarod test: vehicle 174 ± 40.47 s, n = 12 mice versus tubastatin A 211 ± 63.96 s, n = 12 mice; unpaired t-test: t = 1.706, P = 0.1021. (C) The time spent hanging (hanging wire) as well as the number of attempts to climb back on top of a grid (turning grid) was measured in vehicle versus tubastatin A-treated mice: turning grid test: vehicle 22.40 ± 7.70, n = 5 mice versus tubastatin A 36.83 ± 8.42, n = 5 mice; unpaired t-test t = 2.939, P = 0.0165. (D) The CMAP amplitudes were measured in the sciatic nerve in vehicle and tubastatin A-treated mice: vehicle 15.98 ± 3.61 mV, n = 13 mice versus tubastatin A 28.28 ± 5.09 mV, n = 13 mice; unpaired t-test t = 7.110, P < 0.0001. (E) SNAP amplitudes were measured in the tail nerve in vehicle and tubastatin A-treated mice: vehicle 14.45 ± 6.98 µV, n = 13 mice versus tubastatin A 27.45 ± 6.18 µV, n = 13 mice; unpaired t-test t = 5.027, P < 0.0001. (F) Quantification of the percentage of innervated neuromuscular junctions (NMJs) in the gastrocnemius muscle after treatment: vehicle 23.57 ± 3.58%, n = 5 mice (one muscle per mouse) versus tubastatin A 13.27 ± 2.38 %, n = 5 mice (one muscle per mouse); unpaired t-test t = 5.366, P = 0.0007.
Figure 7
Figure 7
Tubastatin A treatment increases the acetylation of α-tubulin in sciatic nerve and DRG homogenates from GarsC201R/+ mice. (A and D) The levels of acetylated of α-tubulin and Gars expression in sciatic nerve homogenates was determined by western blot. Densitometry was used to assess the ratio of acetylation α-tubulin to total α-tubulin levels in sample from vehicle and tubastatin A-treated mice. All values were normalized to samples from vehicle treated mice: vehicle 1.00 ± 0.18, n = 3 mice versus tubastatin A 1.35 ± 0.29, n = 3 mice; unpaired t-test t = 7.636, P = 0.0016. (B and E) The acetylation status of α-tubulin and Gars expression in DRGs from vehicle- and tubastatin A-treated mice was determined using western blot. The ratio between the acetylation of α-tubulin and total α-tubulin levels was quantified by densitometry. All values were normalized to samples from vehicle-treated mice: vehicle 1.00 ± 0.30, n = 3 mice versus tubastatin A 2.13 ± 0.15, n = 3 mice; unpaired t-test t = 5.799, P = 0.0044. (C and F) Spinal cord samples were collected from vehicle- and tubastatin A-treated mice to assess the acetylation status of α-tubulin. Densitometry was used to quantify the ratio between acetylated and total α-tubulin levels. All values were normalized to samples from vehicle-treated mice: vehicle 1.00 ± 0.18, n = 3 mice versus tubastatin A 1.35 ± 0.29, n = 3 mice; unpaired t-test t = 1.8, P = 0.1463.

References

    1. Achilli F, Bros-Facer V, Williams HP, Banks GT, AlQatari M, Chia R, et al.An ENU-induced mutation in mouse glycyl-tRNA synthetase (GARS) causes peripheral sensory and motor phenotypes creating a model of Charcot-Marie-Tooth type 2D peripheral neuropathy. Dis Model Mech 2009; 2: 359–73. - PMC - PubMed
    1. Almeida-Souza L, Asselbergh B, d’Ydewalle C, Moonens K, Goethals S, de Winter V, et al.Small heat-shock protein HSPB1 mutants stabilize microtubules in Charcot-Marie-Tooth Neuropathy. J Neurosci 2011; 31: 15320–8. - PMC - PubMed
    1. Antonellis A, Ellsworth RE, Sambuughin N, Puls I, Abel A, Lee-Lin SQ, et al.Glycyl tRNA synthetase mutations in Charcot-Marie-Tooth disease type 2D and distal spinal muscular atrophy type V. Am J Hum Genet 2003; 72: 1293–99. - PMC - PubMed
    1. Benoy V, Vanden Berghe P, Jarpe M, Van Damme P, Robberecht W, Van Den Bosch L. Development of improved HDAC6 inhibitors as pharmacological therapy for axonal Charcot–Marie–Tooth disease. Neurotherapeutics 2017; 14: 417–28. - PMC - PubMed
    1. Butler KV, Kalin J, Brochier C, Vistoli G, Langley B, Kozikowski AP. Rational design and simple chemistry yield a superior, neuroprotective HDAC6 inhibitor, tubastatin A. J Am Chem Soc 2010; 132: 10842–6. - PMC - PubMed

Publication types

MeSH terms