. 2018 Jun 15;34(12):2077-2086.
doi: 10.1093/bioinformatics/bty058.

scEpath: energy landscape-based inference of transition probabilities and cellular trajectories from single-cell transcriptomic data

Affiliations

scEpath: energy landscape-based inference of transition probabilities and cellular trajectories from single-cell transcriptomic data

Suoqin Jin et al. Bioinformatics. .

Abstract

Motivation: Single-cell RNA-sequencing (scRNA-seq) offers unprecedented resolution for studying cellular decision-making processes. Robust inference of cell state transition paths and probabilities is an important yet challenging step in the analysis of these data.

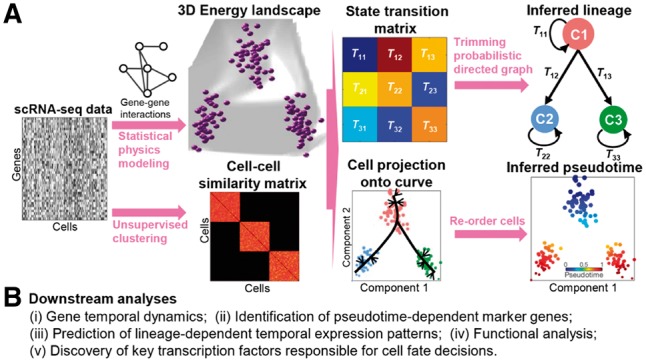
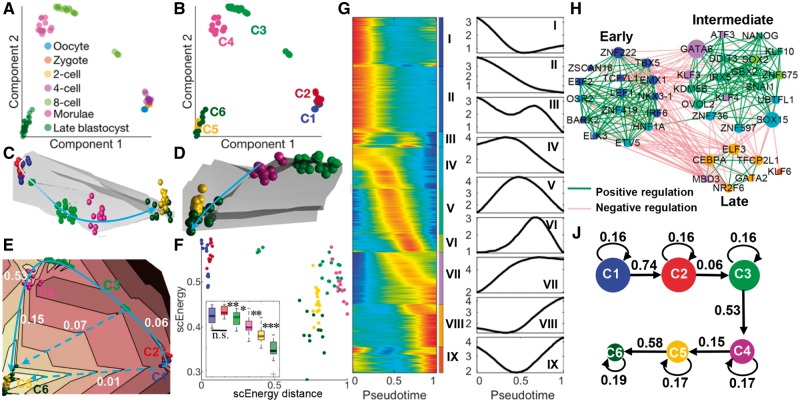
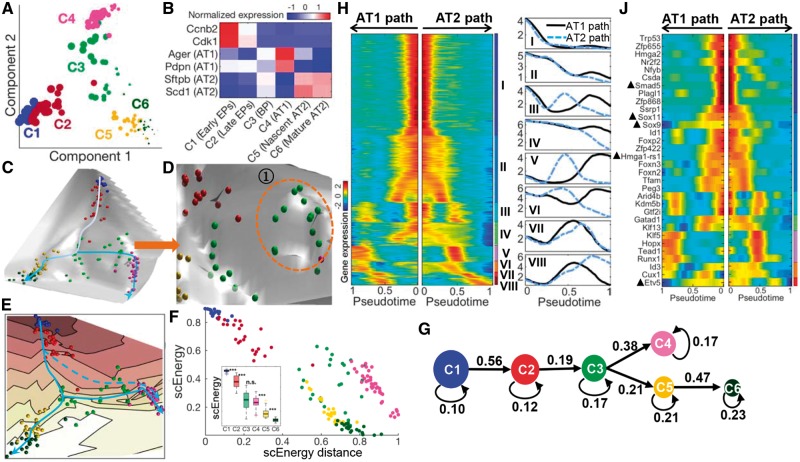
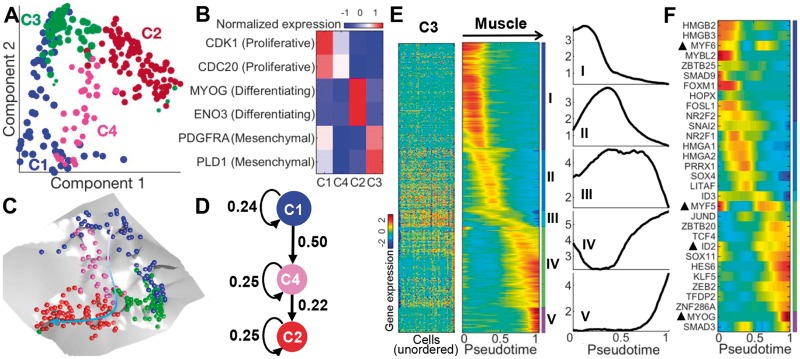
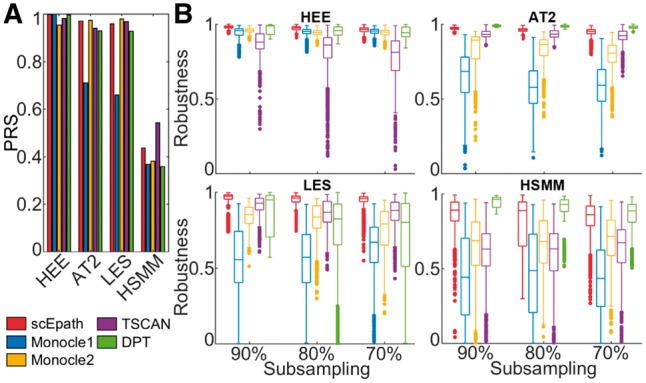
Results: Here we present scEpath, an algorithm that calculates energy landscapes and probabilistic directed graphs in order to reconstruct developmental trajectories. We quantify the energy landscape using 'single-cell energy' and distance-based measures, and find that the combination of these enables robust inference of the transition probabilities and lineage relationships between cell states. We also identify marker genes and gene expression patterns associated with cell state transitions. Our approach produces pseudotemporal orderings that are-in combination-more robust and accurate than current methods, and offers higher resolution dynamics of the cell state transitions, leading to new insight into key transition events during differentiation and development. Moreover, scEpath is robust to variation in the size of the input gene set, and is broadly unsupervised, requiring few parameters to be set by the user. Applications of scEpath led to the identification of a cell-cell communication network implicated in early human embryo development, and novel transcription factors important for myoblast differentiation. scEpath allows us to identify common and specific temporal dynamics and transcriptional factor programs along branched lineages, as well as the transition probabilities that control cell fates.

Availability and implementation: A MATLAB package of scEpath is available at https://github.com/sqjin/scEpath.

Supplementary information: Supplementary data are available at Bioinformatics online.


Figures

Fig. 1.
Fig. 1.
Overview of scEpath. (A) Given a gene expression matrix as input, scEpath first constructs a gene-gene interaction network, then learns a cell-cell similarity matrix using an unsupervised clustering method. Through a combination of statistical physics modeling of single cell energy and principal component analysis, gene expression patterns are then mapped on to energy landscapes, and a cell-state probabilistic transition matrix is inferred. Cell lineages are inferred by finding the maximum probability flow in the energy-directed probabilistic graph. The pseudotemporal ordering is constructed by projecting cells onto the principal curve embedded in the first two principal components and re-ordering the cells according to the position of projection points. (B) Downstream analyses that scEpath can perform to reveal additional molecular and functional mechanisms
Fig. 2.
Fig. 2.
scEpath reconstructed the developmental lineage and a high-resolution view of the transcriptional programs of human early embryos. (A) Cells visualized on the first two principal components, colored by their experimentally verified developmental stage. (B) Cells are colored according to unsupervised clustering. Cell size is proportional to scEnergy. (C) Overall energy landscape view in 3D. The developmental trajectories are shown by a curve: white indicates initial and blue indicates later stages. (D) Energy landscape view from another aspect, showing the transition path during late stages. (E) Contour plot of the energy landscape: solid blue line denotes actual transition path; dashed blue lines indicate other possible paths according to the locations of landscape ‘valleys’; numbers represent transition probabilities between two metacells. (F) Cells visualized on the scEnergy distance–scEnergy space (the distance was normalized). Inset: Comparison of energy distributions among the identified cell clusters. ‘***’: P-value < 0.001, ‘*’: 0.01 < P-value < 0.05, ‘n.s.’: not significant. (G) Left panel: ‘Rolling wave’ plot shows the normalized-smoothed expression pattern of pseudotime-dependent genes (n = 9545) clustered into nine groups (I–IX). Right panel: Average expression of the nine gene clusters along pseudotime. (H) Transcriptional factor co-expression network, showing putative activating (inhibiting) relationships according to significant positive (negative) correlations. The node size is proportional to their betweenness centrality reflecting the contribution to the communication between two subnetworks. (J) scEpath revealed a linear lineage in which transition probabilities are shown and node size corresponds to the energy (Color version of this figure is available at Bioinformatics online.)
Fig. 3.
Fig. 3.
scEpath reconstructed a branched lineage and their distinct transcriptional spectrum during lung epithelial specification. (A) Cells colored by unsupervised clustering. (B) Expression levels of known markers. (C) Overall energy landscape view in 3D. (D) Zoom in on to cells surrounding the branching point on the energy landscape; the oval indicates cells on a ‘flat’ part of the landscape, suggestive of a transition state. (E) Contour plot of the energy landscape. Dashed blue lines indicate another possible path. (F) Cells visualized on the scEnergy distance–scEnergy space. Inset: Comparison of energy distribution. (G) scEpath revealed a branched lineage path in which transition probabilities are shown. (H) Left panel: ‘Rolling wave’ plot of pseudotime-dependent genes (n = 2159) clustered into eight groups (I–VIII). Right panel: Average expressions of the gene clusters along pseudotime in AT1 and AT2 path respectively. (J) Smoothed expression pattern of the identified TFs. TFs indicated by a triangle have been previously described as relevant for lung epithelial specification (Color version of this figure is available at Bioinformatics online.)
Fig. 4.
Fig. 4.
scEpath revealed the myoblast differentiated trajectory and pinpointed the timing of key regulatory events of myoblast differentiation. (A) Cells colored by unsupervised clustering. (B) Expression levels of known markers in each cluster. (C) Overall energy landscape view in 3D. (D) Inferred lineage path in which transition probabilities are shown. C3 was not shown because only path C1-C4-C2 differentiated into muscle cells while C3 contained contaminating interstitial mesenchymal cells. (E) Comparison of expression patterns of pseudotime-dependent genes (n = 1116; clustered into five groups: I–V) between cluster C3 (left; cells are randomly ordered) and muscle path (middle; cells are ordered according to pseudotime). Right panel: Average expressions of the five gene clusters along pseudotime in muscle path. (F) Smoothed expression pattern of the important TFs delineated by scEpath (Color version of this figure is available at Bioinformatics online.)
Fig. 5.
Fig. 5.
Comparison of scEpath with existing algorithms for pseudotime inference. (A) Comparison of the accuracy of pseudotemporal ordering, measured by Pseudotime Reconstruction Score (PRS). (B) Comparison of robustness (by PRS) of pseudotemporal ordering under repeated subsampling of the cells from each dataset

References

    1. Babtie A.C. et al. (2017) Learning regulatory models for cell development from single cell transcriptomic data. Curr. Opin. Syst. Biol., 5, 72–81.
    1. Banerji C.R. et al. (2013) Cellular network entropy as the energy potential in Waddington's differentiation landscape. Sci. Rep., 3, 3039. - PMC - PubMed
    1. Braude P. et al. (1988) Human gene expression first occurs between the four- and eight-cell stages of preimplantation development. Nature, 332, 459–461. - PubMed
    1. Buckingham M., Rigby P.W.J. (2014) Gene regulatory networks and transcriptional mechanisms that control myogenesis. Dev. Cell, 28, 225–238. - PubMed
    1. Campbell K.R., Yau C. (2016) Order under uncertainty: robust differential expression analysis using probabilistic models for pseudotime inference. PLoS Comput. Biol., 12, e1005212.. - PMC - PubMed

Publication types