Review
. 2018 Feb 6;11(2):243.
doi: 10.3390/ma11020243.

Hyperspectral-Enhanced Dark Field Microscopy for Single and Collective Nanoparticle Characterization in Biological Environments

Affiliations
Review

Hyperspectral-Enhanced Dark Field Microscopy for Single and Collective Nanoparticle Characterization in Biological Environments

Paula Zamora-Perez et al. Materials (Basel). .

Abstract

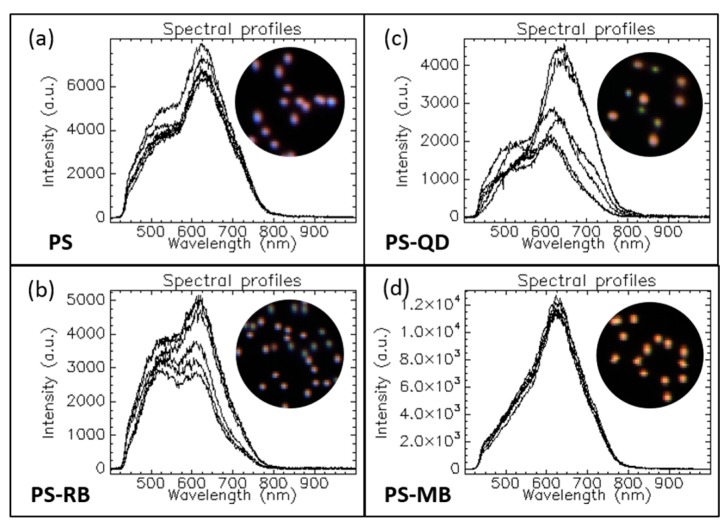
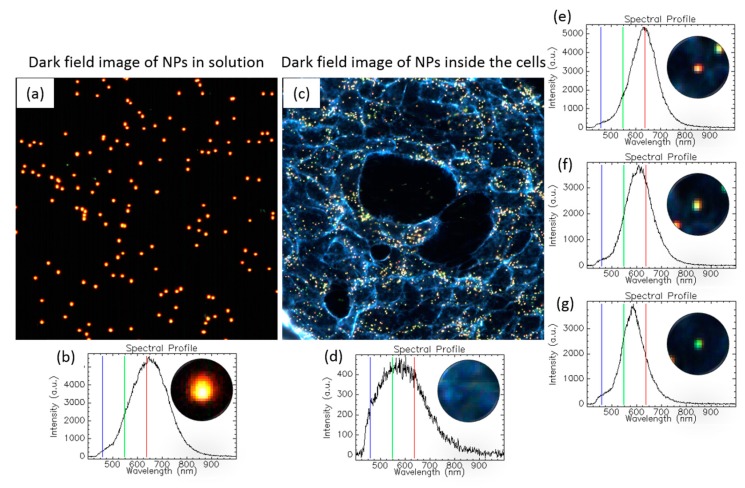
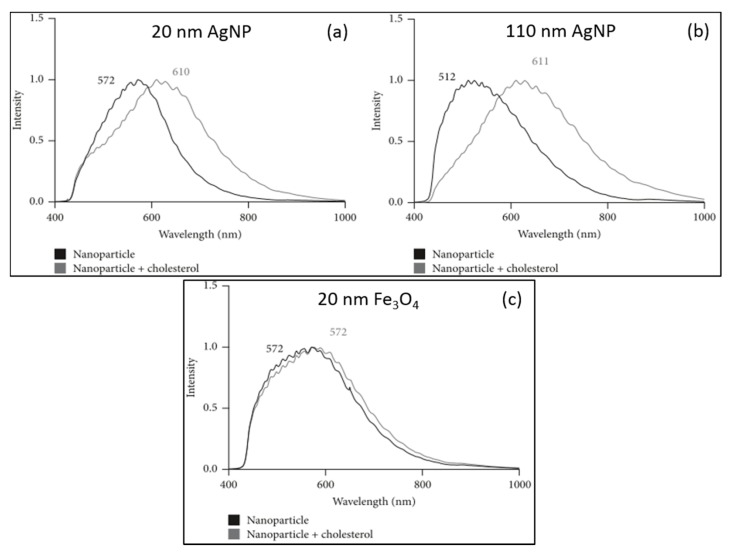
We review how the hyperspectral dark field analysis gives us quantitative insights into the manner that different nanoscale materials interact with their environment and how this relationship is directly expressed in an optical readout. We engage classification tools to identify dominant spectral signatures within a scene or to qualitatively characterize nanoparticles individually or in populations based on their composition and morphology. Moreover, we follow up the morphological evolution of nanoparticles over time and in different biological environments to better understand and establish a link between the observed nanoparticles' changes and cellular behaviors.

Keywords: colloidal stability; correlating physicochemical properties with biological responses; enhanced dark field imaging; hyperspectral analysis of nanoparticles evolution; living organisms; protein corona; scattering; single-particle tracking.


Conflict of interest statement

The authors declare no conflict of interest.

Figures

Figure 1
Figure 1
Generalized diagram of the Hyperspectral-Enhanced Dark Field Microscopy (HEDFM) system. Schematic illustration of the experimental setup based on dark field optics coupled with the spectrograph (left), and on the acquisition of the hyperspectral data cube for the analysis (right). Each pixel in the field of view provides complete spectral information in the optical window ranging from 400 to 1000 nm [8]. This system was acquired from CytoViva, Inc. (Auburn, AL, USA).
Figure 2
Figure 2
Workflow description of the data analysis and mapping. The spectral library can be generated either manually by individual selection of the acquired spectral profiles or through automated processes using software tools. The endmembers of the spectral library are tracked into unknown data cubes. This allows identifying the nanomaterials within biological matrixes. As a negative control for identification, cells unexposed to nanoparticles are mapped with the same spectral library [8].
Figure 3
Figure 3
Six spectral profiles showing optical differences among randomly selected PS NPs encapsulating different cargos. The insets correspond to dark field images of the NPs. (a) Bare PS NPs; (b) PS loaded with rhodamine (RB); (c) PS loaded with quantum dots (QD); (d) PS loaded with methylene blue (MB). The results were obtained using a CytoViva® with an Olympus UPlan FLN 60X 1.25 N.A. oil objective, a tungsten–halogen lamp as the illumination source, and a Pixelfly hyperspectral camera based on pushbroom line scanning.
Figure 4
Figure 4
Spectral responses of AuCuS NPs at different pH values [8]. Mean spectral profiles of the particles in neutral (orange line) and acidic (brown line) pH conditions. The insets correspond to the dark field images of the AuCuS NPs. CytoViva setup and ENVI software (Version 4.8) were used for the hypercube acquisition and analysis.
Figure 5
Figure 5
Influence of the solvents’ ionic strength and composition. (a) Spectral changes correlated with the agglomeration state of the AuNSs; (b) prominent spectral change in GM resulting from the formation of the so-called protein corona around the surface of the PM–AuNPs. AuNSs and PM–AuNPs were synthesized in our lab following synthesis methods published elsewhere [13,14]. CytoViva setup and ENVI 4.8 software were used for the hypercube acquisition and analysis.
Figure 6
Figure 6
Temporal tracking AuCuS NPs spectral changes induced by the solvent’s viscosity. HEDFM tracked the scattering profiles of NPs dispersed in water (non-viscous medium) and cell GM (viscous medium) over time. The plots represent the mean spectral profiles of different regions of interest (ROIs) containing the spectra of particles with the same pixel size. The number of pixels associated with one particle forms its pixel size. We sorted the particle populations by pixel size at different time points, i.e., t = 0 and t = 1, corresponding to the time of immediate addition of the solvent and the time after 2–3 months of storage, respectively in GM (a) and (b); and water (c) and (d). In the SI (Figure S5), the evolution of the NPs after 8 months in GM is also shown [8].
Figure 7
Figure 7
Spectral behavior of Au nanospheres (100 nm) inside and outside a cell. (a) Dark field image of the NPs in solution; (b) single spectral profile from one particle randomly selected; (c) dark field image of cells exposed to the NPs; (d) spectral signature of the cytoplasmic membrane; (eg) particles showing different scattering behaviors in the intracellular milieu. All the plots show the RGB bars in which the dark field images are based. The hyperspectral images were acquired with the CytoViva setup and processed with ENVI 4.8 software.
Figure 8
Figure 8
Impact of cholesterol on the optical properties of silver and iron oxide NPs (a) a 38 nm redshift is visible upon interaction of the 20 nm AgNP with cholesterol ; (b) a 99 nm redshift is visible, resulting from cholesterol interaction with the of 110 nm AgNP; (c) only spectral broadening can be observed for the 20 nm IONPs maintaining the spectral maximum at 572 nm [20].
Figure 9
Figure 9
Mapping of hybrid nanostructures in human breast cancer cells to determine the optimal particle concentration for photothermal therapy. (a) Dark field image of the NPs; (b) spectral library endmembers; (ce) dark field image of control cells and cells exposed to 10 and 20 mg/L NP concentrations; (fh) hyperspectral imaging of the spectral library demonstrating the presence of the particles in the cells (false-colored image) [21].
Figure 10
Figure 10
Determination of the agglomeration state of gold and silver NPs in blood. (a,b) AuNP spectral characterization at different agglomeration states; (c,d) spectral signatures of AuNPs in blood after 5 min and 18 h of exposure; (e,f) spectral responses of the AgNP upon agglomeration; (g,h) AgNPs in blood and their corresponding spectral profiles after 5 min and 18 h of exposure [13].

References

    1. Verebes G.S., Melchiorre M., Garcia-Leis A., Ferreri C., Marzetti C., Torreggiani A. Hyperspectral enhanced dark field microscopy for imaging blood cells. J. Biophotonics. 2013;6:960–967. doi: 10.1002/jbio.201300067. - DOI - PubMed
    1. Xiao L., Yeung E.S. Optical Imaging of individual plasmonic nanoparticles in biological samples. Annu. Rev. Anal. Chem. 2014;7:89–111. doi: 10.1146/annurev-anchem-071213-020125. - DOI - PubMed
    1. Fairbairn N., Christofidou A., Kanaras A.G., Newman T.A., Muskens O.L. Hyperspectral darkfield microscopy of single hollow gold nanoparticles for biomedical applications. Phys. Chem. Chem. Phys. 2013;15:4163–4168. doi: 10.1039/C2CP43162A. - DOI - PubMed
    1. Hu H., Ma C., Liu Z. Plasmonic dark field microscopy. Appl. Phys. Lett. 2010;96:113107. doi: 10.1063/1.3367729. - DOI
    1. Gao L., Smith R.T. Optical hyperspectral imaging in microscopy and spectroscopy—A review of data acquisition. J. Biophotonics. 2015;8:441–456. doi: 10.1002/jbio.201400051. - DOI - PMC - PubMed

LinkOut - more resources