

Cutaneous neurofibromas in Neurofibromatosis type I: a quantitative natural history study
- PMID: 29415745
- PMCID: PMC5803843
- DOI: 10.1186/s13023-018-0772-z
Cutaneous neurofibromas in Neurofibromatosis type I: a quantitative natural history study
Abstract
Background: Neurofibromatosis type 1 (NF1) is a genetic disorder characterized by a predisposition to develop multiple benign tumors. A major feature of NF1 is the development of localized cutaneous neurofibromas. Cutaneous neurofibromas manifest in > 99% of adults with NF1 and are responsible for major negative effects on quality of life. Previous reports have correlated increased burden of cutaneous neurofibromas with age and pregnancy, but longitudinal data are not available to establish a quantitative natural history of these lesions. The purpose of this study is to conduct a prospective natural history study of 22 adults with NF1 over an 8-year period to quantify cutaneous neurofibroma number and size.
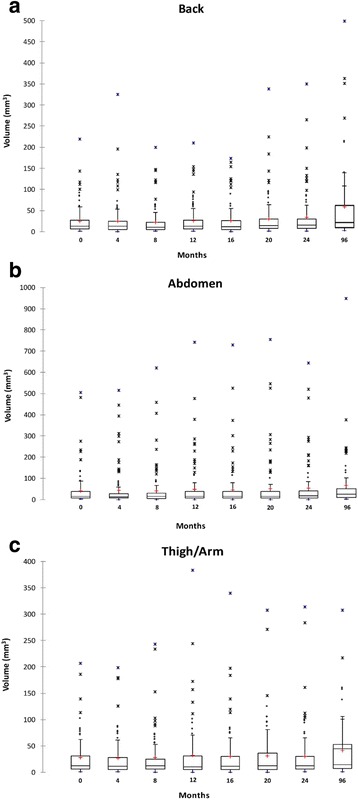
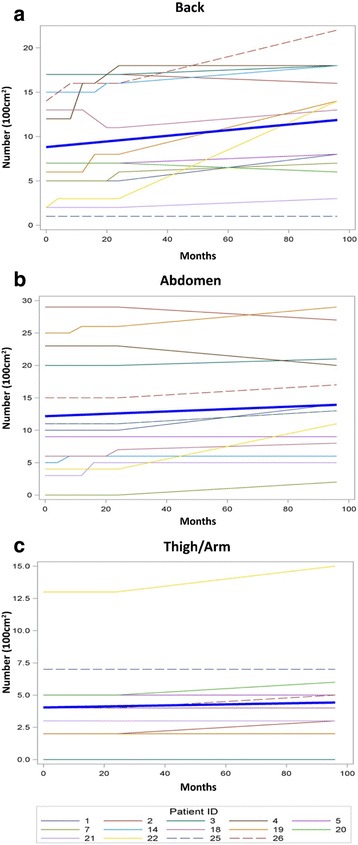
Results: The average monthly increase in volume for cutaneous neurofibromas was 0.37 mm3 in the back region (95% CI (0.23, 0.51), p < 0.0001), 0.28 mm3 in the abdominal region (95% CI (0.16, 0.41), p < 0.0001), and 0.21 mm3 in the arm/leg region (95% CI (0.08, 0.34), p = 0.0022). The number of cutaneous neurofibromas significantly increased in the back (slope = 0.032, p = 0.011) and abdominal (slope = 0.018, p = 0.026) regions, while the leg/arm regions retained a positive trend (slope = 0.004, p = 0.055).
Conclusions: The number and volume of cutaneous neurofibromas significantly increased over an 8-year timespan; however, the rate of increase is variable by individual and body region. These findings may provide insight into cutaneous neurofibroma development and benefit researchers considering clinical trials targeting cutaneous neurofibromas.
Keywords: Cutaneous neurofibromas; Natural history study; Neurofibromatosis type 1; Random effect modeling.
Conflict of interest statement
Ethics approval and consent to participate
This study was approved by the University of Alabama at Birmingham’s Institutional Review Board. All study participants provided written, informed consent.
Consent for publication
All study participants provided written, informed consent.
Competing interests
The authors declare that they have no competing interests.
Publisher’s Note
Springer Nature remains neutral with regard to jurisdictional claims in published maps and institutional affiliations.
Figures
References
Publication types
MeSH terms
Grants and funding
LinkOut - more resources
Full Text Sources
Other Literature Sources
Medical
Research Materials
Miscellaneous
