

End-expiratory occlusion maneuver to predict fluid responsiveness in the intensive care unit: an echocardiographic study
- PMID: 29415773
- PMCID: PMC5804059
- DOI: 10.1186/s13054-017-1938-0
End-expiratory occlusion maneuver to predict fluid responsiveness in the intensive care unit: an echocardiographic study
Abstract
Background: In mechanically ventilated patients, an increase in cardiac index during an end-expiratory-occlusion test predicts fluid responsiveness. To identify this rapid increase in cardiac index, continuous and instantaneous cardiac index monitoring is necessary, decreasing its feasibility at the bedside. Our study was designed to investigate whether changes in velocity time integral and in peak velocity obtained using transthoracic echocardiography during an end-expiratory-occlusion maneuver could predict fluid responsiveness.
Methods: This single-center, prospective study included 50 mechanically ventilated critically ill patients. Velocity time integral and peak velocity were assessed using transthoracic echocardiography before and at the end of a 12-sec end-expiratory-occlusion maneuver. A third set of measurements was performed after volume expansion (500 mL of saline 0.9% given over 15 minutes). Patients were considered as responders if cardiac output increased by 15% or more after volume expansion.
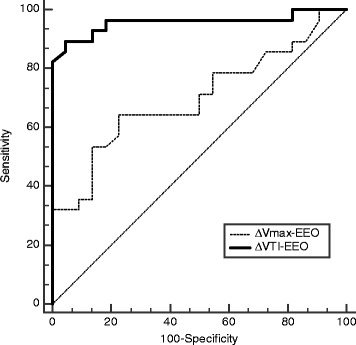
Results: Twenty-eight patients were responders. At baseline, heart rate, mean arterial pressure, cardiac output, velocity time integral and peak velocity were similar between responders and non-responders. End-expiratory-occlusion maneuver induced a significant increase in velocity time integral both in responders and non-responders, and a significant increase in peak velocity only in responders. A 9% increase in velocity time integral induced by the end-expiratory-occlusion maneuver predicted fluid responsiveness with sensitivity of 89% (95% CI 72% to 98%) and specificity of 95% (95% CI 77% to 100%). An 8.5% increase in peak velocity induced by the end-expiratory-occlusion maneuver predicted fluid responsiveness with sensitivity of 64% (95% CI 44% to 81%) and specificity of 77% (95% CI 55% to 92%). The area under the receiver operating curve generated for changes in velocity time integral was significantly higher than the one generated for changes in peak velocity (0.96 ± 0.03 versus 0.70 ± 0.07, respectively, P = 0.0004 for both). The gray zone ranged between 6 and 10% (20% of the patients) for changes in velocity time integral and between 1 and 13% (62% of the patients) for changes in peak velocity.
Conclusions: In mechanically ventilated and sedated patients in the neuro Intensive Care Unit, changes in velocity time integral during a 12-sec end-expiratory-occlusion maneuver were able to predict fluid responsiveness and perform better than changes in peak velocity.
Keywords: Echocardiography; End-expiratory occlusion; Fluid responsiveness; Heart-lung interactions; Volume expansion.
Conflict of interest statement
Ethics approval and consent to participate
The present study was approved by the Institutional Review Board (Comité de Protection des Personnes Sud-Ouest et Outre Mer III, Bordeaux, France number DC2016/14).
Consent for publication
The manuscript has been read and its submission approved by all co-authors. Patients were prospectively included after informed consent from the patient’s next of kin.
Competing interests
MB received honoraria from Edwards Lifesciences and Pulsion Medical System as a lecturer. The other authors have no competing interests.
Publisher’s note
Springer Nature remains neutral with regard to jurisdictional claims in published maps and institutional affiliations.
Figures


References
Publication types
MeSH terms
LinkOut - more resources
Full Text Sources
Other Literature Sources
Medical
