. 2018 Feb 8;3(3):e94040.
doi: 10.1172/jci.insight.94040.

Chronic cigarette smoke exposure induces systemic hypoxia that drives intestinal dysfunction

Affiliations

Chronic cigarette smoke exposure induces systemic hypoxia that drives intestinal dysfunction

Michael Fricker et al. JCI Insight. .

Abstract

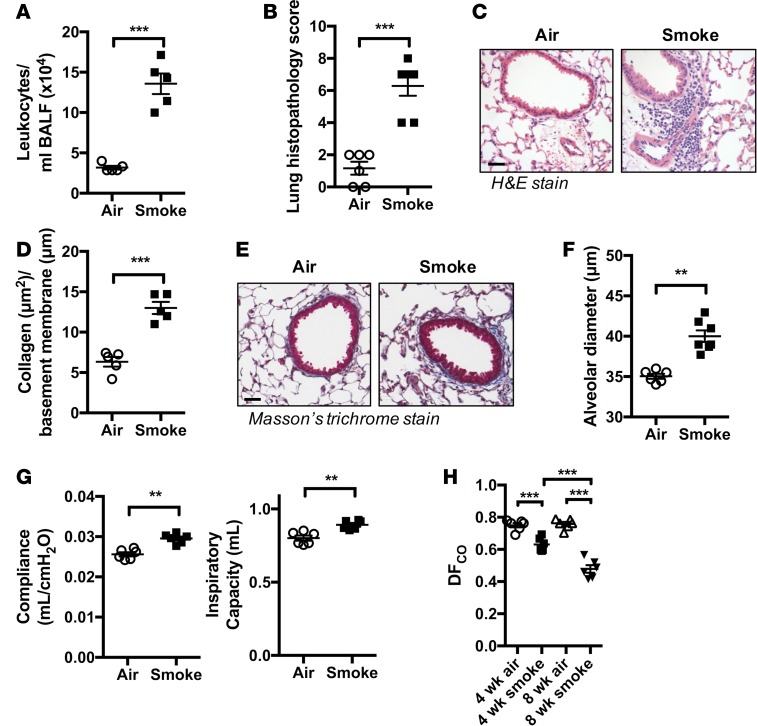
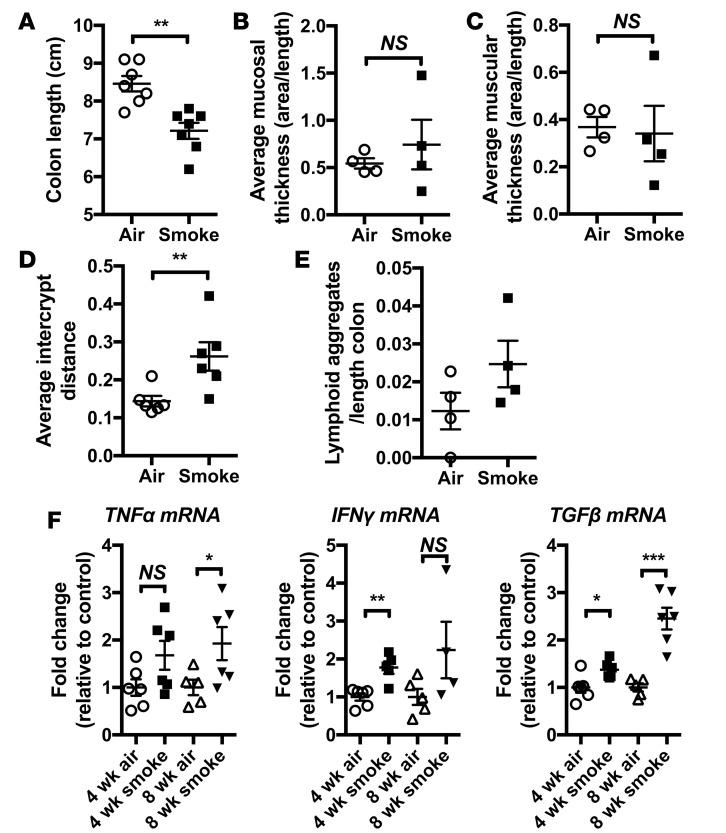
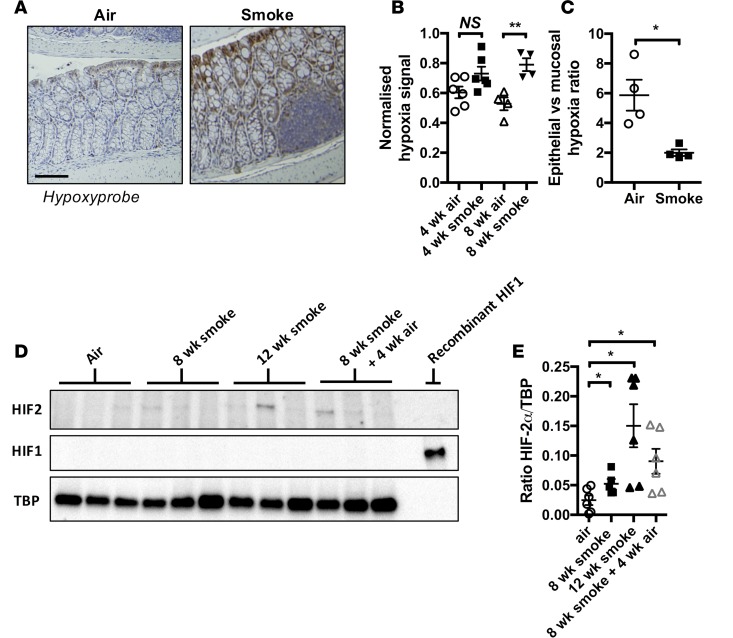
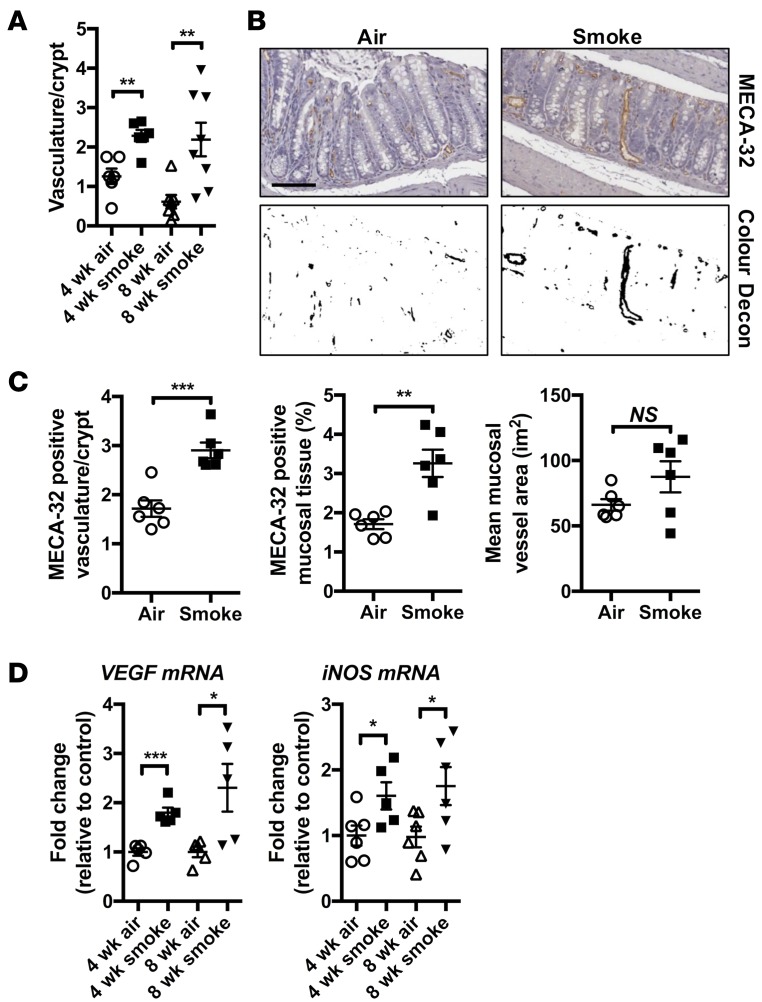
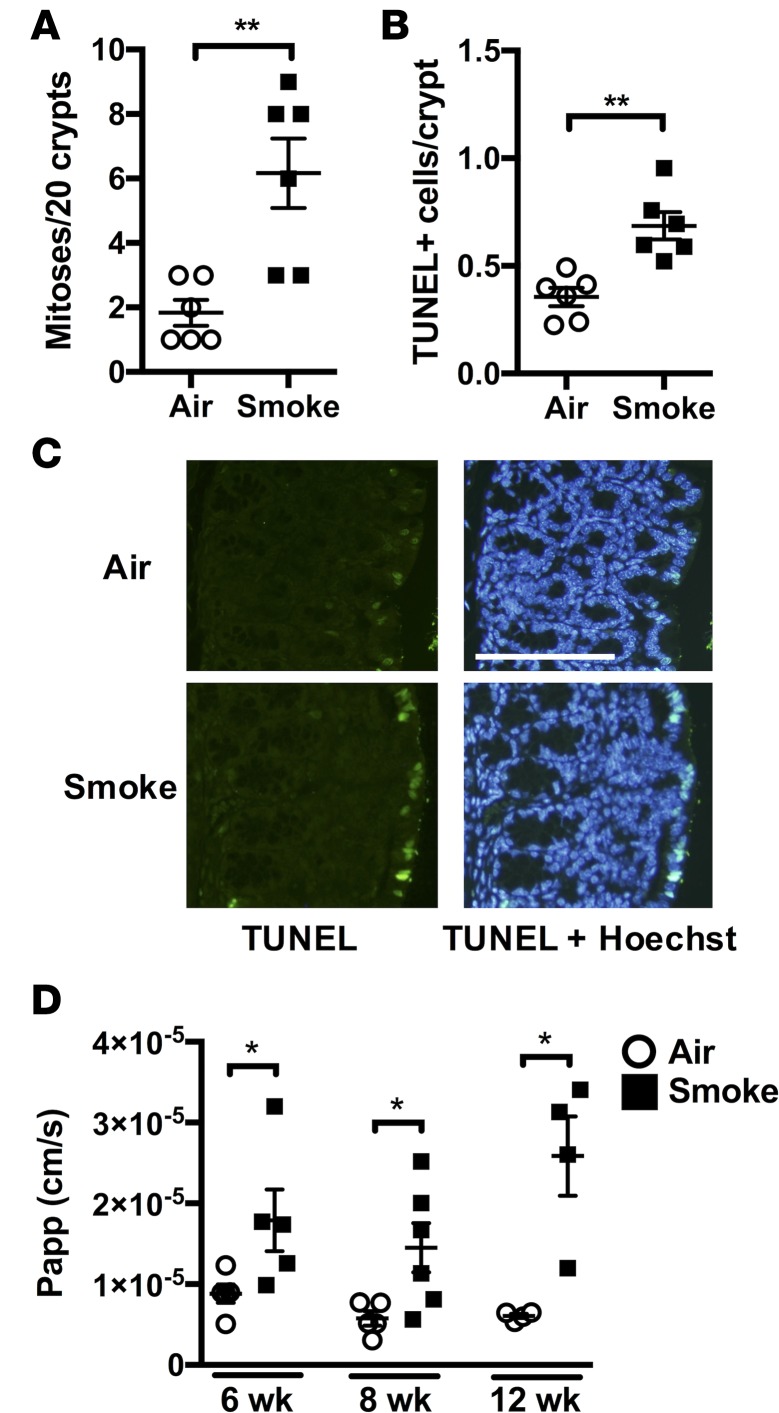
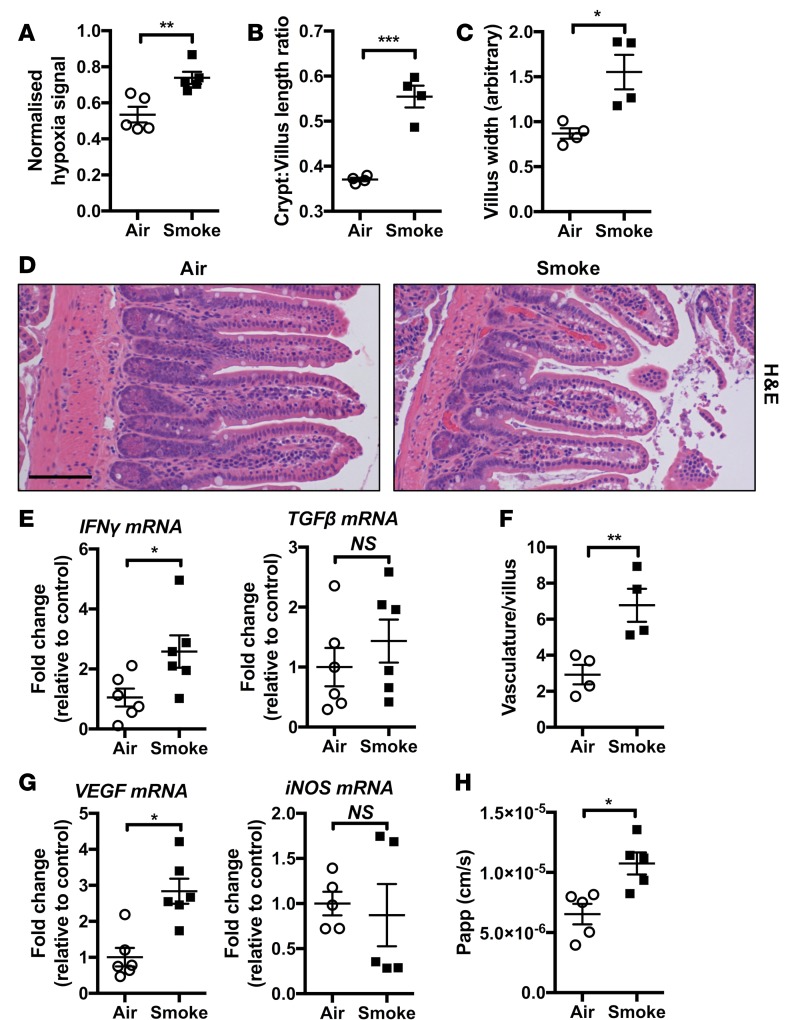
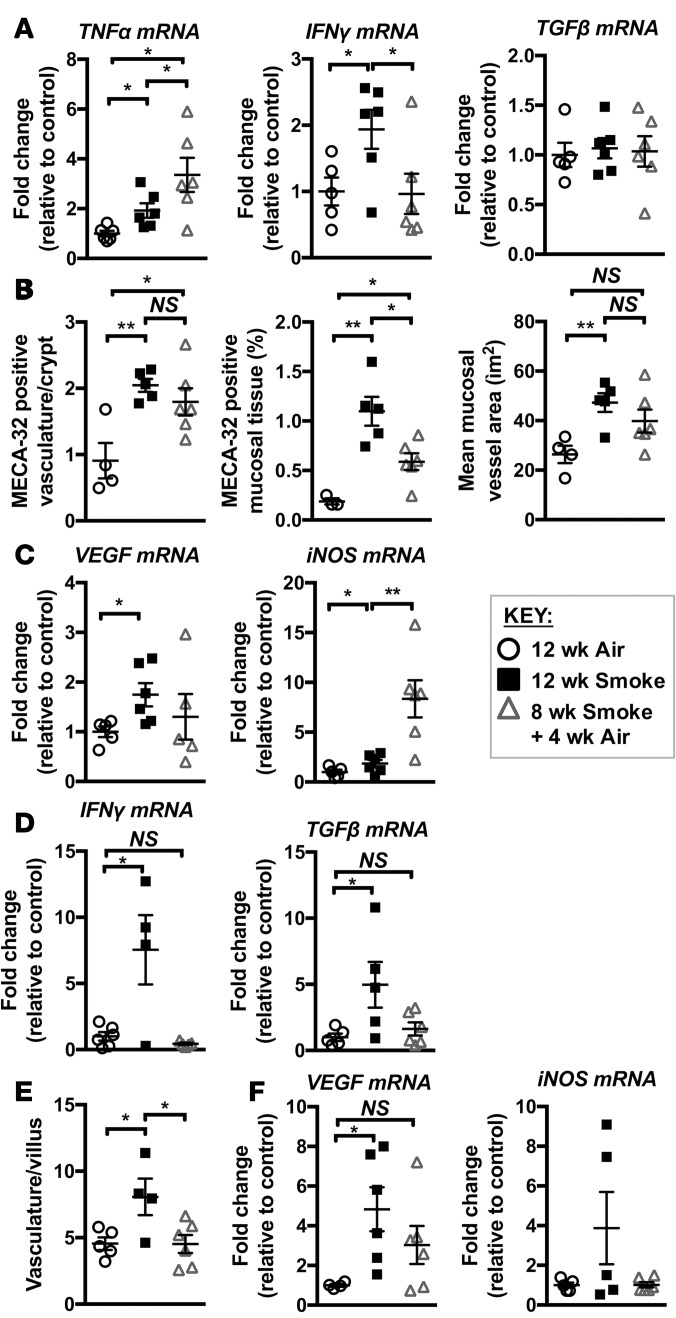
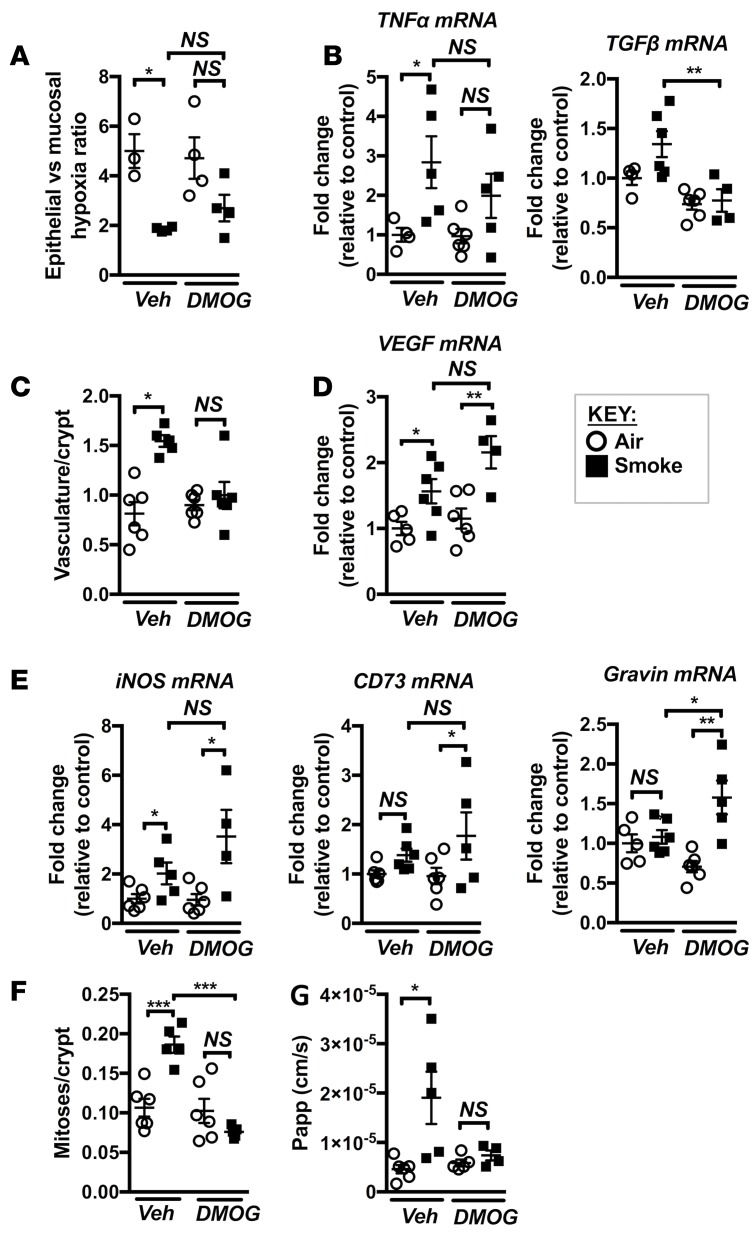
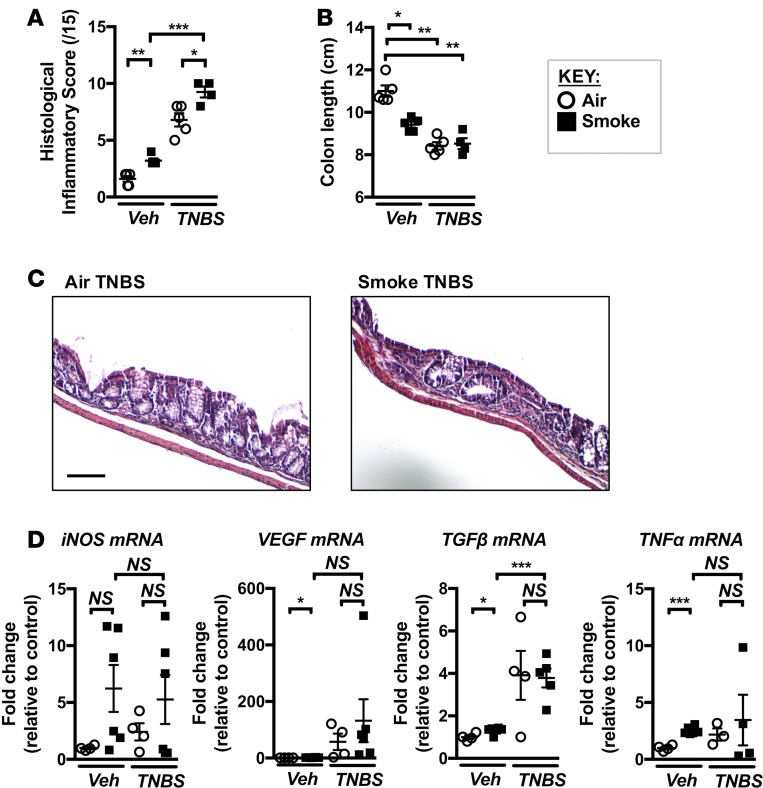
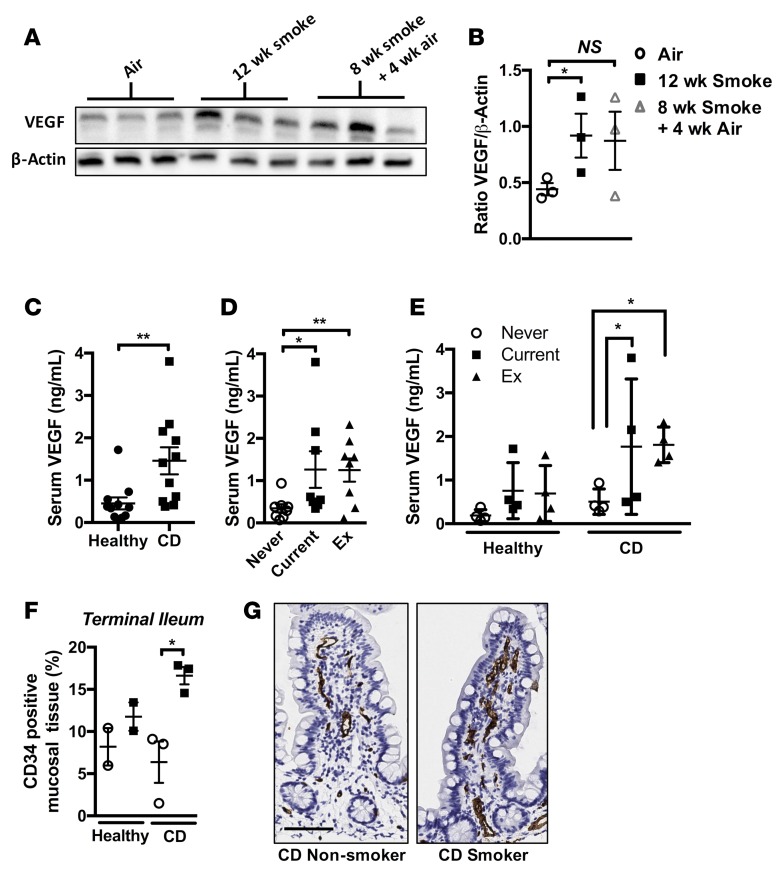
Crohn's disease (CD) is a chronic inflammatory disease of the gastrointestinal tract (GIT). Cigarette smoke (CS) exposure and chronic obstructive pulmonary disease (COPD) are risk factors for CD, although the mechanisms involved are poorly understood. We employed a mouse model of CS-induced experimental COPD and clinical studies to examine these mechanisms. Concurrent with the development of pulmonary pathology and impaired gas exchange, CS-exposed mice developed CD-associated pathology in the colon and ileum, including gut mucosal tissue hypoxia, HIF-2 stabilization, inflammation, increased microvasculature, epithelial cell turnover, and decreased intestinal barrier function. Subsequent smoking cessation reduced GIT pathology, particularly in the ileum. Dimethyloxaloylglycine, a pan-prolyl hydroxylase inhibitor, ameliorated CS-induced GIT pathology independently of pulmonary pathology. Prior smoke exposure exacerbated intestinal pathology in 2,4,6-trinitrobenzenesulfonic acid-induced (TNBS-induced) colitis. Circulating vascular endothelial growth factor, a marker of systemic hypoxia, correlated with CS exposure and CD in mice and humans. Increased mucosal vascularisation was evident in ileum biopsies from CD patients who smoke compared with nonsmokers, supporting our preclinical data. We provide strong evidence that chronic CS exposure and, for the first time to our knowledge, associated impaired gas exchange cause systemic and intestinal ischemia, driving angiogenesis and GIT epithelial barrier dysfunction, resulting in increased risk and severity of CD.

Keywords: COPD; Gastroenterology; Inflammatory bowel disease; Pulmonology; hypoxia.


Conflict of interest statement

Conflict of interest: The authors have declared that no conflict of interest exists.

Figures

Figure 1
Figure 1. Chronic CS exposure induces experimental COPD and impairs gas exchange in the lung.
Mice were exposed through the nose only to CS for 8 weeks to induce experimental COPD. (A) Bronchoalveolar lavage was performed and total airway leukocytes enumerated (n = 5). (B) Formalin fixed lung tissue was H&E stained and evaluated by histopathological scoring for the presence of inflammatory cells in peribronchial, perivascular, and alveolar regions (n = 6). (C) Representative H&E-stained tissue sections showing increased immune cell accumulation in peribronchial and perivascular areas of lungs of CS-exposed mice (scale bar: 50 μM). (D) Quantification of collagen deposition around small airways (perimeter ≤ 1,000 μM) indicating airway remodeling (n = 5). (E) Representative images of lung sections stained with Masson’s trichrome used for airway collagen quantification (scale bar: 50 μM). (F) CS-induced emphysema-like alveolar enlargement (n = 6-7). (G) Impaired lung function in terms of increased lung compliance and inspiratory capacity in experimental COPD (n = 6–7). (H) Mice were exposed to CS for 4 or 8 weeks to drive the development (4 weeks) and establishment (8 weeks) of experimental COPD, with reduced DFCO demonstrating impaired gas exchange in experimental COPD (n = 6). **P ≤ 0.01, ***P ≤ 0.001 air vs. smoke. Student’s unpaired 2-tailed t test used for comparisons of 2 groups, 1-way ANOVA with Tukey’s post-hoc was used whenever more than 2 experimental groups were compared.
Figure 2
Figure 2. Chronic CS exposure results in mild/subclinical pathology in the colon.
Mice were exposed to CS for 4 or 8 weeks. (A) Colons were excised, and length was measured and shown to be significantly shorter, demonstrating that remodeling has occurred in CS-exposed groups compared with normal air–exposed controls (n = 7). (B) Thickening of the mucosal layer or (C) the muscular layer underlying the mucosa, commonly observed in experimental colitis models, was not detected in CS-exposed groups (n = 4). (D) Gross crypt loss was not evident; however, restructuring of the crypt architecture was evident, with increased intercrypt distance following CS exposure (n = 6). (E) Increased numbers of lymphoid aggregates were observed in the mucosal layer of CS-exposed groups (n = 4). (F) mRNA levels of TNF-α, IFN-γ, and TGF-β were increased in the colons of CS exposed groups (n = 4–6), *P ≤ 0.05, **P ≤ 0.01, ***P ≤ 0.001. Student’s unpaired 2-tailed t test used for comparisons of 2 groups, 1-way ANOVA with Tukey’s post-hoc was used whenever more than 2 experimental groups were compared.
Figure 3
Figure 3. Chronic CS exposure triggers mucosal hypoxia and HIF-2 stabilization.
(A) Representative photomicrographs showing colon tissue hypoxia using hypoxyprobe staining in normal air– and CS-exposed colon tissue (scale bar: 100 μM). (B) Increased levels of hypoxia in the colonic mucosal layer normalized to total nuclear material in mucosa was detected in CS-exposed mice (n = 4–6). (C) The percentage of epithelial vs. mucosal area that stained positive for hypoxyprobe was determined, and the ratio of these 2 values was calculated, demonstrating a significant shift in hypoxyprobe staining to the mucosal layer of the colon in CS-exposed mice (n = 4). (D) HIF-2α but not HIF-1α was increased in whole colon tissue lysates from mice exposed to CS for 8 weeks, 12 weeks, or 8 weeks followed by 4 weeks of normal air exposure. (E) Densitometry shows increased HIF-2α protein relative to TATA-binding protein (TBP) (n = 6). *P ≤ 0.05, **P ≤ 0.01. Student’s unpaired 2-tailed t test used for comparisons of 2 groups, 1-way ANOVA with Tukey’s post-hoc was used whenever more than 2 experimental groups were compared.
Figure 4
Figure 4. Chronic CS exposure drives vascularization and VEGF expression.
Mice were exposed to CS for 4 or 8 weeks. (A) Increased mucosal vasculature was observed in the colons of CS-exposed groups after 4 and 8 weeks of CS exposure (n = 6–8). (B) Vasculature was visualized by IHC against the MECA-32 antigen (upper panels) and color deconvolution performed for quantitative analysis (lower panels) (scale bar: 100 μM). (C) The total number of discrete MECA-32–positive events increased with smoke exposure, as did the total proportion of mucosal tissue that was MECA-32 positive. There was a nonsignificant trend toward increased MECA-32 event area following smoke exposure (n = 6). (D) Increased vasculature was accompanied by elevated mRNA expression of proangiogenic factors VEGF and iNOS in whole colon tissue (n = 5–6). *P ≤ 0.05, **P ≤ 0.01, ***P ≤ 0.001. Student’s unpaired 2-tailed t test used for comparisons of 2 groups, 1-way ANOVA with Tukey’s post-hoc was used whenever more than 2 experimental groups were compared.
Figure 5
Figure 5. Chronic CS exposure induces altered cellular turnover and increased barrier permeability in the colon.
Mice were exposed to CS for 4, 8, or 12 weeks to drive development (4 weeks), establishment (8 weeks), and progression (12 weeks) of experimental COPD. (A) After 8 weeks, increased numbers of mitotic nuclei were observed in the colonic crypts of CS-exposed groups (n = 6). (B) TUNEL staining was performed to evaluate the extent of cell death, and increased numbers of TUNEL-positive cells were observed in the epithelial and mucosal layers of colons from CS-exposed groups (n = 6). (C) Representative fluorescent microscopy images of TUNEL-stained colon tissue. Notably, high numbers of TUNEL-positive cells were observed in the epithelial layer of the colons of CS-exposed groups (scale bar: 100 μM). (D) Increased colon barrier permeability was observed after 8 and 12 weeks of CS exposure (n = 4–6). *P ≤ 0.05, **P ≤ 0.01. Student’s unpaired 2-tailed t test used for comparisons of 2 groups, 1-way ANOVA with Tukey’s post-hoc was used whenever more than 2 experimental groups were compared.
Figure 6
Figure 6. Chronic CS–induced pathology extends to the ileum.
Mice were exposed to CS for 8 weeks to induce experimental COPD. (A) Increased total mucosal hypoxyprobe signal was observed in the mucosal layer of ileum of CS-exposed groups (n = 5). (B and C) Increased crypt/villus length ratio and villus width in ileum of CS-exposed mice (n = 4). (D) Representative photomicrographs of H&E-stained ileum from normal air– and CS-exposed mice showing altered villus architecture and increased vasculature in CS-exposed groups (scale bar: 100 μM). (E) qPCR analysis of inflammatory genes indicated that IFN-γ mRNA was increased in the ileum of CS-exposed groups, while TGF-β expression was unaltered (n = 6). (F) Vasculature and (G) VEGF but not iNOS mRNA were increased in the ileum of CS-exposed groups (n = 4–6). (H) Reduced epithelial barrier function of the ileum was observed in CS-exposed groups (n = 5). *P ≤ 0.05, **P ≤ 0.01, ***P ≤ 0.001. Student’s unpaired 2-tailed t test used for comparisons of 2 groups, 1-way ANOVA with Tukey’s post-hoc was used whenever more than 2 experimental groups were compared.
Figure 7
Figure 7. Smoking cessation alters pathology in the colon and ileum.
Mice were exposed to CS for 8 weeks to induce experimental COPD and then breathed normal air or continued CS exposure for 4 weeks. (A) qPCR assessment of mRNA showed that TNF-α expression increased, IFN-γ expression decreased, and TGF-β expression was unaltered in whole colons with smoking cessation (n = 5–6). (B) Smoking cessation resulted in nonsignificant decreases in the number of and volume of blood vessels, and a significant decrease in total MECA-32–positive mucosal area in colons compared with groups continually exposed to CS for 12 weeks (n = 4–6). (C) VEGF mRNA was increased in the colon following 12 weeks but not following smoking cessation, while iNOS was significantly increased in the colon following smoking cessation (n = 5–6). (D) mRNA levels of IFN-γ and TGF-β returned to baseline in the ileum following smoking cessation (n = 4–6). (E) Smoking cessation reversed the increased vascularization of ileal tissue (n = 4–6). (F) VEGF and iNOS expression were increased in the ileum of the 12-week CS-exposed group but not following smoking cessation (n = 4–6). *P ≤ 0.05, **P ≤ 0.01. Student’s unpaired 2-tailed t test used for comparisons of 2 groups, 1-way ANOVA with Tukey’s post-hoc was used whenever more than 2 experimental groups were compared.
Figure 8
Figure 8. DMOG treatment during chronic CS exposure prevents pathology in the colon.
Mice were exposed to CS for 8 weeks to induce experimental COPD and were treated with DMOG throughout. (A) Tissue hypoxia was measured using hypoxyprobe, and DMOG treatment partially prevented the mucosal hypoxic phenotype in colons of CS-exposed mice (n = 3–4). (B) DMOG treatment partly prevented increases in TNF-α and TGF-β mRNA expression in the colon (n = 4–6). (C) DMOG treatment inhibited increases in vasculature (n = 5–6). (D and E) DMOG treatment increased the mRNA expression of HIF target genes VEGF, iNOS, CD73, and gravin in the colons of CS-exposed groups (n = 4–6). (F) DMOG treatment completely inhibited increases in crypt mitoses (n = 5–6). (G) DMOG treatment completely inhibited the CS-induced increases in colon barrier permeability in CS-exposed mice (n = 4–6). *P ≤ 0.05, **P ≤ 0.01, ***P ≤ 0.001. Student’s unpaired 2-tailed t test used for comparisons of 2 groups, 1-way ANOVA with Tukey’s post-hoc was used whenever more than 2 experimental groups were compared.
Figure 9
Figure 9. Chronic CS exposure predisposes to TNBS-induced experimental colitis.
Mice were exposed to CS for 4 weeks, followed by the induction of colitis with TNBS. (A) Histological inflammatory scoring of H&E sections revealed that CS exposure resulted in a more severe colitic phenotype in response to TNBS, although (B) a further shortening of the colon did not occur (n = 4–5). (C) Representative micrographs of H&E-stained colon sections from normal air–exposed TNBS–treated and CS-exposed TNBS-treated mice. Colons from CS-exposed TNBS-treated mice displayed greater mucosal inflammatory infiltration and crypt dysplasia (scale bar: 100 μM). (D) Expression of iNOS, VEGF, TGF-β, and TNF-α in mice exposed to normal air or CS ± vehicle or TNBS (n = 3–6). *P ≤ 0.05, **P ≤ 0.01, ***P ≤ 0.001. Student’s unpaired 2-tailed t test used for comparisons of 2 groups, 1-way ANOVA with Tukey’s post-hoc was used whenever more than 2 experimental groups were compared.
Figure 10
Figure 10. Serum VEGF is elevated in mice chronically exposed to CS and in current and former smokers with CD.
(A) Mice were exposed to normal air or CS for 12 weeks or CS for 8 weeks followed by 4 weeks normal air. Immunoblotting of serum for VEGF. (B) Densitometric analysis of immunoblotting revealed elevated levels of serum VEGF in CS-exposed groups compared with normal air–exposed controls (n = 3). (C) Serum VEGF was elevated in the serum of human CD patients compared with healthy controls (n = 12). (D) Serum VEGF is elevated in smokers and ex-smokers compared with never-smokers (both healthy and CD) (n = 8). (E) Current or former smokers with CD show significantly elevated serum VEGF (n = 4). (F) Total CD34 signal as a percentage of tissue area in surface mucosal biopsies from the terminal ileum of healthy nonsmoker, healthy smoker, CD nonsmoker, and CD smoker patients was quantified (n = 2–3). (G) Representative photomicrographs of terminal ileum mucosal biopsies stained for CD34 (scale bar: 50 μM). *P ≤ 0.05, **P ≤ 0.01. Student’s unpaired 2-tailed t test used for comparisons of 2 groups, 1-way ANOVA with Tukey’s post-hoc was used whenever more than 2 experimental groups were compared.

References

    1. Lozano R, et al. Global and regional mortality from 235 causes of death for 20 age groups in 1990 and 2010: a systematic analysis for the Global Burden of Disease Study 2010. Lancet. 2012;380(9859):2095–2128. doi: 10.1016/S0140-6736(12)61728-0. - DOI - PMC - PubMed
    1. Fricker M, Deane A, Hansbro PM. Animal models of chronic obstructive pulmonary disease. Expert Opin Drug Discov. 2014;9(6):629–645. doi: 10.1517/17460441.2014.909805. - DOI - PubMed
    1. Chambers DC, Gellatly SL, Hugenholtz P, Hansbro PM. JTD special edition ‘Hot Topics in COPD’-The microbiome in COPD. J Thorac Dis. 2014;6(11):1525–1531. - PMC - PubMed
    1. Ventham NT, Kennedy NA, Nimmo ER, Satsangi J. Beyond gene discovery in inflammatory bowel disease: the emerging role of epigenetics. Gastroenterology. 2013;145(2):293–308. doi: 10.1053/j.gastro.2013.05.050. - DOI - PMC - PubMed
    1. Kaplan GG. The global burden of IBD: from 2015 to 2025. Nat Rev Gastroenterol Hepatol. 2015;12(12):720–727. doi: 10.1038/nrgastro.2015.150. - DOI - PubMed

Publication types

MeSH terms