. 2018 Feb 8;3(3):e93203.
doi: 10.1172/jci.insight.93203.

mTOR pathway activation drives lung cell senescence and emphysema

Affiliations

mTOR pathway activation drives lung cell senescence and emphysema

Amal Houssaini et al. JCI Insight. .

Abstract

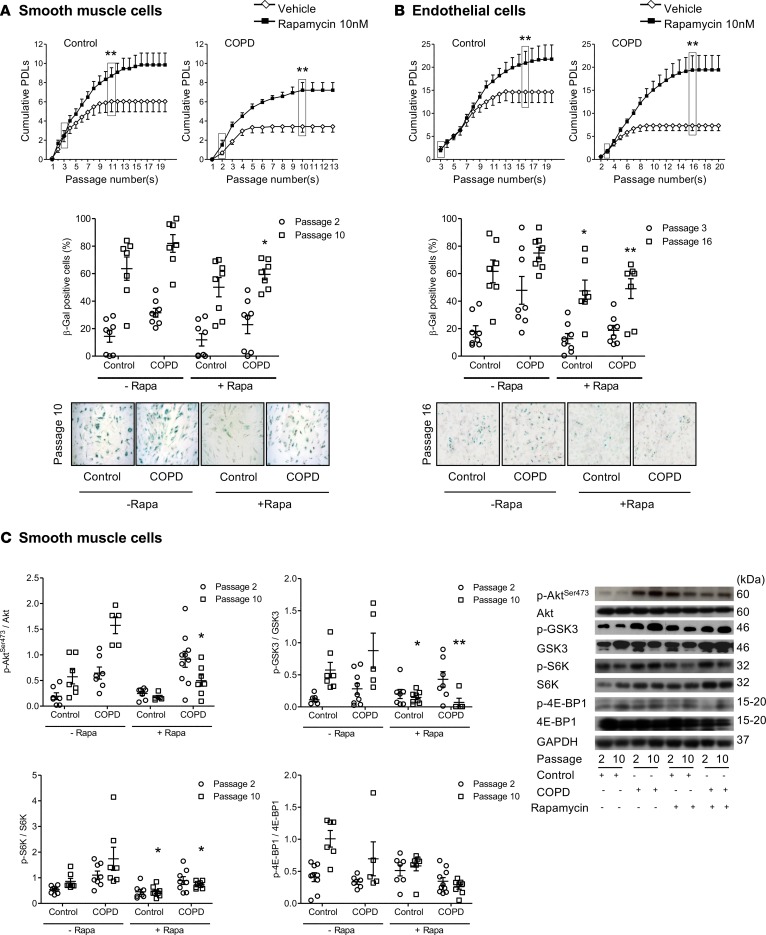
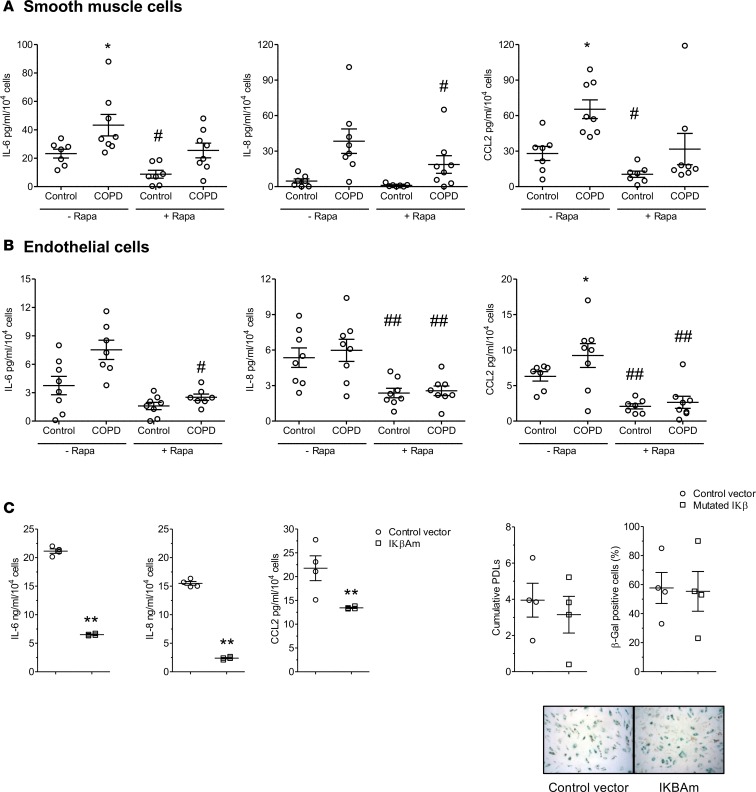
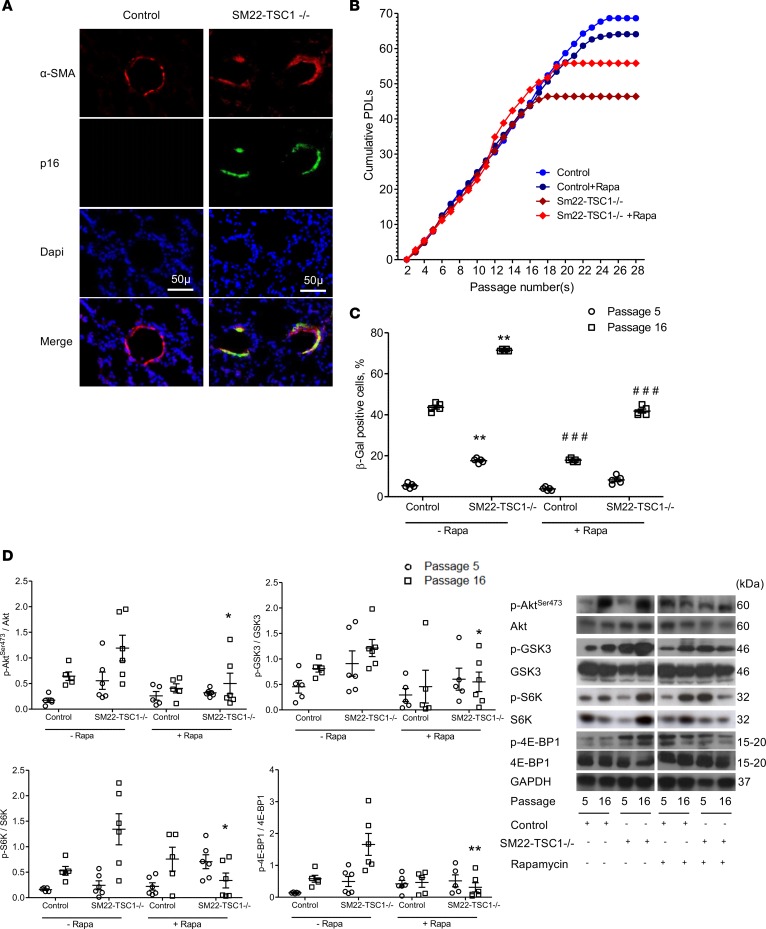
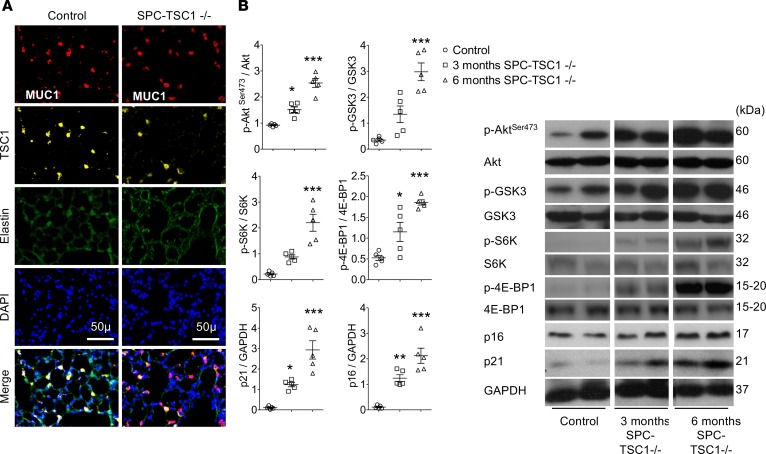
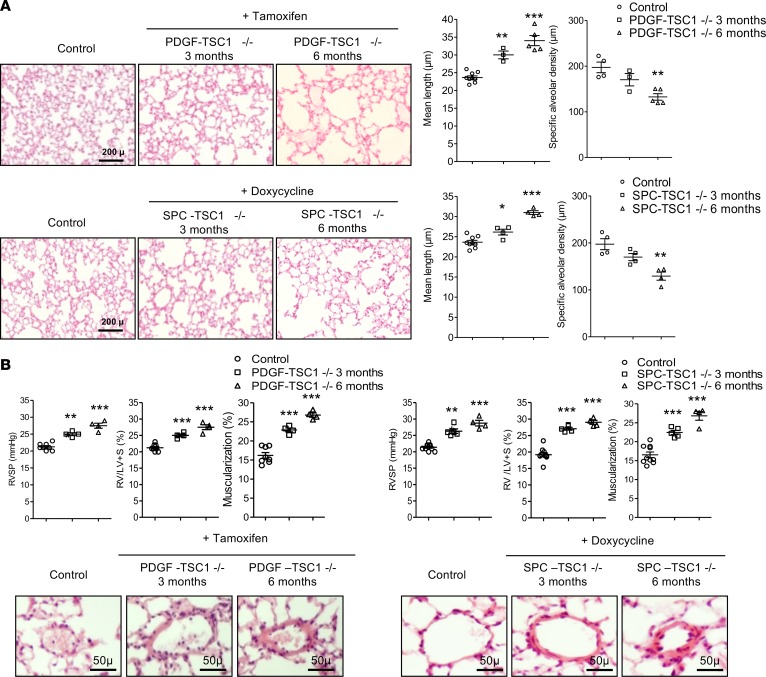
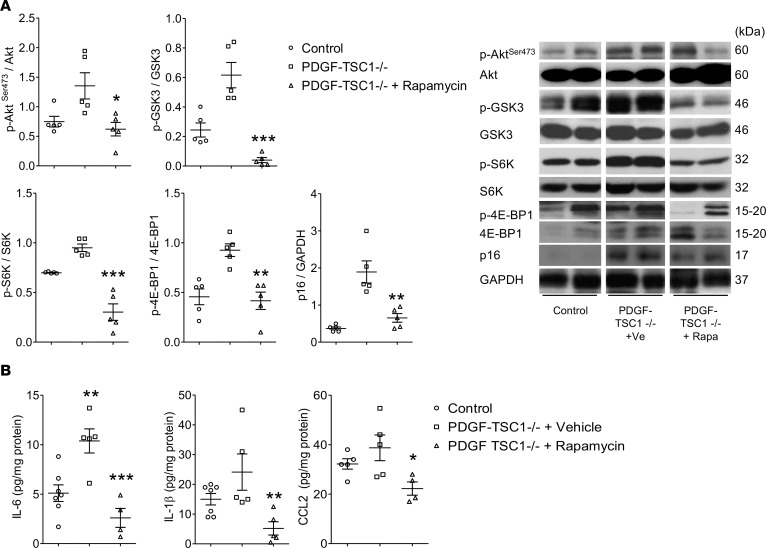
Chronic obstructive pulmonary disease (COPD) is a highly prevalent and devastating condition for which no curative treatment is available. Exaggerated lung cell senescence may be a major pathogenic factor. Here, we investigated the potential role for mTOR signaling in lung cell senescence and alterations in COPD using lung tissue and derived cultured cells from patients with COPD and from age- and sex-matched control smokers. Cell senescence in COPD was linked to mTOR activation, and mTOR inhibition by low-dose rapamycin prevented cell senescence and inhibited the proinflammatory senescence-associated secretory phenotype. To explore whether mTOR activation was a causal pathogenic factor, we developed transgenic mice exhibiting mTOR overactivity in lung vascular cells or alveolar epithelial cells. In this model, mTOR activation was sufficient to induce lung cell senescence and to mimic COPD lung alterations, with the rapid development of lung emphysema, pulmonary hypertension, and inflammation. These findings support a causal relationship between mTOR activation, lung cell senescence, and lung alterations in COPD, thereby identifying the mTOR pathway as a potentially new therapeutic target in COPD.

Keywords: Aging; COPD; Cellular senescence; Pulmonology.


Conflict of interest statement

Conflict of interest: The authors have declared that no conflict of interest exists.

Figures

Figure 1
Figure 1. Analysis of lung samples from 30 patients with COPD and 30 controls.
(A) Protein levels of Akt phosphorylated at Ser473 (Akt-Ser473), glycogen synthase kinase 3 (GSK3), S6 kinase (S6K), and 4E-binding protein 1 (4E-BP1), and of p16 and p21 proteins, measured in the lungs relative to GAPDH, using Western blot, in patients with COPD and controls. Values are mean ± SEM, *P < 0.05, **P < 0.01 compared with values from controls. Positive correlation between p-Akt-Ser473 and p16 protein levels (Spearman r = 0.59; P < 0.001, by 2-tailed unpaired t test) in patients with COPD and controls. (B) From left to right, representative photographs of von Willebrand factor–positive endothelial cells, α-SMA–positive smooth muscle cells, and α-MUC1–positive alveolar epithelial cells also stained for p16. Scale bars: 25 μm.
Figure 2
Figure 2. Analysis of cultured cells from patients with COPD and controls.
(A) Percentage of β-Gal–positive cells and protein levels of Akt phosphorylated at Ser473 (Akt-Ser473), glycogen synthase kinase 3 (GSK3), S6 kinase (S6K), and 4E-binding protein 1 (4E-BP1) proteins in cultured pulmonary artery smooth muscle cells (PA-SMCs) from 11 controls and 12 patients with COPD at the earliest cell passage. Values are mean ± SEM. **P < 0.01 vs. controls, by 2-tailed t test. Representative photographs of PA-SMCs from patients with COPD and controls stained for senescence-associated β-Gal activity at the corresponding cell passage (left panel; original magnification, 10×). Representative photographs of PA-SMCs from patients with COPD and controls costained for p-Akt and p16 (right panels), illustrated with their respective gels. Scale bars: middle panel 200μm and right panel 25 μm. (B) Similar representations for pulmonary vascular endothelial cells (P-ECs) from 12 patients with COPD and 12 controls. These measurements were performed in cells deprived of serum for 24 hours (P-ECs) or for 48 hours (PA-SMCs).
Figure 3
Figure 3. Effect of rapamycin on cell senescence.
Effect of rapamycin treatment on PA-SMCs (A) from 7 patients with COPD and 8 controls and P-ECs (B) from 8 patients with COPD and 8 controls. From top to bottom in A and B, graphs show the mean values of PDL at successive cell passages and percentage of β-Gal–positive cells from controls and patients with COPD at indicated cell passages. Values are mean ± SEM. Representative photographs of PA-SMCs and P-ECs from patients with COPD and controls stained for senescence-associated β-Gal activity at indicated passages. *P < 0.05, **P < 0.01 vs. vehicle-treated cells at the corresponding cell passage (original magnification, 10×), by 2-way ANOVA. (C) Western blots and graphs of protein levels of Akt phosphorylated at Ser473 (Akt-Ser473), glycogen synthase kinase 3 (GSK3), S6 kinase (S6K), and 4E-binding protein 1 (4E-BP1) in PA-SMCs from controls and patients with COPD at passages 2 and 10, during vehicle or rapamycin treatment. Values are mean ± SEM. *P < 0.05, **P < 0.01 compared with vehicle-treated cells at the corresponding cell passage (2-way ANOVA with Bonferroni posthoc test). These measurements were performed in cells deprived of serum for 24 hours (P-ECs) or for 48 hours (PA-SMCs).
Figure 4
Figure 4. Effect of rapamycin treatment on synthesis of pro-inflammatory cytokines.
Effect of rapamycin treatment on the levels of proinflammatory cytokines (IL-6, IL-8, and CCL2) measured in conditioned media of PA-SMCs (A) from 7 patients with COPD and 8 controls, and P-ECs (B) from 8 patients with COPD and 8 controls. Values are mean ± SEM. *P < 0.05, compared with values from controls, #P < 0.05, ##P < 0.01 compared with vehicle-treated cells, by 2-way ANOVA. (C) Levels of cytokines released by PA-SMCs treated with a retroviral vector expressing the NF-κB inhibitor IκΒαM, compared with the levels released by cells treated with the control vector. The graphs show levels of IL-6, IL-8, and CCL2 in PA-SMC–conditioned media, cumulative PDL, and percentage of β-Gal–positive cells. **P < 0.01 compared with values in cells infected with the control vector, by 2-tailed unpaired t test. These measurements were performed in cells deprived of serum for 24 hours (P-ECs) or for 48 hours (PA-SMCs).
Figure 5
Figure 5. Characteristics of PA-SMCs from SM22-TSC1–/– mice.
(A) Photomicrographs of pulmonary vessel walls showing p16-positive cells also stained for α-smooth muscle actin (α-SMA) in SM22-TSC1–/– mice compared with control mice. Scale bars: 50 μm. (B) Replicative senescence of PA-SMCs from SM22-TSC1–/– and control mice treated by rapamycin or vehicle (n = 5–6 in each group). Cells were subjected to repeated passages and counted at each passage, and the population doubling level (PDL) was calculated. (C) Percentage of β-galactosidase–positive (β-Gal–positive) PA-SMCs from SM22-TSC1–/– and control mice at passages 5 and 16. Data are mean ± SEM. **P < 0.01 vs. controls at the corresponding cell passage, ###P < 0.001 compared with vehicle-treated cells at the corresponding cell passage, by 2-way ANOVA. (D) Representative Western blots and graphs of protein levels of Akt phosphorylated at Ser473 (Akt-Ser473), glycogen synthase kinase 3 (GSK3), S6 kinase (S6K), and 4E-binding protein 1 (4E-BP1) in PA-SMCs from SM22-TSC1–/– and control mice at passages 5 and 16, during treatment with either vehicle or rapamycin. Values are mean ± SEM. *P < 0.05, **P < 0.01 compared with vehicle-treated cells at the corresponding cell passage (analysis by 2-way ANOVA with Bonferroni posthoc test).
Figure 6
Figure 6. Effects of mTOR overactivation in PDGF-TSC1–/– mice.
TSC1 deletion was induced by i.p. tamoxifen in PDGF-TSC1–/– mice, which were investigated 3 and 6 months later comparatively with vehicle-treated mice. (A) Representative photographs of CD31-positive endothelial cells stained for TSC1 in control (left) and PDGF-TSC1–/– (right) mice. Scale bars: 50 μm. (B) Lung levels of Akt phosphorylated at Ser473 (Akt-Ser473), glycogen synthase kinase 3 (GSK3), S6 kinase (S6K), 4E-binding protein 1 (4E-BP1), p21, and p16 proteins in PDGF-TSC1–/– mice 3 and 6 months after starting tamoxifen treatment, compared with vehicle-treated control mice. *P < 0.05, **P < 0.01, ***P < 0.001 vs. control mice (1-way ANOVA).
Figure 7
Figure 7. Effects of mTOR overactivation in SPC-TSC1–/– mice.
TSC1 deletion was induced by adding doxycycline to the drinking water of SPC-TSC1–/– mice, which were investigated 3 and 6 months later comparatively with vehicle-treated mice. (A) Representative photographs of MUC1-positive alveolar epithelial cells stained for TSC1 in control (left) and SPC-TSC1–/– (right) mice. Scale bars: 50 μm. (B) Lung levels of Akt phosphorylated at Ser473 (Akt-Ser473), glycogen synthase kinase 3 (GSK3), S6 kinase (S6K), 4E-binding protein 1 (4E-BP1), p21, and p16 proteins in SPC-TSC1–/– mice 3 and 6 months after starting doxycycline treatment, compared with vehicle-treated control mice. *P < 0.05, **P < 0.01, ***P < 0.001 vs. control mice (1-way ANOVA).
Figure 8
Figure 8. Effects of mTOR overactivation in SPC-TSC1–/– and PDGF-TSC1–/– mice.
TSC1 deletion was induced by i.p. tamoxifen in PDGF-TSC1–/– mice and by treatment with doxycycline in drinking water in SPC-TSC1–/– mice. The mice were investigated 3 and 6 months later and were compared with vehicle-treated mice. (A) Development of lung emphysema in PDGF-TSC1–/– and SPC-TSC1–/– mice. From left to right, representative lung sections stained with H&E and showing emphysema lesions in PDGF-TSC1–/– and SPC-TSC1–/– mice, mean linear intercept of alveolar septa, and air space. Scale bars: 200 μm. (B) Development of pulmonary hypertension in PDGF-TSC1–/– and SPC-TSC1–/– mice. Right ventricular systolic pressure (RVSP), right ventricular/left ventricular + septum weight ratio (RV/LV+S), and muscularization of pulmonary vessels (percent of muscularized vessels over the total number of pulmonary vessels). Representative pulmonary vessels in PDGF-TSC1–/– and SPC-TSC1–/– mice compared with control mice. *P < 0.05, **P < 0.01, ***P < 0.001 vs. control mice (1-way ANOVA). Scale bars: 50 μm.
Figure 9
Figure 9. Effects of rapamycin-treated mice on lung emphysema and pulmonary hemodynamics in PDGF-TSC1–/–.
Rapamycin was given in drinking water (2.5 mg/ml) and by oral gavage (2.5 or 5 mg/kg every other day) concomitantly with tamoxifen for 3 months. (A) Representative H&E-stained lung sections showing emphysema lesions in PDGF-TSC1–/– mice treated with rapamycin or vehicle, compared with control transgenic mice not treated with tamoxifen. Scale bar: 200 μm. (B) Mean linear intercept of alveolar septa and air space. (C) Representative lung sections showing pulmonary vessel remodeling. Scale bar: 50 μm. (D) RVSP, RV/(LV/S), and pulmonary-vessel muscularization. *P < 0.05, **P < 0.01, ***P < 0.001 vs. vehicle-treated PDGF-TSC1–/– mice, by 1-way ANOVA.
Figure 10
Figure 10. Effects of rapamycin treatment on lung protein levels in PDGF-TSC1–/– mice.
(A) Lung levels of phosphorylated Akt-Ser473, GSK3, S6K, and 4E-BP1 normalized for total protein and lung levels of p16 protein, with their corresponding gels in the right panel. (B) Lung levels of the cytokines IL-6, IL-1β, and CCL2. *P < 0.05, **P < 0.01, ***P < 0.001 vs. vehicle-treated PDGF-TSC1–/– mice, by 1-way ANOVA.

References

    1. Gershon AS, Warner L, Cascagnette P, Victor JC, To T. Lifetime risk of developing chronic obstructive pulmonary disease: a longitudinal population study. Lancet. 2011;378(9795):991–996. doi: 10.1016/S0140-6736(11)60990-2. - DOI - PubMed
    1. Celli BR, MacNee W, ATS/ERS Task Force Standards for the diagnosis and treatment of patients with COPD: a summary of the ATS/ERS position paper. Eur Respir J. 2004;23(6):932–946. doi: 10.1183/09031936.04.00014304. - DOI - PubMed
    1. Vanfleteren LE, et al. Clusters of comorbidities based on validated objective measurements and systemic inflammation in patients with chronic obstructive pulmonary disease. Am J Respir Crit Care Med. 2013;187(7):728–735. doi: 10.1164/rccm.201209-1665OC. - DOI - PubMed
    1. Han MK, et al. Chronic obstructive pulmonary disease phenotypes: the future of COPD. Am J Respir Crit Care Med. 2010;182(5):598–604. doi: 10.1164/rccm.200912-1843CC. - DOI - PMC - PubMed
    1. Adnot S, et al. Telomere Dysfunction and Cell Senescence in Chronic Lung Diseases: Therapeutic Potential. Pharmacol Ther. 2015;153:125–134. doi: 10.1016/j.pharmthera.2015.06.007. - DOI - PubMed

Publication types

MeSH terms