. 2018 Feb 7;9(1):532.
doi: 10.1038/s41467-018-02893-x.

Drosha drives the formation of DNA:RNA hybrids around DNA break sites to facilitate DNA repair

Affiliations

Drosha drives the formation of DNA:RNA hybrids around DNA break sites to facilitate DNA repair

Wei-Ting Lu et al. Nat Commun. .

Abstract

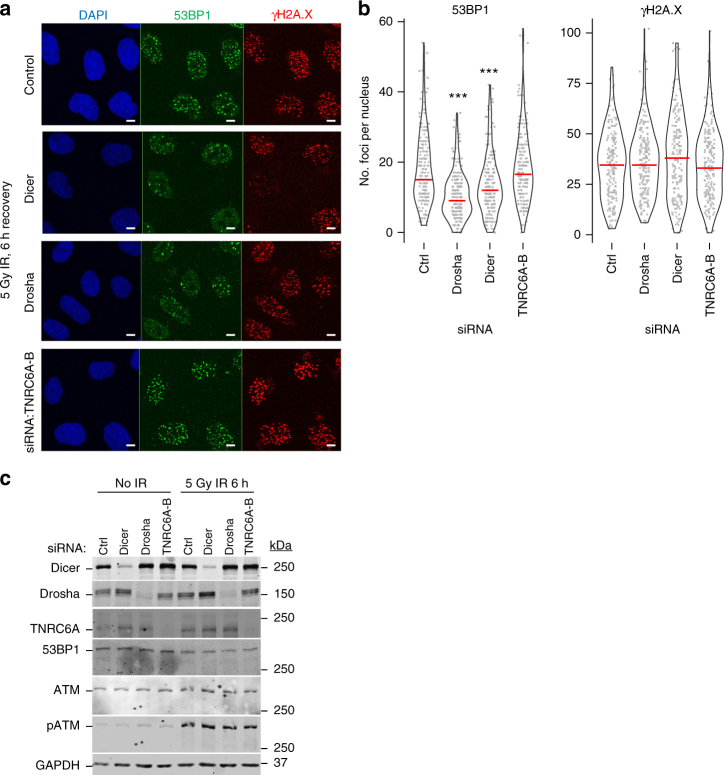
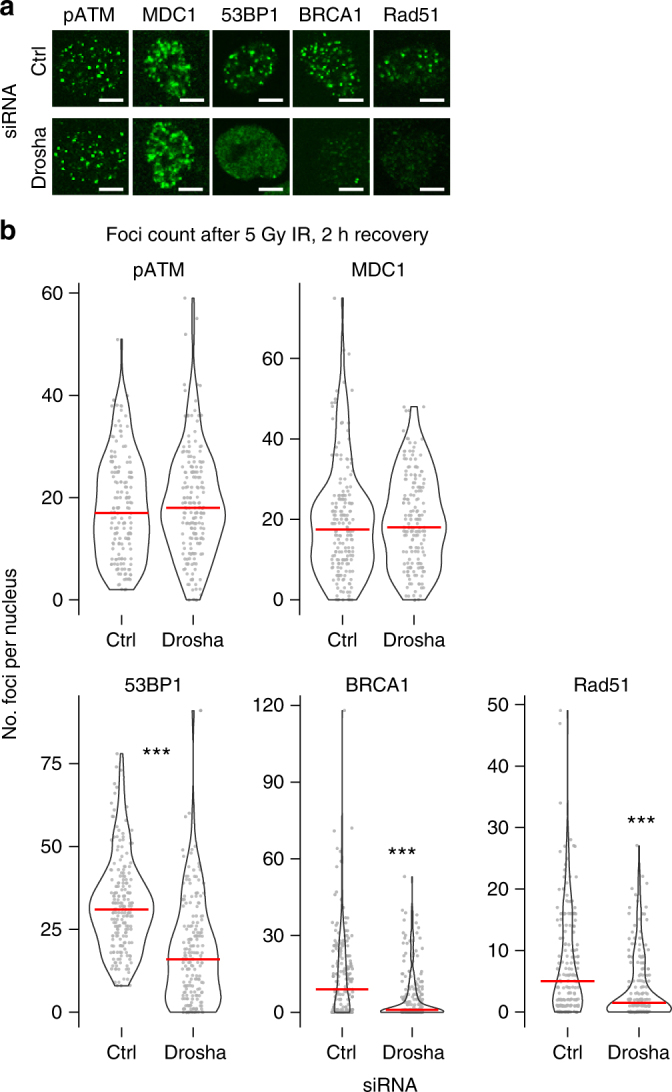
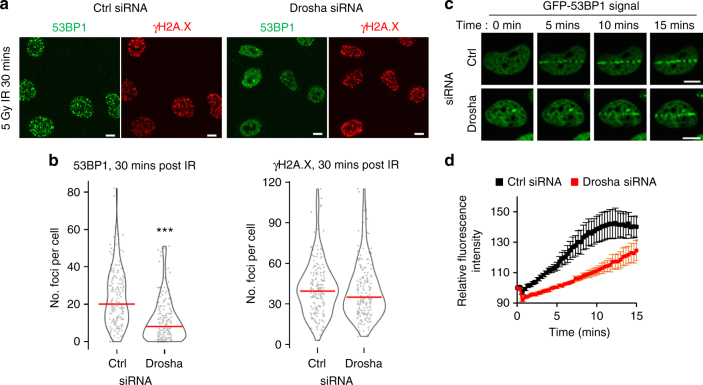
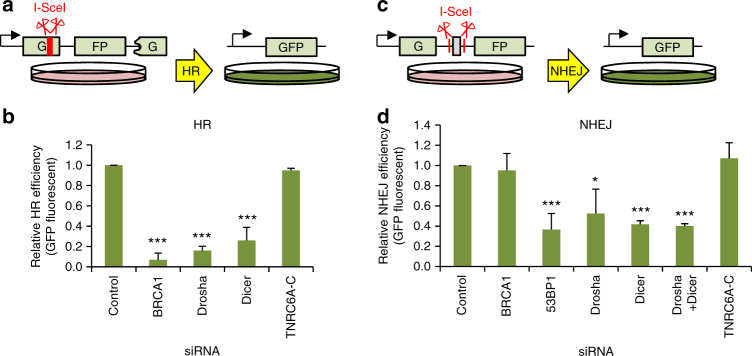
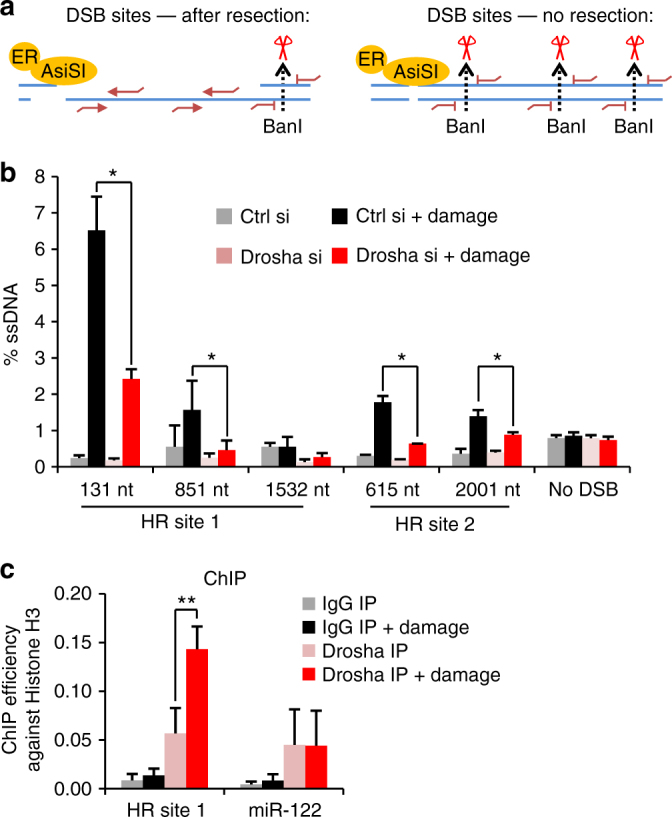
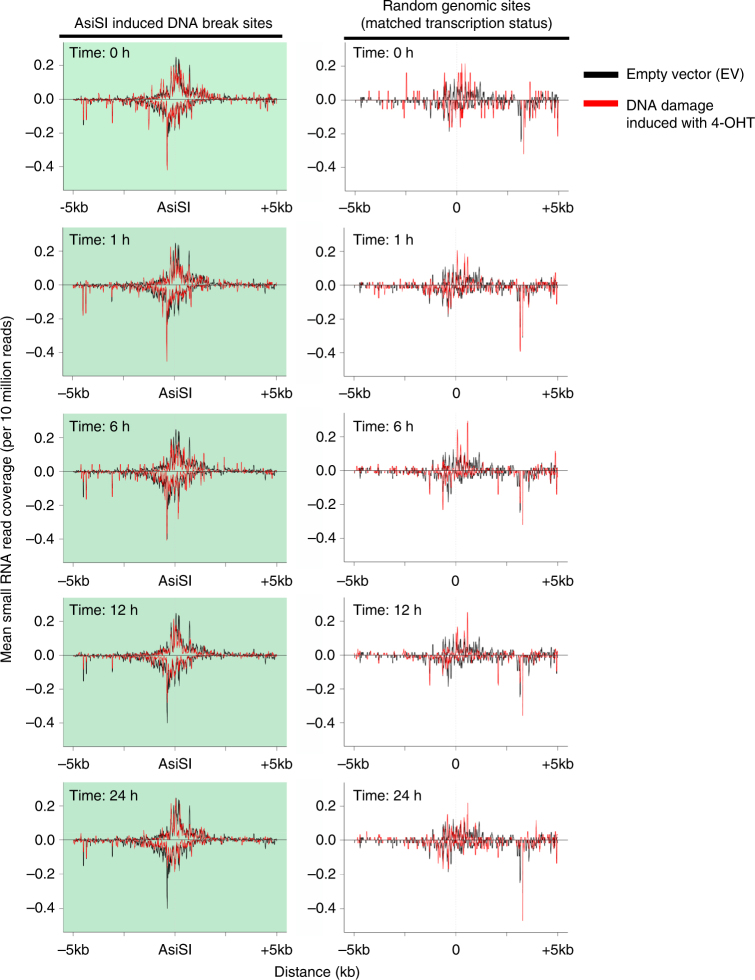
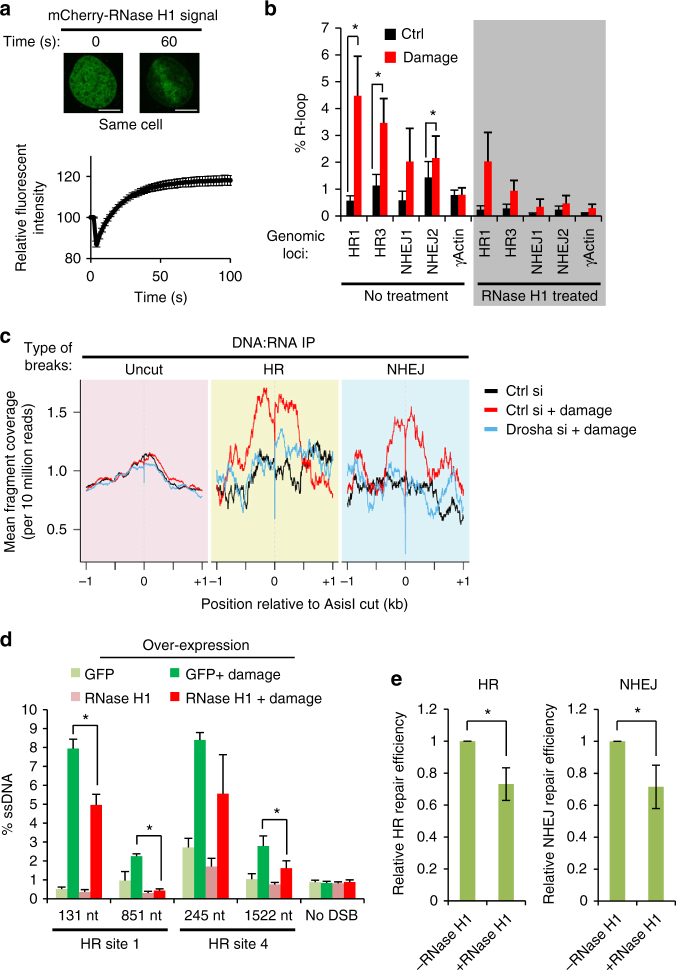
The error-free and efficient repair of DNA double-stranded breaks (DSBs) is extremely important for cell survival. RNA has been implicated in the resolution of DNA damage but the mechanism remains poorly understood. Here, we show that miRNA biogenesis enzymes, Drosha and Dicer, control the recruitment of repair factors from multiple pathways to sites of damage. Depletion of Drosha significantly reduces DNA repair by both homologous recombination (HR) and non-homologous end joining (NHEJ). Drosha is required within minutes of break induction, suggesting a central and early role for RNA processing in DNA repair. Sequencing of DNA:RNA hybrids reveals RNA invasion around DNA break sites in a Drosha-dependent manner. Removal of the RNA component of these structures results in impaired repair. These results show how RNA can be a direct and critical mediator of DNA damage repair in human cells.


Conflict of interest statement

The authors declare no competing financial interests.

Figures

Fig. 1
Fig. 1
Dicer and Drosha are required for formation of 53BP1 foci after ionizing radiation (IR). a Representative immunofluorescence images visualizing IR-induced 53BP1 foci in A549 cells. 53BP1 in green channel, γH2A.X in red, DAPI-stained nuclei in blue. Scale bars, 10 µm. b Quantification of a. The number of foci per nucleus was counted using the FindFoci ImageJ plugin and plotted as individual data points (gray) and a violin plot. Data from 3 biological replicates, counting at least 60 cells per replicate. Red line represents the median in each condition. Statistical testing was performed using Dunn’s test with Bonferroni correction for multiple comparisons, ***p ≤ 0.001. c Representative western blots for a, b confirming knockdowns and induction of DNA damage
Fig. 2
Fig. 2
Drosha is involved in DDR downstream of MDC1. a Representative immunofluorescence image visualizing IR-induced DDR foci in A549 cells, 2 h post 5 Gy IR. Scale bars, 10 µm. b Quantification of a. Number of indicated foci per nucleus was counted as in Fig.1b across 3 biological replicates counting at least 60 cells per replicate. Red line denotes the median in each condition. Statistical significance determined using Mann-Whitney non-parametric test, ***p ≤ 0.001
Fig. 3
Fig. 3
Drosha is required for early 53BP1 localization after DNA damage. a Representative immunofluorescence image of IR-induced 53BP1 foci in A549 cells, 30 mins post 5 Gy IR. Scale bars, 10 µm. b Drosha knockdown significantly impairs 53BP1 foci formation as early as 30 minutes after 5 Gy IR. Violin plots and data points show quantification, as in Fig. 1B, of IR-induced 53BP1 and γH2A.X foci shown in a. 200 cells were counted across 3 biological replicates, ***p ≤ 0.001, Mann-Whitney non-parametric test. c U2OS cells expressing GFP-53BP1 were subjected to laser microirradiation and GFP redistribution was monitored in real time. Images of selected time points post microirradiation are shown. d Quantification of time-course as in c, error bars = SEM, n ≥ 30 cells per condition over 4 replicates
Fig. 4
Fig. 4
Drosha is required for effective homologous recombination and non-homologous end joining. a Cartoon depicting the quantitative HR reporter assay. Incompatible DNA ends are generated after digestion of the chromosomally integrated reporter with I-SceI endonuclease. Gene conversion after HR repair reconstitutes an active GFP gene, measured by FACS. b Quantitation of HR repair efficiency in U2OS cells using the reporter system described in a. In all cases, error bars = SD, Wilcoxon signed rank non-parametric test, ***p ≤ 0.001, N = 3. c NHEJ reporter schematic. An adenovirus exon results in a non-functional GFP product; following cleavage by I-SceI, this is excised and NHEJ repair ligates introns 1 and 2 together. Splicing of the NHEJ-repaired product results in an active GFP which can be measured by FACS. d Quantitation of NHEJ repair efficiency in U2OS cells using the reporter system described in c. Mean of 3 biological replicates, error bars = SD, Wilcoxon signed rank non-parametric test, *p ≤ 0.05, ***p ≤ 0.001
Fig. 5
Fig. 5
Drosha is required for DNA resection after DNA damage and is recruited to DSBs. a Cartoon describing quantitative DNA resection assay. Treatment of U2OS cells with 4-OHT induces damage by HA-ER-AsiSI. Genomic DNA is harvested and subjected to restriction digest (dotted lines). qPCR primers, red lines, are designed at either side of the restriction sites. Only loci that had been resected prior to digest can be amplified. b qPCR resection assay as in a at two HR sites, and the control locus (no DSB) which does not span an AsiSI restriction site, as described in ref. following 4 h of damage induction. Error bars = SD, Student’s 2-sample T-test, *p ≤ 0.05. c qPCR of Drosha and control IgG ChIP at an HR locus and a canonical Drosha binding site at the miR-122 genomic locus 1 h after damage induction. The ChIP efficiency was calculated against a histone H3 ChIP performed in parallel, error bars = SEM, Student’s 2-sample T-test, **p ≤ 0.01, N = 3
Fig. 6
Fig. 6
No significant enrichment of small RNA is found around 99 known AsiSI cut sites in the genome. Coverage profiles of 21–23 nt non-miRNA small RNAs that map to regions 5 kb on either side of AsiSI cut sites at different time points after induction of damage. Negative coverage refers to those reads mapping to the consensus genome minus strand. Left, 99 cut AsiSI sites (shaded with pale green). Right, same number of random genomic sites with similar transcriptional activity to the 99 AsiSI cut sites, as determined by TPM count and gene length from 4sU-Seq data on control cells (analysis described in Methods). These graphs are centred around a point (denoted as 0) at the same distance from the TSS as the matched AsiSI site. Each time point in the AsiSI transfected samples (red lines) is superimposed on reads from the EV control (black lines). As the EV control has never been exposed to the specific cuts produced by AsiSI, there is no potential for any small RNAs produced by that event to be present. Any reads present in the EV control can therefore be considered background
Fig. 7
Fig. 7
DNA:RNA hybrids form around DNA break sites to facilitate DNA repair in a Drosha-dependent manner. a Relocation of inactivated E. coli mCherry-RNase H1 D10R E48R to sites of laser-induced DNA damage. Representative fluorescence images, top. Scale bars, 10 µm. Bottom, graph showing quantitation of 168 cells over 3 replicates, error bars = SEM. b DNA:RNA hybrid IP (DRIP) followed by qPCR around HR and NHEJ DNA break sites, and control undamaged actin exon 5 locus after 2 h of damage induction. As a positive control, samples were treated in vitro with RNase H1 (shaded section). Error bars = SEM, Student’s paired T-test, *p ≤ 0.05 in 4 biological replicates. c DRIP-Seq was performed in conditions as in b. Graph shows enrichment of DNA:RNA hybrids around HR-repaired and NHEJ-repaired cut sites following DNA damage compared to sites documented to remain uncut following damage induction. d Over-expression of RNase H1 or a GFP control was followed by DNA resection assay as in Fig.5 a, b. N = 3, error bars = SEM, Student’s 2-sample T-test, **p ≤ 0.01. e RNase H1 was over-expressed in the HR (left) and NHEJ (right) repair reporter system cell lines (described in Fig. 4a) 6 h prior to I-SceI expression and GFP-positive cells were quantified as a measure of repair efficiency. N = 3 each, error bars = SD, Student’s 2-sample T-test, *p ≤ 0.05

References

    1. Ciccia A, Elledge SJ. The DNA damage response: making it safe to play with knives. Mol. Cell. 2010;40:179–204. doi: 10.1016/j.molcel.2010.09.019. - DOI - PMC - PubMed
    1. Zimmermann M, de Lange T. 53BP1: pro choice in DNA repair. Trends Cell Biol. 2014;24:108–117. doi: 10.1016/j.tcb.2013.09.003. - DOI - PMC - PubMed
    1. Feng L, et al. Cell cycle-dependent inhibition of 53BP1 signaling by BRCA1. Cell Discov. 2015;1:15019. doi: 10.1038/celldisc.2015.19. - DOI - PMC - PubMed
    1. Cotta-Ramusino C, et al. DNA damage response screen identifies RHINO, a 9-1-1 and TopBP1 interacting protein required for ATR signaling. Science. 2011;332:1313–1317. doi: 10.1126/science.1203430. - DOI - PMC - PubMed
    1. Adamson B, Smogorzewska A, Sigoillot FD, King RW, Elledge SJ. A genome-wide homologous recombination screen identifies the RNA-binding protein RBMX as a component of the DNA-damage response. Nat. Cell Biol. 2012;14:318–328. doi: 10.1038/ncb2426. - DOI - PMC - PubMed

Publication types