. 2018 Feb 7;9(1):548.
doi: 10.1038/s41467-018-03035-z.

A small molecule inhibitor of Rheb selectively targets mTORC1 signaling

Affiliations

A small molecule inhibitor of Rheb selectively targets mTORC1 signaling

Sarah J Mahoney et al. Nat Commun. .

Abstract

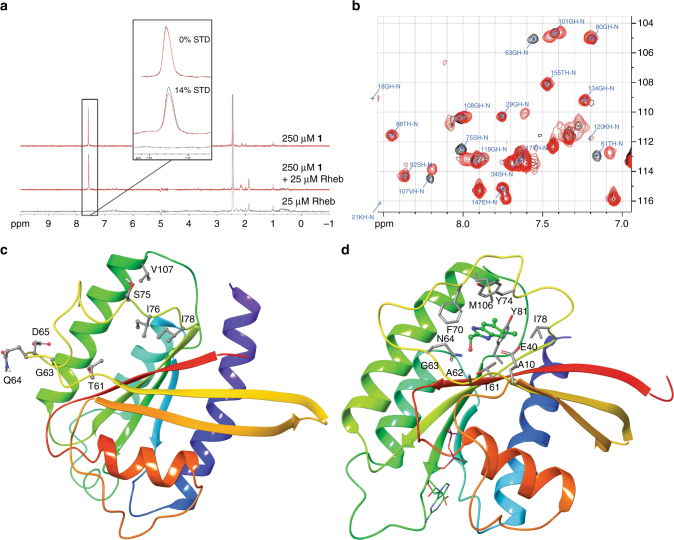
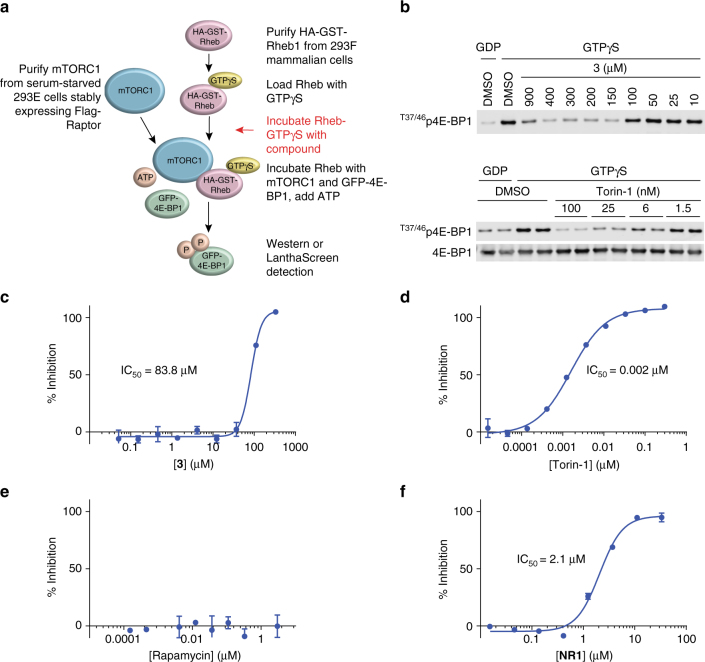
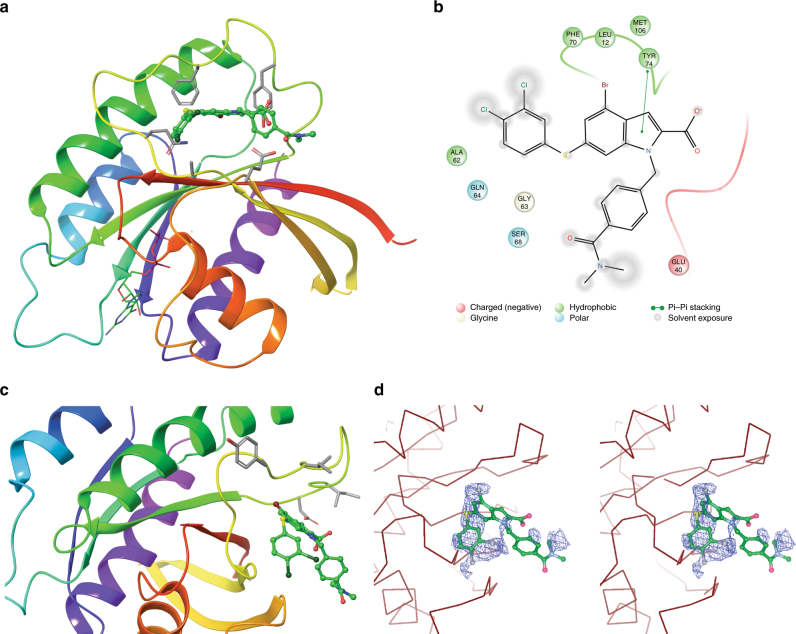
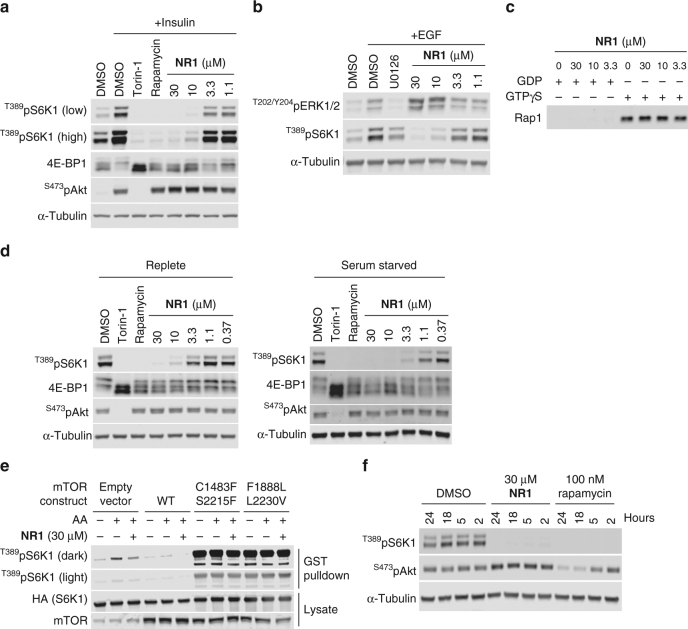
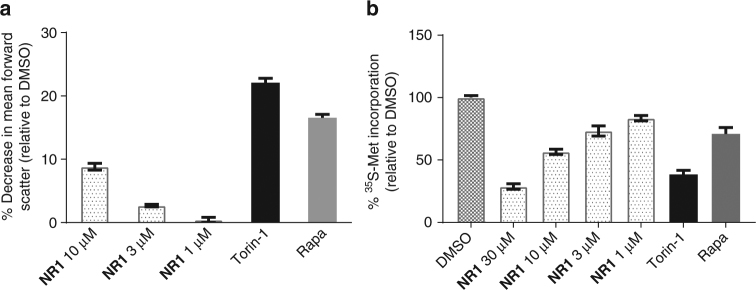
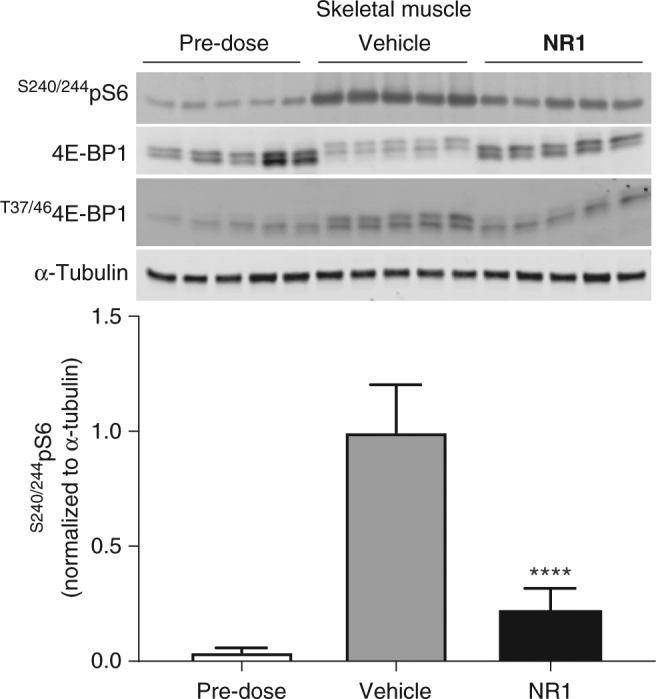
The small G-protein Rheb activates the mechanistic target of rapamycin complex 1 (mTORC1) in response to growth factor signals. mTORC1 is a master regulator of cellular growth and metabolism; aberrant mTORC1 signaling is associated with fibrotic, metabolic, and neurodegenerative diseases, cancers, and rare disorders. Point mutations in the Rheb switch II domain impair its ability to activate mTORC1. Here, we report the discovery of a small molecule (NR1) that binds Rheb in the switch II domain and selectively blocks mTORC1 signaling. NR1 potently inhibits mTORC1 driven phosphorylation of ribosomal protein S6 kinase beta-1 (S6K1) but does not inhibit phosphorylation of AKT or ERK. In contrast to rapamycin, NR1 does not cause inhibition of mTORC2 upon prolonged treatment. Furthermore, NR1 potently and selectively inhibits mTORC1 in mouse kidney and muscle in vivo. The data presented herein suggest that pharmacological inhibition of Rheb is an effective approach for selective inhibition of mTORC1 with therapeutic potential.


Conflict of interest statement

All authors are employees of Navitor Pharmaceuticals, Inc.

Figures

Fig. 1
Fig. 1
Fragment-based lead generation of Rheb-binding small molecules. a 1D 1H saturation transfer difference (STD) NMR spectra of 1 in presence and absence of C-terminal truncated Rheb. b 2D 1H–15N heteronuclear multi-quantum coherence (HMQC) NMR spectra of 15N-labeled Rheb (200 µM) alone (black) and in presence of 1 mM 1 (red) showing key residues of the switch II domain. c Structure of Rheb showing side-chains of residues where significant chemical shift perturbations were observed upon binding 1. NMR structure of GDP-bound Rheb from Karassek et al. shown. d 1.56 Å X-ray crystal structure of GDP-Rheb with 1 bound in the switch II domain. Side-chains of residues within 4 Å of 1 are shown
Fig. 2
Fig. 2
Rheb-binding compounds inhibit mTORC1 activity in vitro. a Schematic of Rheb-IVK (described in Methods section). b Evaluation of 3 and Torin-1 in the Rheb-IVK assay using Western blot analysis. Rheb-IVK reaction mixtures were incubated with either 3 or Torin-1 at the indicated doses, run on Western blots, and probed with T37/T46p4E-BP1-specific antibody. cf Evaluation of 3, Torin-1, rapamycin, and NR1 in Rheb-IVK. The assay was run similar to the Western blot but processed in a LanthaScreen format using a Terbium labeled T46p4E-BP1 antibody. Error bars represent standard deviation from the mean of technical duplicates; graphs represent data from one of at least three separate experiments
Fig. 3
Fig. 3
Biophysical characterization of NR1. a 2.6 Å X-ray crystal structure of C-terminal truncated Rheb bound to NR1. Side-chains of residues within 4 Å of NR1 are shown in stick representation. b Ligand interaction diagram of NR1 bound to Rheb; side-chains of residues within 4 Å of the ligand are shown. c Another view of the X-ray structure of NR1 bound to Rheb; side-chains of residues implicated in activating mTORC1 are shown. d Stereo image of NR1 bound to Rheb
Fig. 4
Fig. 4
NR1 selectively inhibits mTORC1 but not mTORC2 in cells. a, b Effect of NR1 on insulin-dependent activation of mTORC1 and EGF-dependent activation of T202/Y204pERK1/2. MCF-7 cells were serum-starved for 16 h and treated with compound for 90 min before cell lysis and Western blot analysis. For insulin-stimulated cells, 100 nM insulin was added 30 min before cell lysis. For EGF-stimulated cells, 100 ng mL−1 EGF was added 10 min before cell lysis. c Rap1 activity was detected in lysates loaded in vitro with either GDP or GTPγS and treated with NR1 at the indicated concentrations. This was followed by a subsequent pulldown of GST-RalGDS-RBD. Bound Rap1 was detected by Western blot. d Evaluation of NR1 in a LAM patient-derived cell line (TRI102) under replete and serum-starved conditions. For replete conditions, TRI102 cells were treated for 90 min with compound in DMEM + 10% FBS. For serum-starved conditions, TRI102 cells were serum-starved 16 h and then treated for 90 min with compound prior to cell lysis and Western blot analysis. e HEK293 cells co-transfected with the indicated mTOR constructs and HA-GST-S6K1 were starved of amino acids or treated with NR1. To assess mTORC1 activity, an HA IP was performed and Western blots probed for T389pS6K1. f Chronic treatment of PC3 cells with NR1 to evaluate the inhibition of mTORC1 (using T389pS6K1) versus mTORC2 (using S473pAKT). PC3 cells were treated with compound under replete conditions for 24 h prior to cell lysis and Western blot analysis. Rapamycin was used at 100 nM and Torin-1 at 250 nM
Fig. 5
Fig. 5
Functional outcome of mTORC1 inhibition by NR1. a Assessment of NR1 effect on cell size in Jurkat cells compared to Torin-1 and rapamycin. Jurkat cells were treated with NR1 over the indicated concentration range, Torin-1 (250 nM), or rapamycin (100 nM) for 48 h, and cell size was quantified as a measure of forward scatter using flow cytometry. Data are plotted as percent decrease in forward scatter. Error bars represent standard deviation of the mean of quadruplicates; graph represents data from one of three separate experiments. b Evaluation of NR1 impact on protein synthesis compared to Torin-1 and rapamycin as measured by the incorporation of 35S-methionine into total protein. MCF-7 cells were treated with NR1 at the indicated concentration range, Torin-1 (250 nM), or rapamycin (100 nM) for 2.5 h and labeled with 35S-methionine for 0.5 h. Error bars represent standard deviation of the mean of duplicates; graph represents data from one of two separate experiments
Fig. 6
Fig. 6
NR1 inhibits feeding-induced mTORC1 activation in skeletal muscle. Mice were starved for 16 h pre-dose to achieve a basal level of mTORC1 activity, then dosed with NR1 (30 mg kg−1 IP) or vehicle and allowed to re-feed ad libitum. After 2 h, gastrocnemius muscle was collected, and S240/244pS6 levels were measured by Western blot and quantified. The results are shown as mean ± SEM (n = 5 per group). One way ANOVA for NR1 with respect to vehicle are as follows: F (2, 12) = 73.8, p < 0.001

References

    1. Laplante M, Sabatini DM. mTOR signaling in growth control and disease. Cell. 2012;149:274–293. doi: 10.1016/j.cell.2012.03.017. - DOI - PMC - PubMed
    1. Dibble CC, Manning BD. Signal integration by mTORC1 coordinates nutrient input with biosynthetic output. Nat. Cell Biol. 2013;15:555–564. doi: 10.1038/ncb2763. - DOI - PMC - PubMed
    1. Oh WJ, Jacinto E. mTOR complex 2 signaling and functions. Cell Cycle. 2011;10:2305–2316. doi: 10.4161/cc.10.14.16586. - DOI - PMC - PubMed
    1. Johnson SC, Rabinovitch PS, Kaeberlein M. mTOR is a key modulator of ageing and age-related disease. Nature. 2013;493:338–345. doi: 10.1038/nature11861. - DOI - PMC - PubMed
    1. Gui YS, et al. mTOR overactivation and compromised autophagy in the pathogenesis of pulmonary fibrosis. PLoS ONE. 2015;10:e0138625. doi: 10.1371/journal.pone.0138625. - DOI - PMC - PubMed

Publication types

MeSH terms

Substances

LinkOut - more resources