. 2018 Feb 7;8(1):2596.
doi: 10.1038/s41598-018-20619-3.

Internal noise sources limiting contrast sensitivity

Affiliations

Internal noise sources limiting contrast sensitivity

Daphné Silvestre et al. Sci Rep. .

Abstract

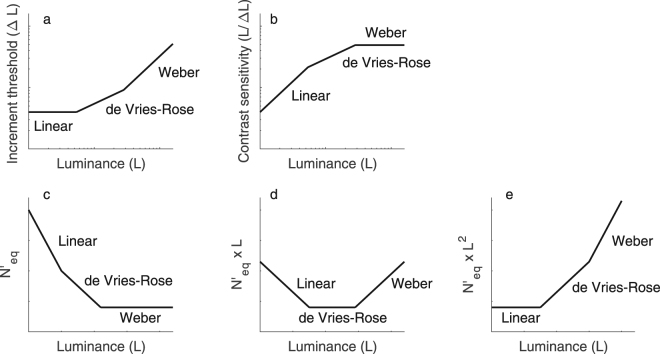
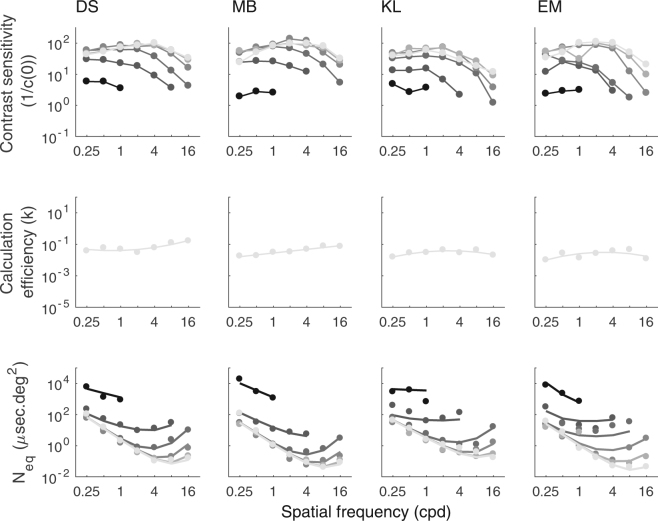
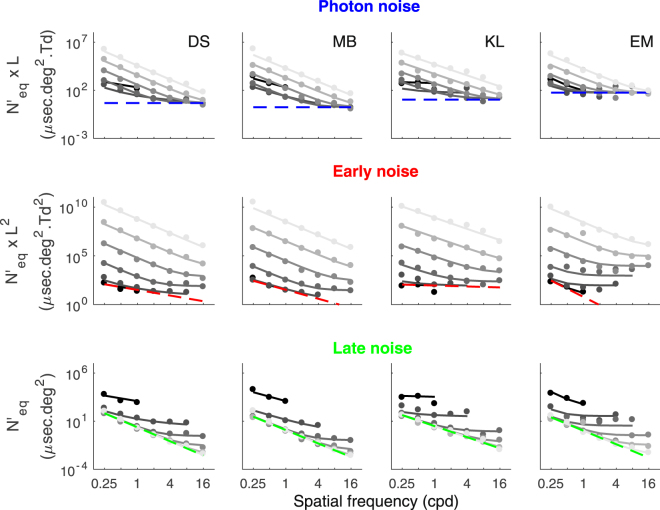
Contrast sensitivity varies substantially as a function of spatial frequency and luminance intensity. The variation as a function of luminance intensity is well known and characterized by three laws that can be attributed to the impact of three internal noise sources: early spontaneous neural activity limiting contrast sensitivity at low luminance intensities (i.e. early noise responsible for the linear law), probabilistic photon absorption at intermediate luminance intensities (i.e. photon noise responsible for de Vries-Rose law) and late spontaneous neural activity at high luminance intensities (i.e. late noise responsible for Weber's law). The aim of this study was to characterize how the impact of these three internal noise sources vary with spatial frequency and determine which one is limiting contrast sensitivity as a function of luminance intensity and spatial frequency. To estimate the impact of the different internal noise sources, the current study used an external noise paradigm to factorize contrast sensitivity into equivalent input noise and calculation efficiency over a wide range of luminance intensities and spatial frequencies. The impact of early and late noise was found to drop linearly with spatial frequency, whereas the impact of photon noise rose with spatial frequency due to ocular factors.


Conflict of interest statement

The authors declare that they have no competing interests.

Figures

Figure 1
Figure 1
The three laws limiting contrast sensitivity and equivalent input noise. (a) The three laws represented with respect to the increment threshold in absolute units (ΔL). (b) The same three laws represented with respect to contrast sensitivity (LL). The second row represents the three laws limiting equivalent input noise in units where each law is independent of luminance intensity. (c) Weber’s law is independent of luminance intensity when equivalent input noise is plotted as a function of luminance intensity. (d) de Vries-Rose law is independent of luminance intensity when equivalent input noise multiplied by luminance intensity is plotted as a function of luminance intensity. (e) Linear law is independent of luminance intensity when equivalent input noise multiplied by squared luminance intensity is plotted as a function of luminance intensity. These graphs are represented on a log-log scale and (c) to (e) are in energy units.
Figure 2
Figure 2
Observer model including the MTF, three additive internal noise sources and calculation efficiency. The additive internal noise sources comprise photon noise (i.e. phototransduction), early neural noise arising after optical aberrations modeled by the MTF and late neural noise arising after contrast normalization.
Figure 3
Figure 3
Contrast sensitivity function, calculation efficiency (k) and equivalent input noise (Neq). The first row represents contrast sensitivity of the four subjects (DS, MB, KL and EM) as a function of SF for different luminance intensities. The data points were connected with lines for clarity. The second row represents calculation efficiency estimated at 16261 Td for each subject (dots) and fitted with quadratic functions (lines). The third row represents equivalent input noise estimated for the whole range of luminance intensities (i.e. from 0.16 to 16261 Td) represented by dots and fitted with the best model (see Model section) represented by lines. Data are represented on a log-log scale and calculation efficiency and equivalent input noise are in energy units. Luminance intensities range in log steps from 0.16 to 16261 Td. The color gradation from the darkest to the lightest color represents the lowest to the highest luminance intensity, respectively.
Figure 4
Figure 4
Contrast sensitivity as a function of luminance. Each graph represents the contrast sensitivity as a function of luminance of the four subjects for one SF on a log-log scale. Triangles (red, green, blue and cyan) represent the data for each subject and the lines represent the fit of the data with the best model (see Model section). The last graph (bottom right) represents reference lines for the linear law (slope of 1), deVries-Rose’s law (slope of 0.5) and Weber’s law (null slope). This representation of the three laws allows us to make an analogy with the data above.
Figure 5
Figure 5
MTF estimation. The estimation of the equivalent input noise at the entry of the eye multiplied by luminance intensity (Neq × L) is represented in the first row of the graph. The impact of photon noise, which is independent of luminance intensity in these units, is represented by the lower limit (purple dashed line). Note that the impact of photon noise depends on the photon noise and MTF. The second row of the graph represents the MTF of each subject estimated by our model (purple line) and the MTF estimated by Watson’s model (grey line). The indicated values represent the value of the exponent of the general Lorentzian (equation (4)) found for each subject.
Figure 6
Figure 6
Equivalent input noise corrected for the MTF (N’eq). The equivalent input noise at the entry of the retina (N’eq) of each subject as a function of SF is represented in three different ways in order to represent the three sources of noise to be independent of luminance intensity. The first row represents N’eq multiplied by luminance intensity and the lower bound (blue dashed line) is the photon noise estimated by our model. The second row represents N’eq multiplied by luminance intensity squared and the lower bound (red dashed line) is the early noise estimated by our model. The third row represents N’eq and the lower bound (green dashed line) is the late noise estimated by our model. The data for each luminance (in Td) is fitted with our model (grey gradation lines). The data is represented on a log-log scale and is in energy units.

References

    1. Rose A. The relative sensitivities of television pickup tubes, photographic film and the human eye. P. Ire. 1942;30:293–300. doi: 10.1109/JRPROC.1942.230998. - DOI
    1. de Vries HL. The quantum character of light and its bearing upon threshold of vision, the differential sensitivity and visual acuity of the eye. Physica. 1943;10:553–564. doi: 10.1016/S0031-8914(43)90575-0. - DOI
    1. Barlow HB. Retinal noise and absolute threshold. J. Opt. Soc. Am. 1956;46:634–639. doi: 10.1364/JOSA.46.000634. - DOI - PubMed
    1. Van Nes FL, Bouman M. a. Spatial Modulation Transfer in the Human Eye. J. Opt. Soc. Am. 1967;57:401. doi: 10.1364/JOSA.57.000401. - DOI - PubMed
    1. Fechner, G. Elemente der Psychophysik. Elem. dur psychophysik 572 (1860).

Publication types