. 2018 Feb 7;8(1):2539.
doi: 10.1038/s41598-018-20833-z.

Surface ocean metabarcoding confirms limited diversity in planktonic foraminifera but reveals unknown hyper-abundant lineages

Affiliations

Surface ocean metabarcoding confirms limited diversity in planktonic foraminifera but reveals unknown hyper-abundant lineages

Raphaël Morard et al. Sci Rep. .

Abstract

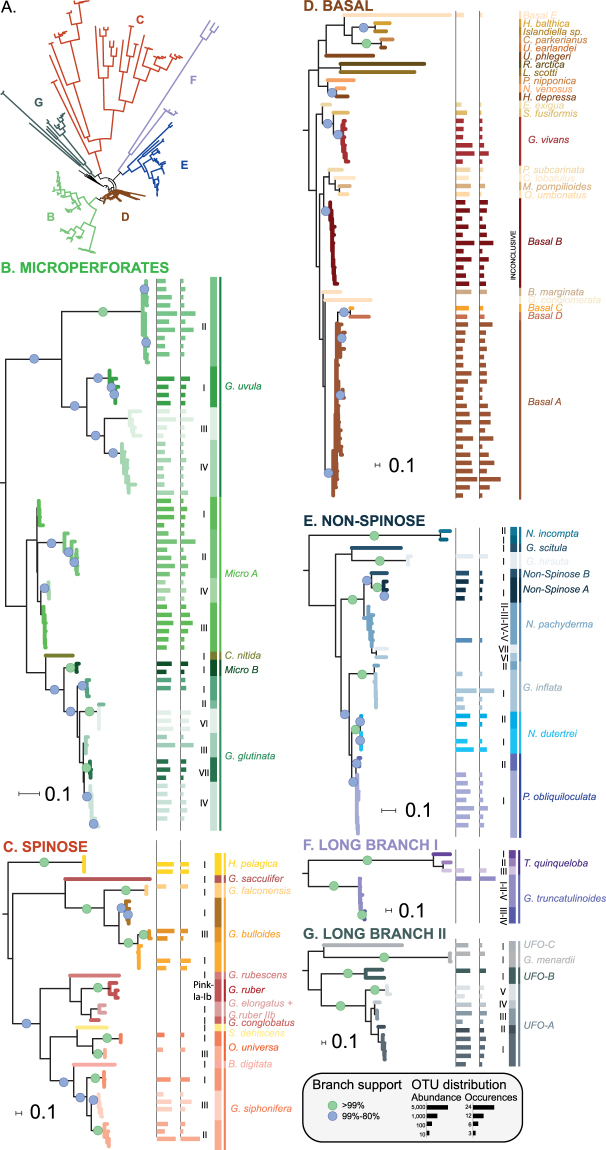
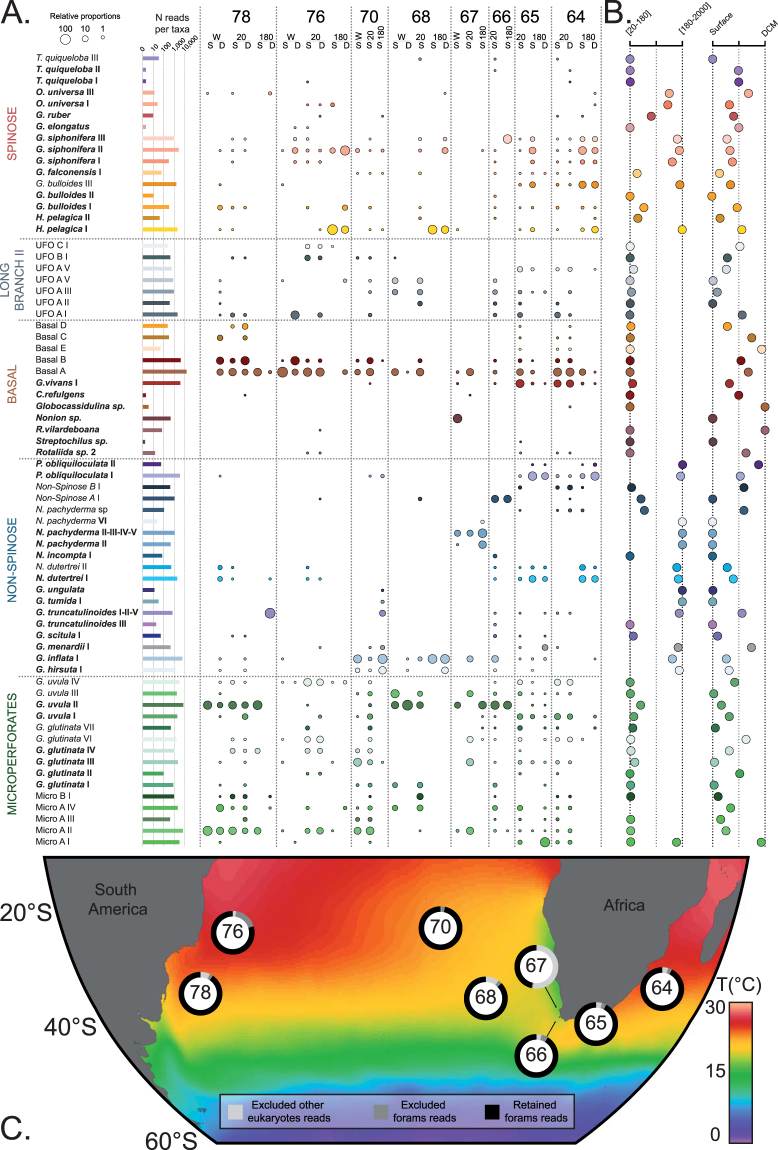
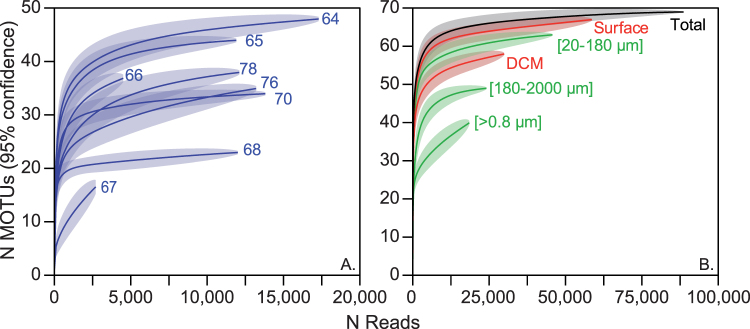
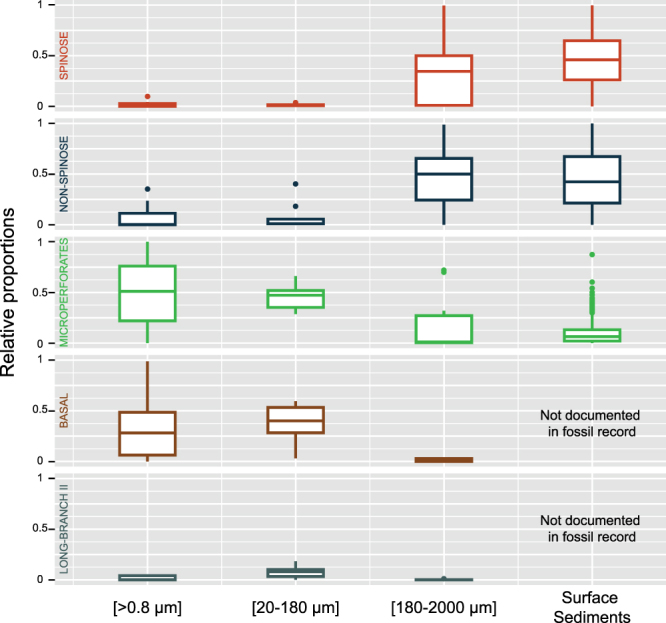
Since the advent of DNA metabarcoding surveys, the planktonic realm is considered a treasure trove of diversity, inhabited by a small number of abundant taxa, and a hugely diverse and taxonomically uncharacterized consortium of rare species. Here we assess if the apparent underestimation of plankton diversity applies universally. We target planktonic foraminifera, a group of protists whose known morphological diversity is limited, taxonomically resolved and linked to ribosomal DNA barcodes. We generated a pyrosequencing dataset of ~100,000 partial 18S rRNA foraminiferal sequences from 32 size fractioned photic-zone plankton samples collected at 8 stations in the Indian and Atlantic Oceans during the Tara Oceans expedition (2009-2012). We identified 69 genetic types belonging to 41 morphotaxa in our metabarcoding dataset. The diversity saturated at local and regional scale as well as in the three size fractions and the two depths sampled indicating that the diversity of foraminifera is modest and finite. The large majority of the newly discovered lineages occur in the small size fraction, neglected by classical taxonomy. These unknown lineages dominate the bulk [>0.8 µm] size fraction, implying that a considerable part of the planktonic foraminifera community biomass has its origin in unknown lineages.


Conflict of interest statement

The authors declare no competing interests.

Figures

Figure 1
Figure 1
(A) Maximum Likelihood phylogenetic inference for planktonic foraminifera environmental and reference sequences. The tree, rooted on Textulariida sequences, includes 81 reference sequences of benthic and planktonic foraminifera, together with 155 representative sequences of each retained environmental MOTUs. The colored branches highlight the position of the major clades in the tree. (BF) Individual clades shown in details. The branch support is highlighted by dots on the branch. The Bar chart on the right panel shows the abundance and occurrence of each MOTU in the dataset (Log scale). The two ranks ABGD species delimitation is provided by the vertical bars at the extreme right of each panel with the associated names next to it. The colors of the branch correspond to the “Genetic type” level delimitation, except for the “basal” clade were only the morphological level is considered.
Figure 2
Figure 2
Ecological dataset. (A) Abundance and occurrence of the 69 planktonic foraminiferal taxa detected in our environmental survey. The lines represent the occurrence of each taxon in all explored Tara Oceans stations, and the columns represent the individual samples. The size of the circles is proportional the relative abundance of each taxon within each sample (log values). 180, 20 and W correspond to the [180–2000 µm], [20–180 µm] and [>0.8 µm] size fractions. D and S correspond to the Deep Chlorophyll Maximum and Surface depths, respectively. (B) Relative occurrences of each taxon between the size fractions [20–180 µm] and [180–2000 µm] and between surface and DCM. (C) Geographic location of the station collections. The ring around the station number shows the partition of the reads obtained at each station. The background shows the mean annual Sea Surface Temperature extracted from the World Ocean Atlas 2013 and was generated with Ocean Data View.
Figure 3
Figure 3
Rarefaction curves of foraminifers based on the ecological dataset (Fig. 2) for the sampling stations (A) and for the organismal size fractions, sampling depth and overall dataset (B).
Figure 4
Figure 4
Relative contribution of the 5 clades in the three size classes and surface sediments (Data extracted from the MARGO database). The box plot were drawn with ggplot2 implemented in R.

References

    1. Mora C, Tittensor DP, Adl S, Simpson AGB, Worm B. How many species are there on Earth and in the ocean? PLoS Biol. 2011;9:e1001127. doi: 10.1371/journal.pbio.1001127. - DOI - PMC - PubMed
    1. Blaxter M. Imagining Sisyphus happy: DNA barcoding and the unnamed majority. Philos. Trans. R. Soc. B Biol. Sci. 2016;371:20150329. doi: 10.1098/rstb.2015.0329. - DOI - PMC - PubMed
    1. Weber AAT, Pawlowski J. Can Abundance of Protists Be Inferred from Sequence Data: A Case Study of Foraminifera. PLoS One. 2013;8:1–8. - PMC - PubMed
    1. Weber AA-T, Pawlowski J. Wide Occurrence of SSU rDNA Intragenomic Polymorphism in Foraminifera and its Implications for Molecular Species Identification. Protist. 2014;165:645–661. doi: 10.1016/j.protis.2014.07.006. - DOI - PubMed
    1. Guillou L, et al. The Protist Ribosomal Reference database (PR2): a catalog of unicellular eukaryote Small Sub-Unit rRNA sequences with curated taxonomy. Nucleic Acids Res. 2013;41:D597–D604. doi: 10.1093/nar/gks1160. - DOI - PMC - PubMed

Publication types

LinkOut - more resources