. 2018 Feb 7;8(1):2541.
doi: 10.1038/s41598-018-20899-9.

Supersaturation-controlled microcrystallization and visualization analysis for serial femtosecond crystallography

Affiliations

Supersaturation-controlled microcrystallization and visualization analysis for serial femtosecond crystallography

Dan Bi Lee et al. Sci Rep. .

Erratum in

Abstract

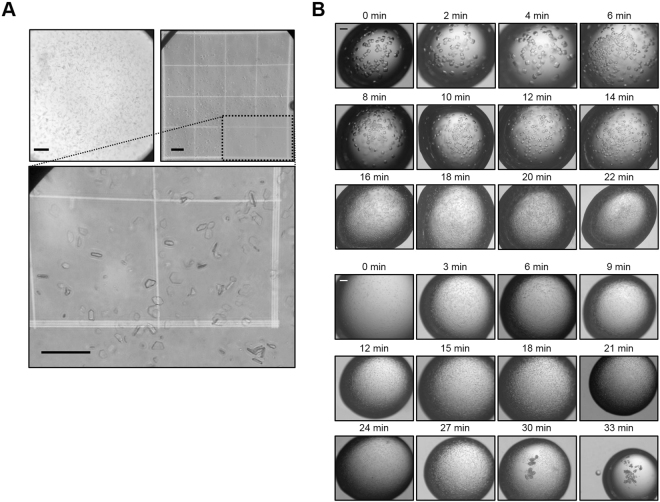
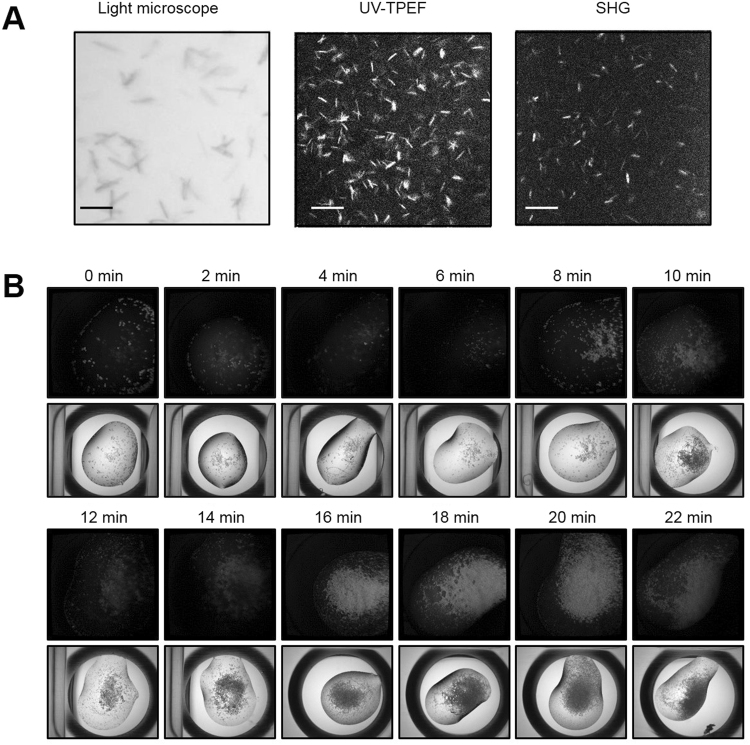
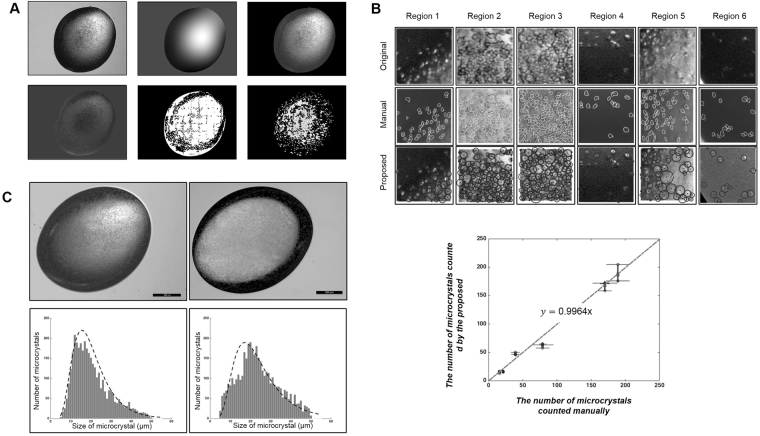
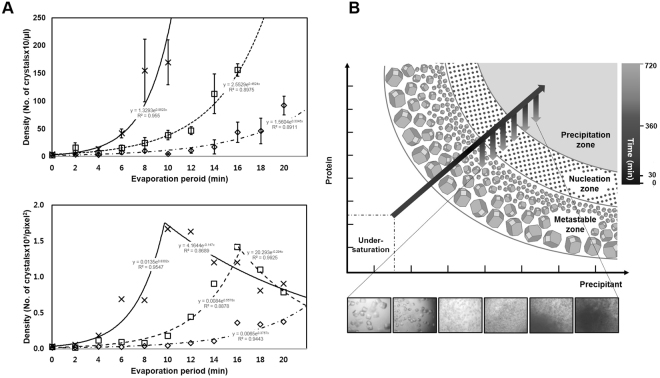
Time-resolved serial femtosecond crystallography with X-ray free electron laser (XFEL) holds the potential to view fast reactions occurring at near-physiological temperature. However, production and characterization of homogeneous micron-sized protein crystals at high density remain a bottleneck, due to the lack of the necessary equipments in ordinary laboratories. We describe here supersaturation-controlled microcrystallization and visualization and analysis tools that can be easily used in any laboratory. The microcrystallization conditions of the influenza virus hemagglutinin were initially obtained with low reproducibility, which was improved by employing a rapid evaporation of hanging drops. Supersaturation-controlled microcrystallization was then developed in a vapor diffusion mode, where supersaturation was induced by evaporation in hanging drops sequentially for durations ranging from 30 sec to 3 min, depending on the protein. It was applied successfully to the microcrystal formation of lysozyme, ferritin and hemagglutinin with high density. Moreover, visualization and analysis tools were developed to characterize the microcrystals observed by light microscopy. The size and density distributions of microcrystals analyzed by the tools were found to be consistent with the results of manual analysis, further validated by high-resolution microscopic analyses. Our supersaturation-controlled microcrystallization and visualization and analysis tools will provide universal access to successful XFEL studies.


Conflict of interest statement

The authors declare that they have no competing interests.

Figures

Figure 1
Figure 1
Microcrystallization. (A) HA microcrystals observed in a vapor diffusion drop by light microscope (upper-left panel), and transferred to hemocytometer (upper-right panel). The Neubauer chamber on the microscope stage of the hemocytometer showed a square ruled into 9 small squares, which were further divided into 16 smaller squares having sides of length 200 and 250 μm. Grid images in the dotted box are magnified in the lower panel. Scale bars: 100 μm. (B) Images of lysozyme (upper panel) and ferritin (lower panel) microcrystals in hanging drops obtained by supersaturation-controlled microcrystallization. Microcrystals were obtained at the highest density between 16 and 20 min for lysozyme and between 15 and 21 min for ferritin.
Figure 2
Figure 2
Characterization of microcrystals. (A) HA crystals detected by light microscopy, UV-TPEF, and SHG (left to right). Scale bars: 50 μm. (B) Lysozyme microcrystals detected by UV-TPEF and light microscopy in the crystallization buffer, 0.1 M sodium acetate (pH 4.8), 18% NaCl, and 6% PEG 400. Supersaturation-controlled microcrystallization was examined by using evaporation times of 0 to 22 min in 2 min delay steps.
Figure 3
Figure 3
Images of protein microcrystallization drops. (A) Microcrystallization images processed by the proposed segmentation method: original drop image obtained by an ordinary light microscope, image bias map, and image after removal of the background (upper panel, left to right). The image after removal of the image bias and filling of the image background with the average of the edges of the bias corrected image, image after application of the localized fuzzy c-mean clustering algorithm, and segmented images were used to analyze the number of microcrystals (lower panel, left to right). The original image size was 2592 × 1944 pixels, and the localized fuzzy c-mean algorithm was applied to a small region of 200 × 200 pixels. (B) Comparison of manual and proposed microcrystal counting methods for selected regions of an image (upper panel): selected regions 1–6 of the original image (top row), manually marked microcrystals in each region (middle row), and microcrystals in each region marked by the proposed method (bottom row). The number of microcrystals counted manually was plotted against that of microcrystals counted by the proposed method (lower panel). The microcrystals were counted by three experts four times and by the proposed method three times. The data represent the means ± SD. (C) Original high-resolution (left) and ordinary light (right) microscopy images (upper panel) and the histogram analysis results of the high-resolution (left) and ordinary light (right) microscopy images (lower panel).
Figure 4
Figure 4
Supersaturation-controlled microcrystallization as a function of evaporation period for microcrystallization of lysozyme. (A) Plots of microcrystal density as a function of evaporation period for microcrystallization of lysozyme. The microcrystal densities were analyzed manually (upper panel) and by the proposed algorithm (lower panel). The lines are for a 1.8 μL drop with time periods from 0 to 22 min. Lysozyme protein concentrations of 55, 65 and 75 mg/mL were used, as shown by dashed dotted, dashed and continuous lines, respectively. The microcrystal densities at each time were calculated manually four times (upper panel) and by the proposed method three times (lower panel). The data represent the means ± SD. (B) Schematic representation of a two-dimensional phase diagram, illustrating estimated paths of microcrystallization, indicated by arrows, mediated by the supersaturation-controlled microcrystallization method. Long diagonal and short vertical arrows represent the changes in concentration for each time delay, resulting in the formation of single crystals, micro- or nanocrystals, and precipitates. The gray-scale in the arrows represents a real-time estimate from 0 to 720 min. The paths lead through different levels of supersaturation to rapidly reach the border between the metastable, nucleation, and precipitation zones.

References

    1. Chapman HN, et al. Femtosecond X-ray protein nanocrystallography. Nature. 2011;470:73–77. doi: 10.1038/nature09750. - DOI - PMC - PubMed
    1. Aquila A, et al. Time-resolved protein nanocrystallography using an X-ray free-electron laser. Opt. Express. 2012;20:2706–2716. doi: 10.1364/OE.20.002706. - DOI - PMC - PubMed
    1. Spence JCH, Weierstall U, Chapman HN. X-ray lasers for structural and dynamic biology. Rep. Prog. Phys. 2012;75:102601. doi: 10.1088/0034-4885/75/10/102601. - DOI - PubMed
    1. Tenboer J, et al. Time-resolved serial crystallography captures high-resolution intermediates of photoactive yellow protein. Science. 2014;346:1242–1246. doi: 10.1126/science.1259357. - DOI - PMC - PubMed
    1. Neutze R, Moffat K. Time-resolved structural studies at synchrotrons and X-ray free electron lasers: opportunities and challenges. Curr. Opin. Struct. Biol. 2012;22:651–659. doi: 10.1016/j.sbi.2012.08.006. - DOI - PMC - PubMed

Publication types

LinkOut - more resources