. 2017 Nov 9;9(1):122-141.
doi: 10.18632/oncotarget.22343. eCollection 2018 Jan 2.

Genetic identification and molecular modeling characterization reveal a novel PROM1 mutation in Stargardt4-like macular dystrophy

Affiliations

Genetic identification and molecular modeling characterization reveal a novel PROM1 mutation in Stargardt4-like macular dystrophy

Saber Imani et al. Oncotarget. .

Abstract

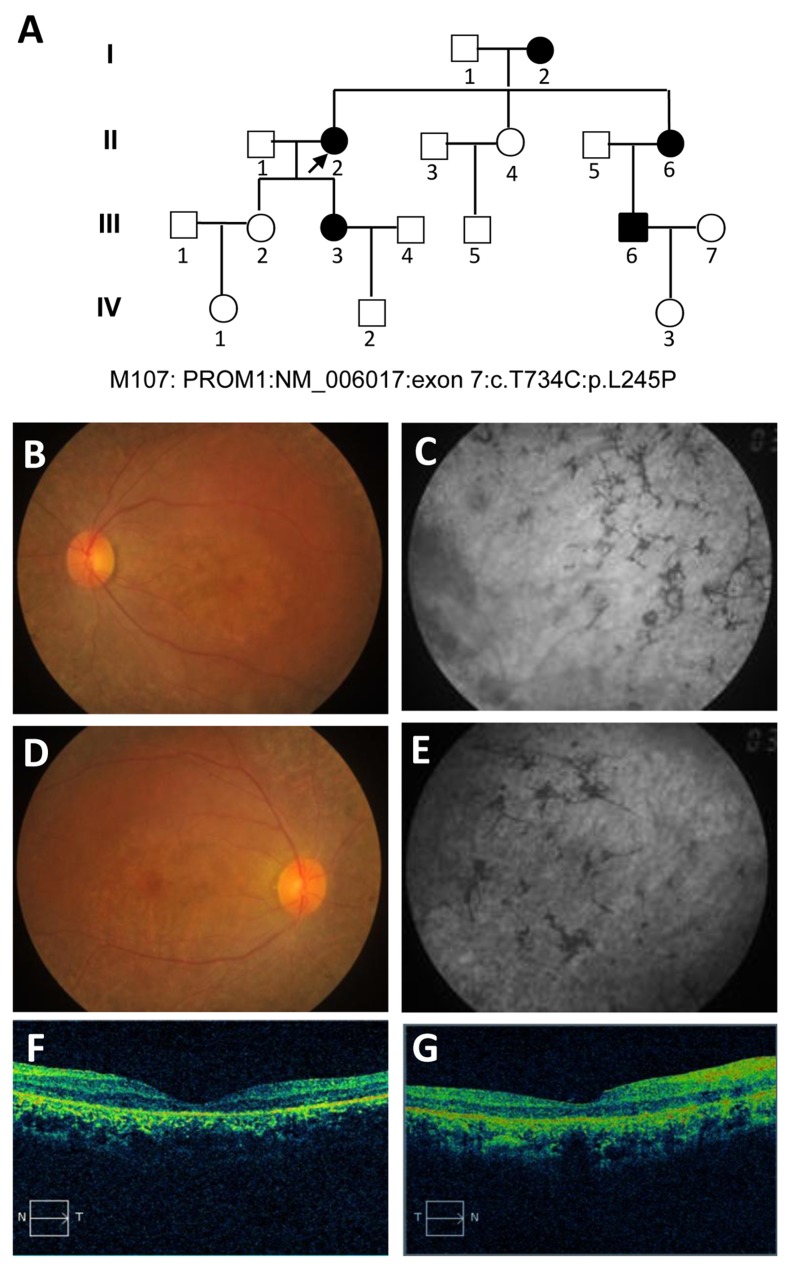
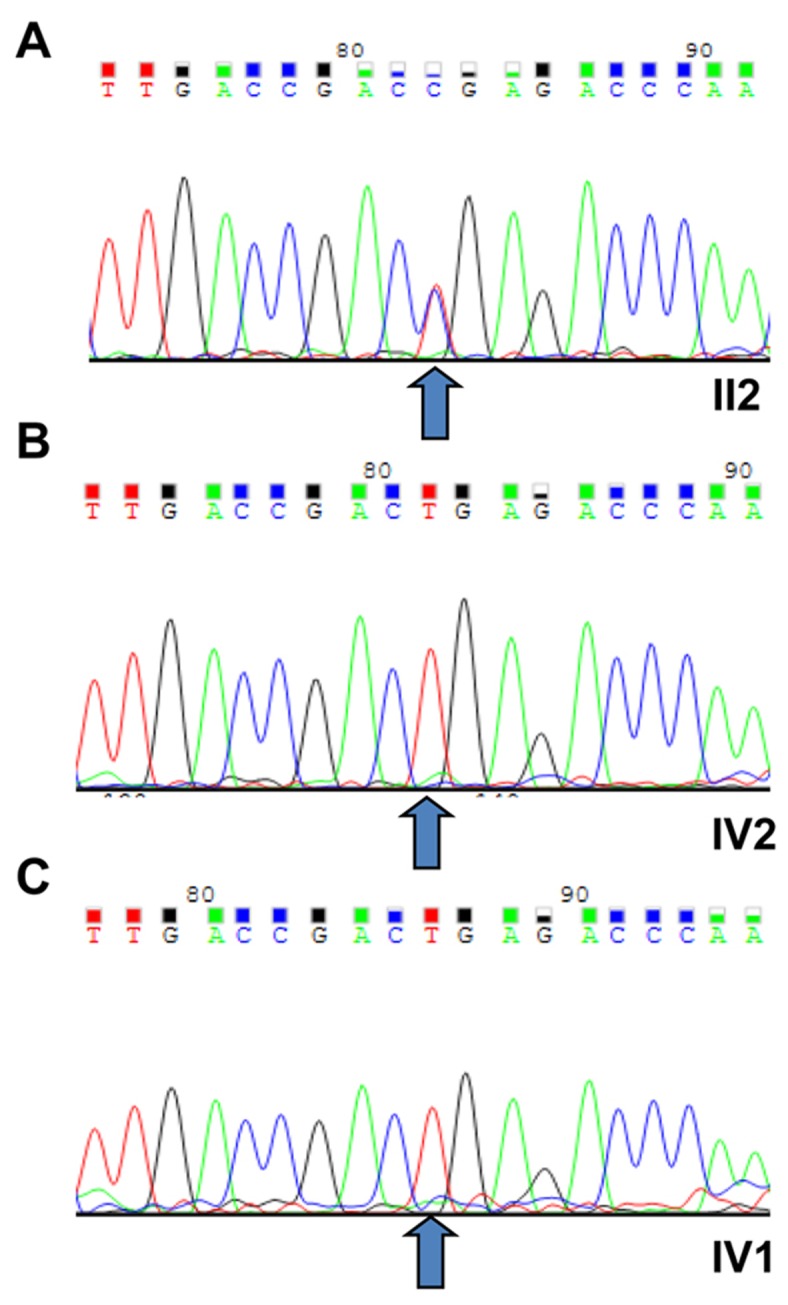
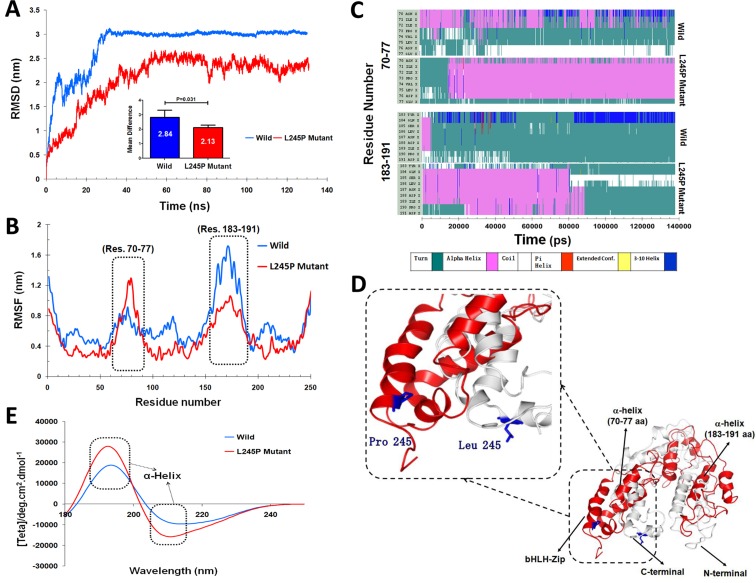
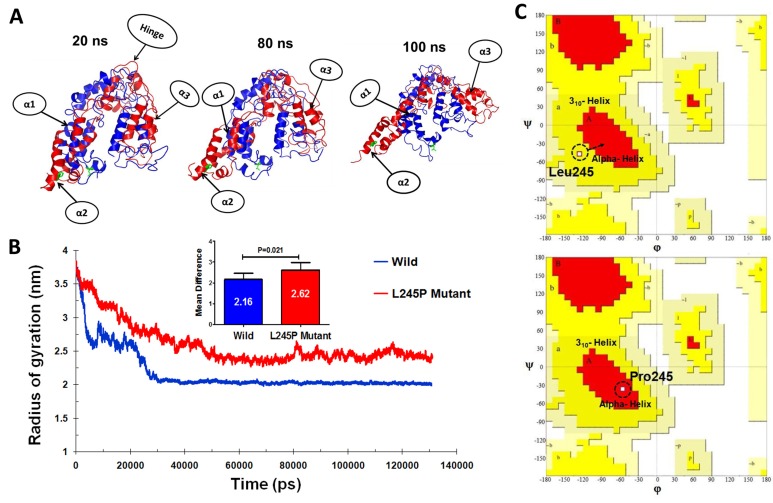
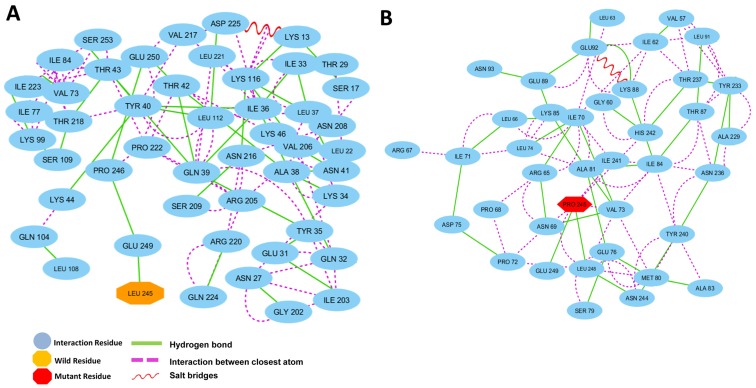
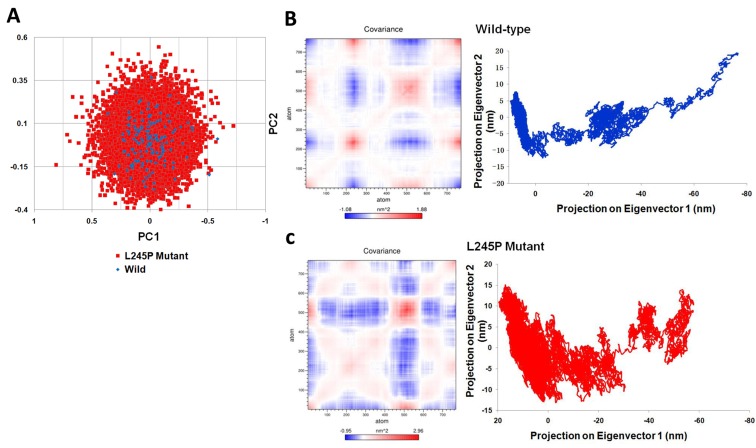
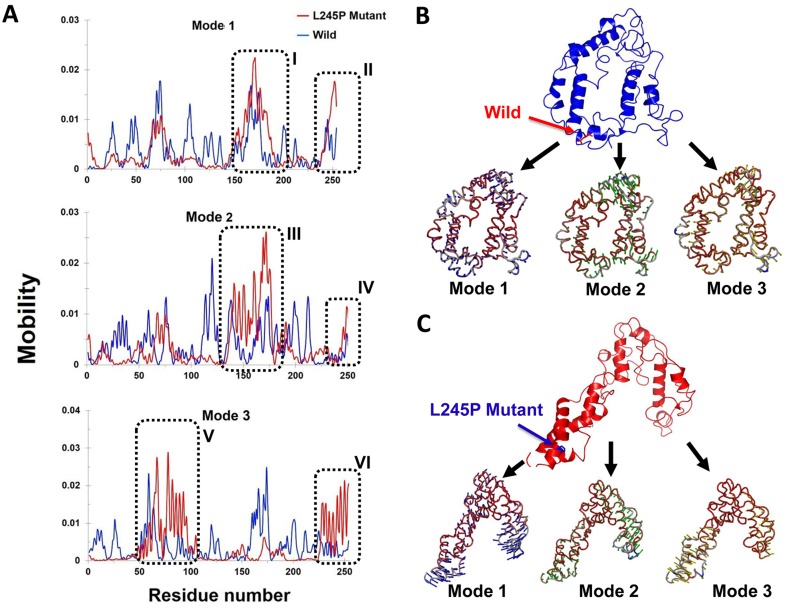
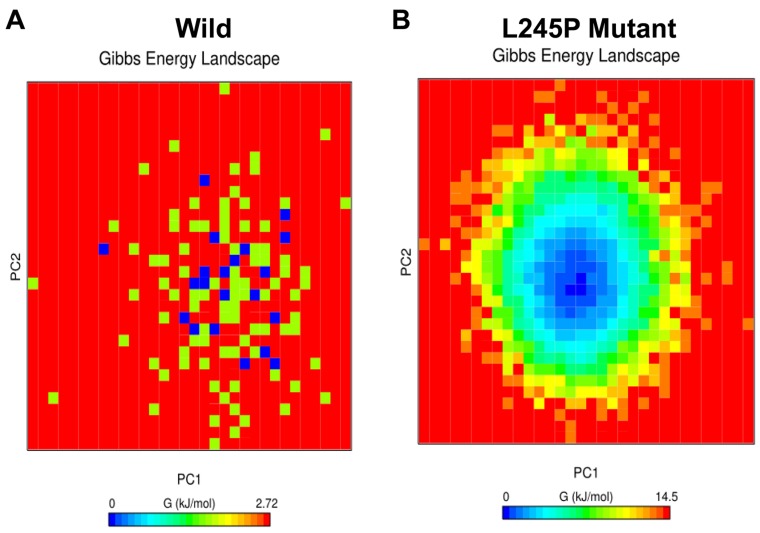
Stargardt disease-4 (STGD4) is an autosomal dominant complex, genetically heterogeneous macular degeneration/dystrophy (MD) disorder. In this paper, we used targeted next generation sequencing and multiple molecular dynamics analyses to identify and characterize a disease-causing genetic variant in four generations of a Chinese family with STGD4-like MD. We found a novel heterozygous missense mutation, c.734T>C (p.L245P) in the PROM1 gene. Structurally, this mutation most likely impairs PROM1 protein stability, flexibility, and amino acid interaction network after changing the amino acid residue Leucine into Proline in the basic helix-loop-helix leucine zipper domain. Molecular dynamic simulation and principal component analysis provide compelling evidence that this PROM1 mutation contributes to disease causativeness or susceptibility variants in patients with STGD4-like MD. Thus, this finding defines new approaches in genetic characterization, accurate diagnosis, and prevention of STGD4-like MD.

Keywords: PROM1; missense mutation; molecular modeling; next generation sequencing; stargardt disease-4 (STGD4).


Conflict of interest statement

CONFLICTS OF INTEREST The authors declare no conflict of interest.

Figures

Figure 1
Figure 1. Pedigree of the M107 family with autosomal dominant Stargardt4-like macular dystrophy and clinical assessment of affected proband
A. Pedigree of the M107 family. Family number and disease-causing mutation (s) are noted at this pedigree. Normal individuals are shown as clear circles (females) and squares (males), affected individuals are shown as filled symbols. The patient above the arrow indicates proband (II: 2) (molecular no.: M107). Individuals with heterozygous mutation are represented in filled symbols. Targeted next generation sequencing individual indicated with arrow. B., D. Fundus photography of the left and right eyes, respectively. C., E. Fundus autofluorescences of left and right eyes, respectively. F., G. OCT characterization of the left and right eyes with conclusive genetic defects, respectively. The macular progressive depigmentation with atrophy and pigment clumping are major complement of proband.
Figure 2
Figure 2. Sequencing results of the (c.T734C:p.L245P) PROM1 mutation
A. The novel heterozygous missense mutation (PROM1: NM_006017: exon7: c.T734C:p.L245P) of PROM1 gene in proband (II:2). B. Sanger sequencing results of IV:2 identified as a wild type. C. The wild type IV:1 was validated in the unaffected family individuals and unrelated normal controls, with the normal male from no eye disease history family (III:1). All number were depicted in Figure 1. The arrows indicate the mutation at the nucleotide position c. 734T > C in the PROM1 gene.
Figure 3
Figure 3. Functional effects of the c.734T > C mutation on the PROM1 protein
A. RMSD plots of the wild-type and the L245P complex systems for 130 ns of simulation, where time step is plotted on X-axis while RMSD (nm) is plotted on Y-axis. B. Difference in average Cα-RMSF of the L245P mutant (red) and the wild type (blue). The maxima differences of residue-level displacements and fluctuations of both systems are shown in the residues numbers 70-77 and 183-191. C. The secondary structure as a function of the simulation time for two model structures. Upper and lower panels indicate secondary structure for the wild-, and -mutant type in the two main functional extracellular domains of PROM1 protein, 70-77 (upper panel) and 183-191 (lower panel) amino-acid residues, respectively. This finding indicates the initial structure of PROM1 in the wild type showing as a turn structure while the L245P mutant converted to an alpha helix during the simulation time (residues number 70-77) (upper panel). Secondary structure analysis in the residues number 183-191 shows this position including a turn conformation at the end of simulation in wild type, whereas the L245P mutant depictes an alpha-helix during 90 ns and all structures finally returned to the initial conformation at the end of simulation times. D. 3D structure from the wild type and the L245P mutant of PROM1 represent in gray and red color, respectively. Substitution of the Leu with Pro changes the α-helical structure of bHLH-Zip domain. The position of the p.L245P mutation is reported in blue color on the both structures. E. Far-UV CD spectra of secondary structure analysis of the wild and the mutant PROM1 during 130 ns-MD simulations. The two minima at 195 and 210 nm indicate an α-helical structure.
Figure 4
Figure 4. Tertiary structural stability of the (c.734T > C) p.L245P mutant PROM1
A. Structural superposition of the wild- (red) and the mutant-type (blue) domains extracted from the trajectories of 20, 80, and 100 ns. The mutation of L245P and the residue Leu245 of wild type are labeled in green color. The helices and hinge indicate with arrows. α1: residues number 70-77, α2: bHLH-Zip domain, and α3: residues number: 183-191. B. Plot of average RG values for each of the systems. RG for L245P mutant and wild type are colored as red and blue, respectively. The chart also shows differential RG values between residues of WT and mutant forms. There is a strong prospect that the L245P mutation influences the structure of the active site of PROM1, possibly by creating a further fold and destabilizing the mentioned domain. C. Comparative diagram depicting Ramchandran plot analysis of PROM1 protein variants in the wild type (upper panel) and the L245P mutant (lower panel) during 130 ns molecular dynamic simulations. Ramachandran plots show the phi (φ)-psi (ψ) torsion angles for the related residue number 245 of PROM1 in this structure. Leu and Pro residues are shown as square (□) and are not restricted to the regions of plots. In the upper panel, before mutation, Leu245 located in the 310 helix region, whereas mutated residue (L245P) transferred to the alpha helix parts of plot in the lower panel during the simulation time.
Figure 5
Figure 5. Residue interaction networks
A. RINs of the active functional extracellular domain residues of PROM1 position in the wild type and B. the L245P mutant forms. Wild type reported on H-bond with Glu249 and no closely atomic interaction with the surrounding residues. L245P mutant form shows two H-bond interaction with Leu248, Glu249, and several closer atomic interactions generated through Pro245 with Ile241, His242, Asn69, Val73, and Leu248. The more interactions between the L245P mutant and neighboring residues could be destabilized at the bHLH-Zip domain in 130 ns.
Figure 6
Figure 6. Dynamical effects of the p. L245P mutation on the PROM1 protein
A.. PCA scatter plots along the pair of first two principal components, PC1 and PC2 for the wild-type and the L245P mutant showing differences between both types of eigenvectors. This represents optimal two-dimensional projections of the data over the 130 ns molecular dynamic trajectories. B. Cross correlation matrix C-alpha atomic graph and plot in during 130 ns simulation for the wild and C. the mutant systems. The range of motion is indicated by various colors in the panel. Red indicates positive correlation, whereas blue indicates anti-correlation. Totally, the L245P mutant effected a partial folding of the mutant protein region have the mostly anti-correlated motion; which is primarily involved in the interaction with other domains. These molecular changes were clearly depicted in the atomic density of distribution plot. There was a significant change in density distribution in native compared to the mutant. Moreover the mutant structure (L245P) shows highest atomic density distribution relative to the wild structure.
Figure 7
Figure 7. Mobility effects of the p. L245P mutation on the PROM1 protein
A. Residue based mobility plots of the wild and mutant showing mobility at different residues across different modes. B. Porcupine plots in the three different modes of the wild type (blue) PROM1 protein. This graph shows the number of residues 70-77 and 183-191 playing significant roles in the secondary structure modifications of the mutant form. C. Motion in the three different modes of the L245P mutant PROM1 protein. Arrows in blue, green, and red indicate motions along mode 1, 2, and 3 respectively. These figures clearly show that the L245P mutation affected the overall conformational fluctuation of the system. Our results indicate the most motions in mode 1 located in residues number 183-191 I. and 250-255 (II) (mode 1), 120-180 (III) and 250-255 (IV) (mode 2), as well as 50-100 (V) and 230-255 (VI) (mode 3).
Figure 8
Figure 8. Free energy landscape (FEL)
Projections of FEL of the wild A. and the L245P mutant PROM1 B. conformational space onto PC1 and PC2 produced from PCA. The dark blue indicates the lowest energy configuration and red shows the highest energy configuration. These energy levels induce the instability in the general structure of mutated protein. This observation is consistent with the PCA scatter and the porcupine plot.

References

    1. Allikmets R, Singh N, Sun H, Shroyer NF, Hutchinson A, Chidambaram A, Gerrard B, Baird L, Stauffer D, Peiffer A, Rattner A, Smallwood P, Li Y, et al. A photoreceptor cell-specific ATP-binding transporter gene (ABCR) is mutated in recessive Stargardt macular dystrophy. Nat Genet. 1997;15:236–46. - PubMed
    1. Maugeri A, Meire F, Hoyng CB, Vink C, Van Regemorter N, Karan G, Yang Z, Cremers FP, Zhang K. A novel mutation in the ELOVL4 gene causes autosomal dominant Stargardt-like macular dystrophy. Invest Ophthalmol Vis Sci. 2004;45:4263–7. - PubMed
    1. Fritsche LG, Fleckenstein M, Fiebig BS, Schmitz-Valckenberg S, Bindewald-Wittich A, Keilhauer CN, Renner AB, Mackensen F, Mossner A, Pauleikhoff D, Adrion C, Mansmann U, Scholl HP, et al. A subgroup of age-related macular degeneration is associated with mono-allelic sequence variants in the ABCA4 gene. Invest Ophthalmol Vis Sci. 2012;53:2112–8. - PubMed
    1. Sun H, Nathans J. ABCR: rod photoreceptor-specific ABC transporter responsible for Stargardt disease. Methods Enzymol. 2000;315:879–97. - PubMed
    1. Cideciyan AV, Swider M, Aleman TS, Sumaroka A, Schwartz SB, Roman MI, Milam AH, Bennett J, Stone EM, Jacobson SG. ABCA4-associated retinal degenerations spare structure and function of the human parapapillary retina. Invest Ophthalmol Vis Sci. 2005;46:4739–46. - PMC - PubMed