. 2017 Dec 5;9(1):249-267.
doi: 10.18632/oncotarget.22922. eCollection 2018 Jan 2.

Three-dimensional tumor model mimics stromal - breast cancer cells signaling

Affiliations

Three-dimensional tumor model mimics stromal - breast cancer cells signaling

Stephanie Lemmo Ham et al. Oncotarget. .

Abstract

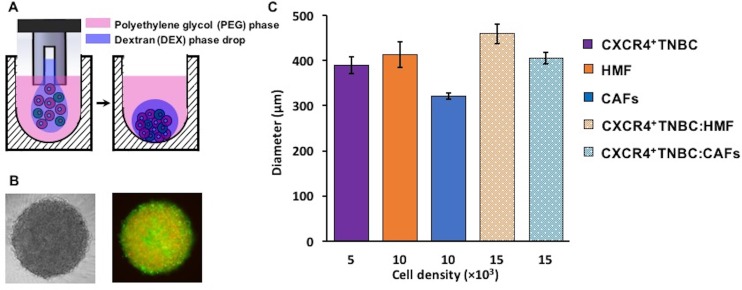
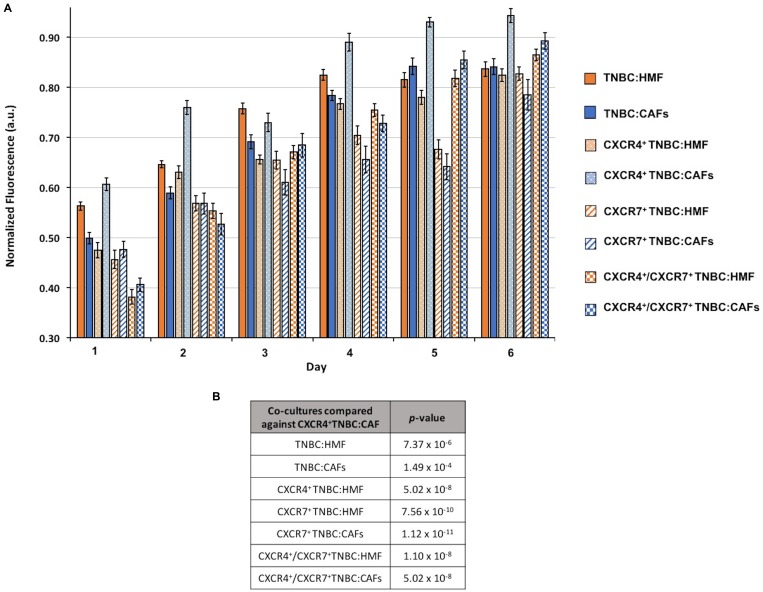
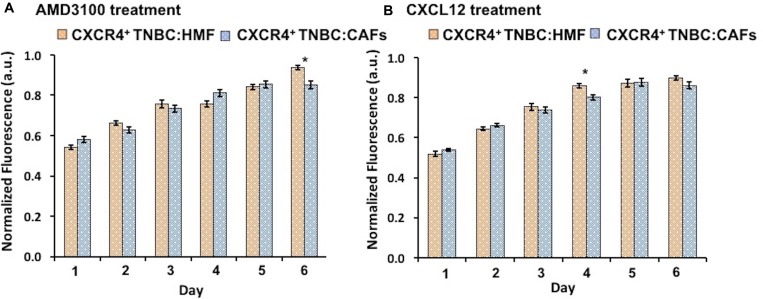
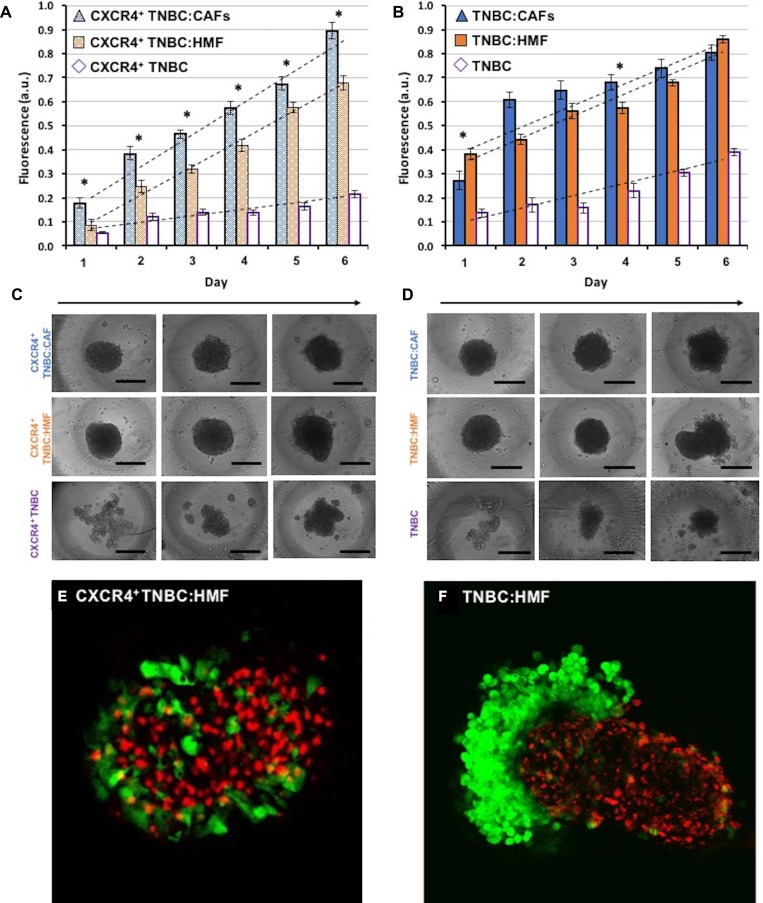
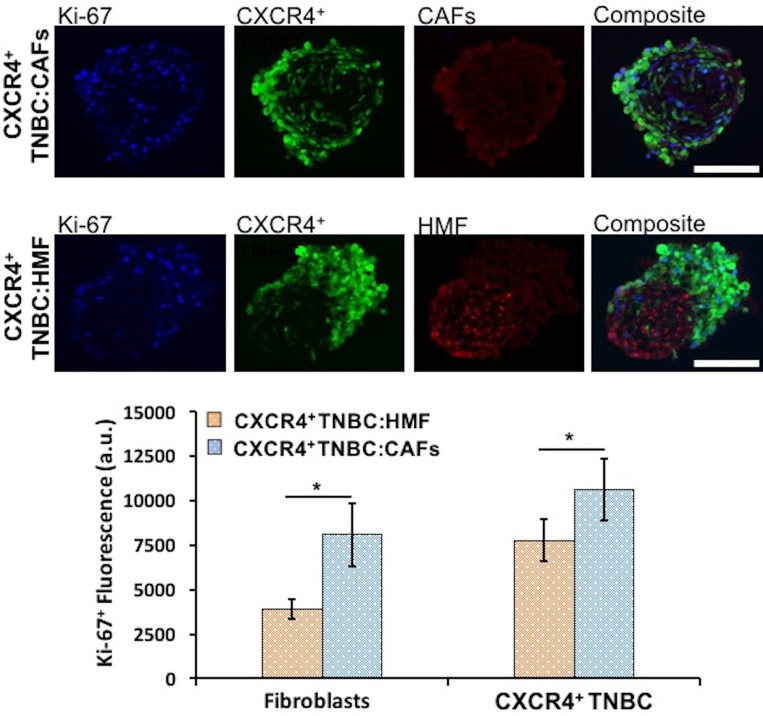
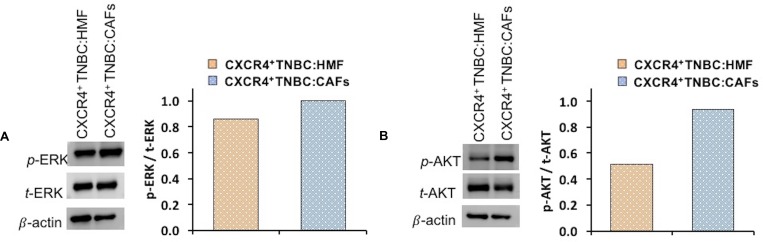
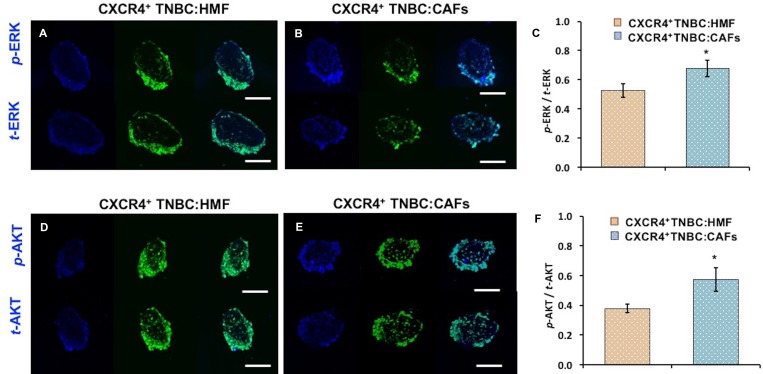
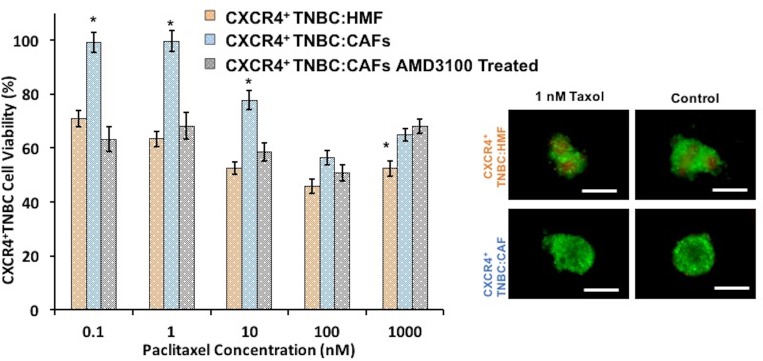
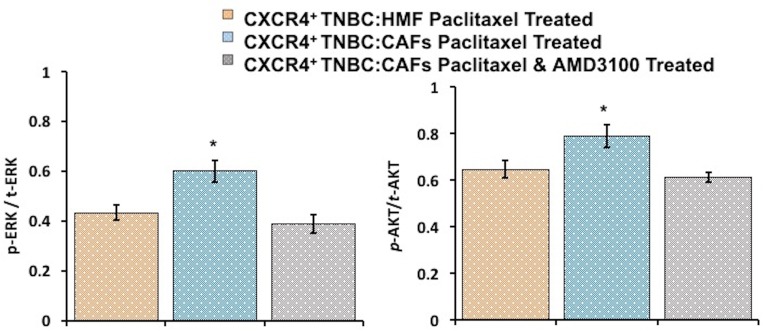
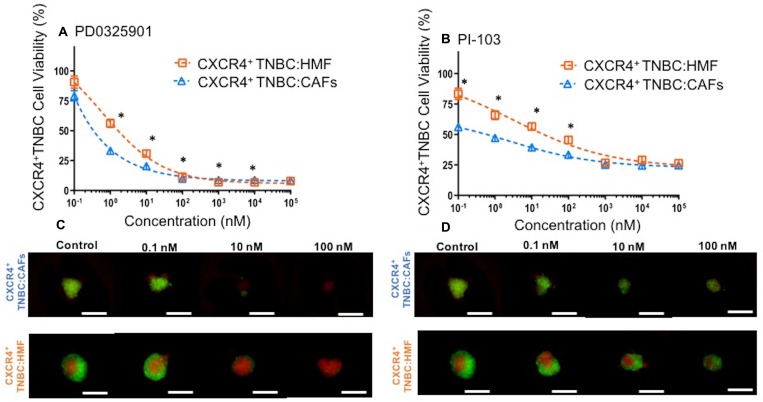
Tumor stroma is a major contributor to the biological aggressiveness of cancer cells. Cancer cells induce activation of normal fibroblasts to carcinoma-associated fibroblasts (CAFs), which promote survival, proliferation, metastasis, and drug resistance of cancer cells. A better understanding of these interactions could lead to new, targeted therapies for cancers with limited treatment options, such as triple negative breast cancer (TNBC). To overcome limitations of standard monolayer cell cultures and xenograft models that lack tumor complexity and/or human stroma, we have developed a high throughput tumor spheroid technology utilizing a polymeric aqueous two-phase system to conveniently model interactions of CAFs and TNBC cells and quantify effects on signaling and drug resistance of cancer cells. We focused on signaling by chemokine CXCL12, a hallmark molecule secreted by CAFs, and receptor CXCR4, a driver of tumor progression and metastasis in TNBC. Using three-dimensional stromal-TNBC cells cultures, we demonstrate that CXCL12 - CXCR4 signaling significantly increases growth of TNBC cells and drug resistance through activation of mitogen-activated protein kinase (MAPK) and phosphoinositide 3-kinase (PI3K) pathways. Despite resistance to standard chemotherapy, upregulation of MAPK and PI3K signaling sensitizes TNBC cells in co-culture spheroids to specific inhibitors of these kinase pathways. Furthermore, disrupting CXCL12 - CXCR4 signaling diminishes drug resistance of TNBC cells in co-culture spheroid models. This work illustrates the capability to identify mechanisms of drug resistance and overcome them using our engineered model of tumor-stromal interactions.

Keywords: CXCL12; CXCR4; TNBC; three-dimensional culture; tumor-stromal signaling.


Conflict of interest statement

CONFLICTS OF INTEREST Authors declare no conflict of interest.

Figures

Figure 1
Figure 1
(A–B) Cancer cells remain confined in the 0.3 µl DEX phase drop (purple) suspended in the immiscible immersion PEG phase (pink) and autonomously aggregate to form a co-culture spheroid of triple negative breast cancer cells (green) and human mammary fibroblasts (red) in 48 hrs. Colors in panel (A) are for presentation purpose only. (C) Resulting spheroids of different co-culture models are consistently sized with low standard errors.
Figure 2
Figure 2
(A) Growth of co-culture spheroids based on metabolic activity measurements is shown over a six-day period. Spheroids consist of 1.5 × 10⁴ cells at a ratio of 1:2 TNBC:fibroblasts at the starting point of experiments. (B) p-values from a statistical test show that the CXCR4+TNBC:CAFs co-culture model is consistently and significantly more proliferative than all the other models.
Figure 3
Figure 3
(A) Treatment of CXCR4+TNBC:CAFs co-culture spheroids with AMD3100 (CXCR4 antagonist) normalizes proliferation to level of the CXCR4+TNBC:HMF co-culture. (B) Treating CXCR4+TNBC:HMF co-culture spheroids with CXCL12-containing conditioned medium from CAFs stimulates proliferation to that of CXCR4+TNBC:CAF co-culture spheroids.
Figure 4
Figure 4. Proliferation of TNBC cells in co-culture spheroids measured using their endogenous eGFP signal
(A) TNBC cells in the CXCR4+TNBC:CAFs model display consistently greater proliferation compared to spheroids of CXCR4+TNBC:HMF co-culture model and CXCR4+TNBC single culture with a larger slope of 11.4% and 77.1%, respectively. (B) TNBC cells lacking CXCR4 expression in co-culture with HMF and CAFs show a similar proliferation. (C–D) Morphology of resulting co-culture spheroids and mono-culture spheroids of breast cancer cells on days 1, 3, and 6 (left to right). Error bars represent standard error of mean. (E–F) Confocal images of the co-culture spheroids containing HMF cells on day 4. Scale bar is 200 µm. *p < 0.05.
Figure 5
Figure 5
Proliferation of CXCR4+TNBC cells and fibroblasts (HMF and CAFs) in co-culture spheroids characterized through measurements of Ki-67+ proliferative cells using immunostained images of cryosections of 4-day old spheroids. Both cancer cells and fibroblasts show significantly greater proliferation in the CXCR4+TNBC:CAFs co-culture model (blue bars). Scale bar is 200 µm. *p < 0.05.
Figure 6
Figure 6
Western blot analysis of signaling proteins (A) p-ERK and (B) p-AKT in co-cultures of CXCR4+TNBC cells with HMF and CAFs. Quantified data were normalized to β-actin protein expression.
Figure 7
Figure 7
Cryosections of co-culture spheroids of CXCR4+TNBC cells (green) with HMF and CAFs immunostained for (A–B) ERK and (D–E) AKT. A blue fluorescent secondary antibody was used to detect ERK and AKT. Images represent spheroids on day 4 of culture. Quantification showed higher (C) ERK and (F) AKT phosphorylation in the CXCR4+TNBC cells when co-cultured with CAFs. Scale bar is 200 µm. *p < 0.05.
Figure 8
Figure 8
CXCR4+TNBC:CAFs co-culture spheroids (blue bars) display resistance to paclitaxel treatment but lose resistance to the drug when co-treated with a CXCR4 receptor antagonist AMD3100 (gray bars), similar to the negative control counterpart (CXCR4+TNBC:HMF, orange bars). Images reflect spheroids at the end of drug treatment period (6 days). Scale bar is 200 µm. *p < 0.01.
Figure 9
Figure 9
Immunohistochemical analysis of drug-treated spheroids indicates that increases in AKT and ERK phosphorylation levels in CXCR4+TNBC:CAF co-culture spheroids contribute to paclitaxel resistance (blue bars). Co-treatment with a CXCR4 receptor antagonist, AMD3100, lowers AKT and ERK activities (gray bars) to that observed in the paclitaxel sensitive control culture (CXCR4+TNBC:HMF, orange bars). *p < 0.05.
Figure 10
Figure 10
Viability of CXCR4+TNBC cells in co-culture with HMF and CAFs treated with a MEK inhibitor, (A) PD0325901, and a PI3K inhibitor, (B) PI-103, measured using the endogenous eGFP signal of the TNBC cells. CXCR4+TNBC cells in co-culture with CAFs show greater drug sensitivity to the molecular inhibitors. Images reflect spheroids at end of drug treatment period (5 days). Error bars represent standard error of mean. Scale bar is 200 µm. *p < 0.05.

Similar articles

Cited by

References

    1. Bhowmick NA, Neilson EG, Moses HL. Stromal fibroblasts in cancer initiation and progression. Nature. 2004;432:332–7. - PMC - PubMed
    1. Hanahan D, Weinberg RA. Hallmarks of Cancer: The Next Generation. Cell. 2011;144:646–74. - PubMed
    1. Balkwill FR, Capasso M, Hagemann T. The tumor microenvironment at a glance. J Cell Sci. 2012;125:5591–6. - PubMed
    1. Shekhar MP, Pauley R, Heppner G. Extracellular matrix – stromal cell contribution to neoplastic phenotype of epithelial cells in the breast. Breast Cancer Res. 2003;5 - PMC - PubMed
    1. de Kruijf EM, van Nes JG, van de Velde CJ, Putter H, Smit VT, Liefers GJ, Kuppen PJ, Tollenaar RA, Mesker WE. Tumor–stroma ratio in the primary tumor is a prognostic factor in early breast cancer patients, especially in triple-negative carcinoma patients. Breast Cancer Res Treat. 2011;125:687–96. - PubMed

LinkOut - more resources