

Prognostic significance of E-cadherin and ZEB1 expression in intraductal papillary mucinous neoplasm
- PMID: 29416615
- PMCID: PMC5787467
- DOI: 10.18632/oncotarget.23012
Prognostic significance of E-cadherin and ZEB1 expression in intraductal papillary mucinous neoplasm
Abstract
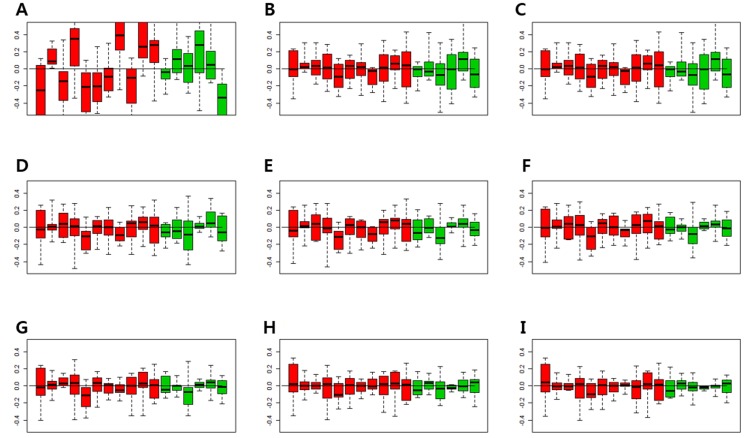
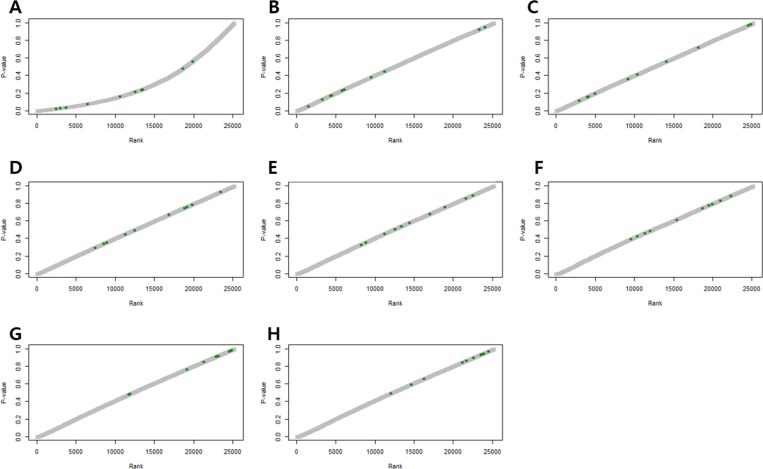
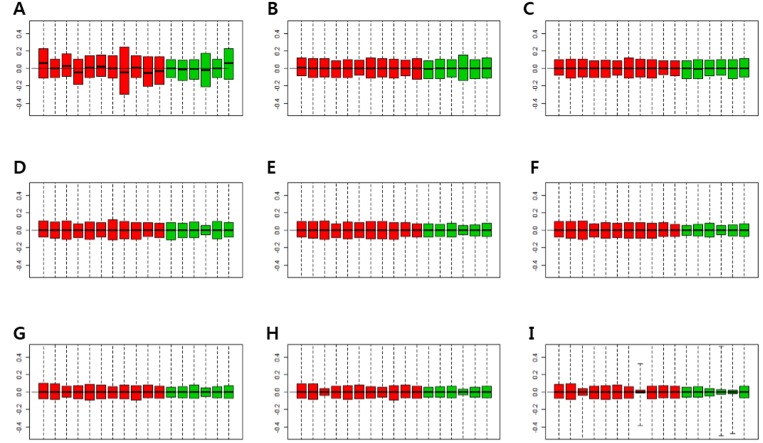
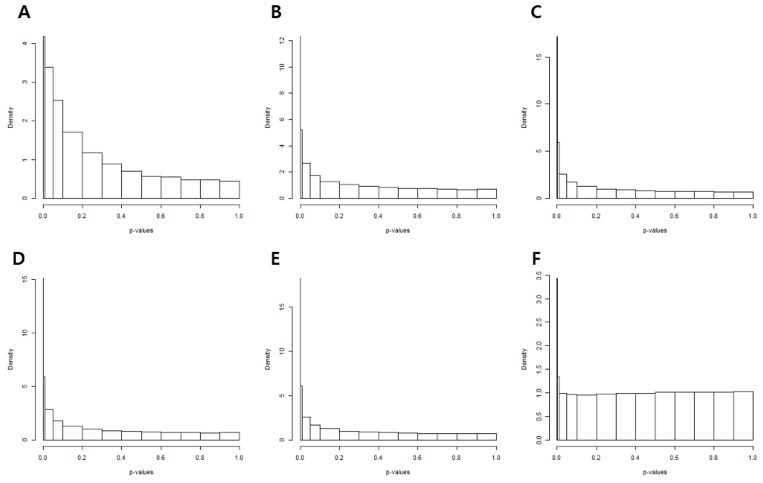
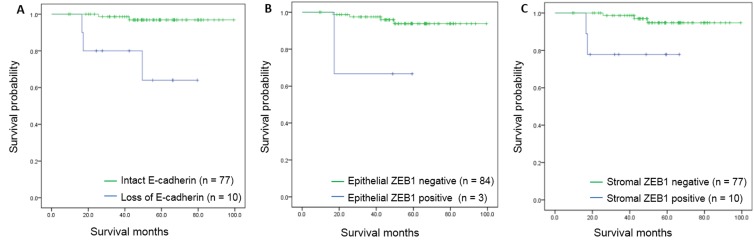
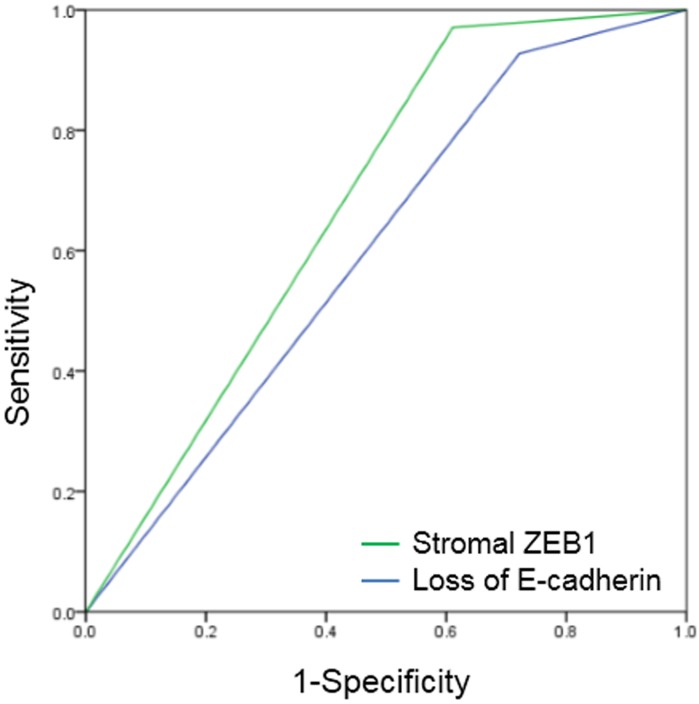
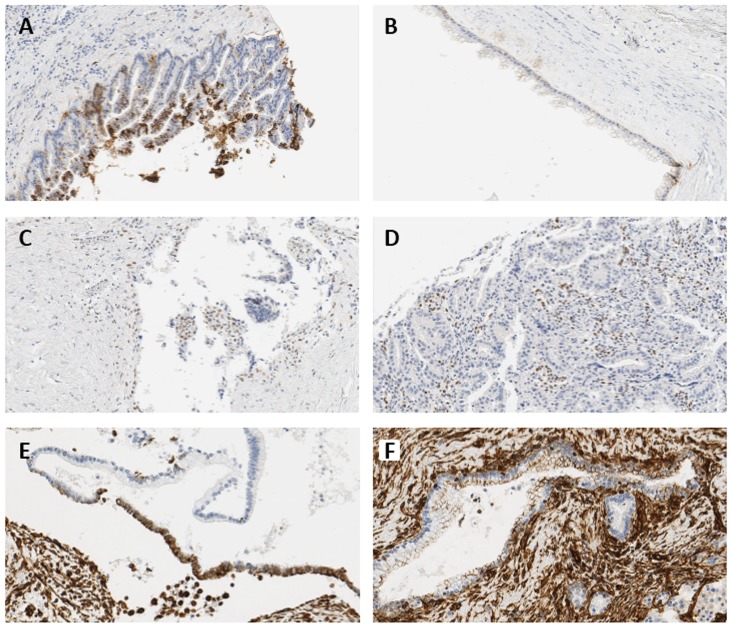
There is an urgent need to investigate the genetic changes that occur in intraductal papillary mucinous neoplasm (IPMN), which is a well-known precursor of pancreatic cancer. In this study, gene expression profiling was performed by removing unwanted variation to determine the differentially expressed genes (DEGs) associated with malignant progression of IPMN. Among the identified DEGs, zinc finger E-box binding homeobox 1 (ZEB1) and E-cadherin, a crucial regulator of epithelial-to-mesenchymal transition (EMT), was validated among identified DEGs. A total of 76 fresh-frozen tissues were used for gene expression profiling and formalin-fixed, paraffin-embedded blocks from 87 patients were obtained for immunohistochemical analysis. Loss of E-cadherin expression (p = 0.023, odd ratio [OR] = 4.923) and expression of ZEB1 in stromal cells (stromal ZEB1, p < 0.001, OR = 26.800) were significantly correlated with degree of dysplasia. The hazard of death was significantly increased in patients with loss of E-cadherin expression (hazard ratio [HR] = 13.718, p = 0.004), expression of epithelial ZEB1 (HR = 19.117, p = 0.001), and stromal ZEB1 (HR = 6.373, p = 0.043). Based on the results of this study, loss of E-cadherin and expression of stromal ZEB1 are associated with increased risk of malignant progression. Epithelial and stromal ZEB1, as well as E-cadherin may be strong predictors of survival in patients with IPMN. Our finding suggests that these EMT markers may be utilized as potential prognosticators and may be used to improve and personalize treatment of IPMN.
Keywords: ZEB1; biomarker; differentially expressed gene; epithelial-to-mesenchymal transition; intraductal papillary mucinous neoplasm.
Conflict of interest statement
CONFLICTS OF INTEREST The authors declare no conflicts of interest.
Figures
Similar articles
-
Epithelial-to-mesenchymal transition (EMT) in intraductal papillary mucinous neoplasm (IPMN) is associated with high tumor grade and adverse outcomes.Ann Surg Oncol. 2014 Dec;21 Suppl 4:S750-7. doi: 10.1245/s10434-014-3946-5. Epub 2014 Jul 29. Ann Surg Oncol. 2014. PMID: 25069861
-
Prognostic significance of Zinc finger E-box binding homeobox 1 (ZEB1) expression in cancer cells and cancer-associated fibroblasts in pancreatic head cancer.Surgery. 2014 Jul;156(1):97-108. doi: 10.1016/j.surg.2014.02.018. Epub 2014 Feb 28. Surgery. 2014. PMID: 24929761
-
Expression of epithelial-mesenchymal transition-related markers in triple-negative breast cancer: ZEB1 as a potential biomarker for poor clinical outcome.Hum Pathol. 2015 Sep;46(9):1267-74. doi: 10.1016/j.humpath.2015.05.010. Epub 2015 May 30. Hum Pathol. 2015. PMID: 26170011
-
ZEB1 promotes the progression and metastasis of cervical squamous cell carcinoma via the promotion of epithelial-mesenchymal transition.Int J Clin Exp Pathol. 2015 Sep 1;8(9):11258-67. eCollection 2015. Int J Clin Exp Pathol. 2015. PMID: 26617850 Free PMC article.
-
Clinical significance of epithelial-mesenchymal transition markers in prostate cancer.Hum Pathol. 2017 Mar;61:26-32. doi: 10.1016/j.humpath.2016.10.013. Epub 2016 Nov 4. Hum Pathol. 2017. PMID: 27818287
Cited by
-
Extracellular Vesicle Analysis Allows for Identification of Invasive IPMN.Gastroenterology. 2021 Mar;160(4):1345-1358.e11. doi: 10.1053/j.gastro.2020.11.046. Epub 2020 Dec 7. Gastroenterology. 2021. PMID: 33301777 Free PMC article.
-
Prognostic and Clinicopathological Significance of E-Cadherin in Pancreatic Cancer Patients: A Meta-Analysis.Front Oncol. 2021 Apr 12;11:627116. doi: 10.3389/fonc.2021.627116. eCollection 2021. Front Oncol. 2021. PMID: 33912451 Free PMC article.
References
-
- Chang YR, Park JK, Jang JY, Kwon W, Yoon JH, Kim SW. Incidental pancreatic cystic neoplasms in an asymptomatic healthy population of 21,745 individuals: Large-scale, single-center cohort study. Medicine (Baltimore) 2016;95:e5535. https://doi.org/10.1097/MD.0000000000005535. - DOI - PMC - PubMed
-
- Longnecker DS, Adsay NV, Fernandez-del Castillo C, Hruban RH, Kasugai T, Klimstra DS, Kloppel G, Luttges J, Memoli VA, Tosteson TD, Yanagisawa A, Wilentz R, Zamboni G. Histopathological diagnosis of pancreatic intraepithelial neoplasia and intraductal papillary-mucinous neoplasms: interobserver agreement. Pancreas. 2005;31:344–9. - PubMed
-
- Tanaka M, Chari S, Adsay V, Fernandez-del Castillo C, Falconi M, Shimizu M, Yamaguchi K, Yamao K, Matsuno S, International Association of P International consensus guidelines for management of intraductal papillary mucinous neoplasms and mucinous cystic neoplasms of the pancreas. Pancreatology. 2006;6:17–32. https://doi.org/10.1159/000090023. - DOI - PubMed
-
- Sato N, Fukushima N, Maitra A, Iacobuzio-Donahue CA, van Heek NT, Cameron JL, Yeo CJ, Hruban RH, Goggins M. Gene Expression Profiling Identifies Genes Associated with Invasive Intraductal Papillary Mucinous Neoplasms of the Pancreas. The American Journal of Pathology. 2004;164:903–14. https://doi.org/10.1016/s0002-9440(10)63178-1. - DOI - PMC - PubMed
-
- Kuboki Y, Shimizu K, Hatori T, Yamamoto M, Shibata N, Shiratori K, Furukawa T. Molecular biomarkers for progression of intraductal papillary mucinous neoplasm of the pancreas. Pancreas. 2015;44:227–35. https://doi.org/10.1097/MPA.0000000000000253. - DOI - PubMed
LinkOut - more resources
Full Text Sources
Other Literature Sources
Research Materials
