. 2017 Dec 11;9(1):995-1011.
doi: 10.18632/oncotarget.23171. eCollection 2018 Jan 2.

Mitochondrial dysfunction activates lysosomal-dependent mitophagy selectively in cancer cells

Affiliations

Mitochondrial dysfunction activates lysosomal-dependent mitophagy selectively in cancer cells

Thomas G Biel et al. Oncotarget. .

Abstract

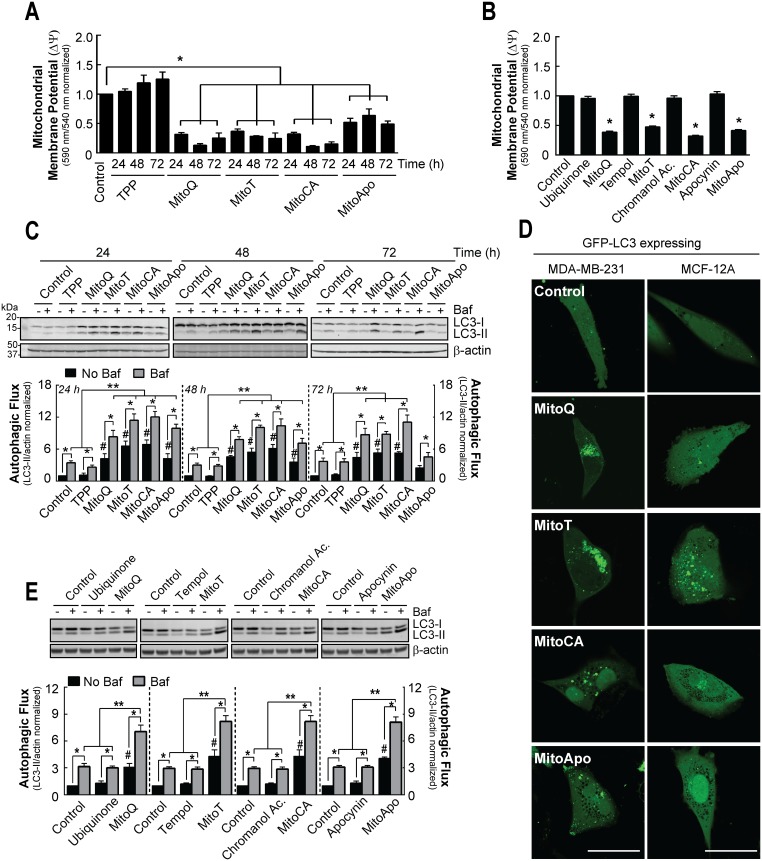
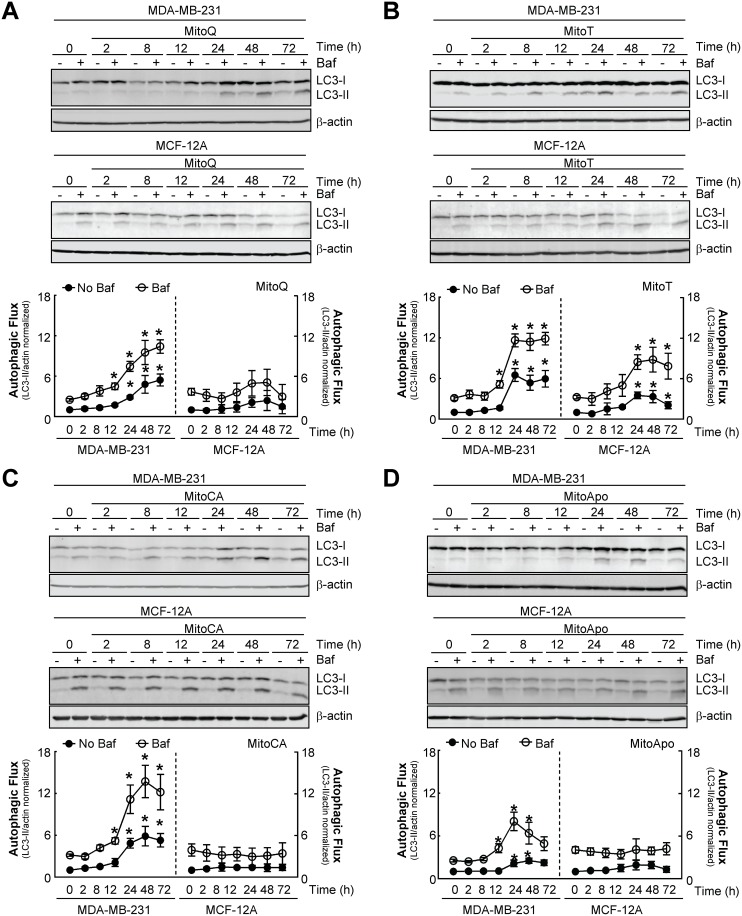
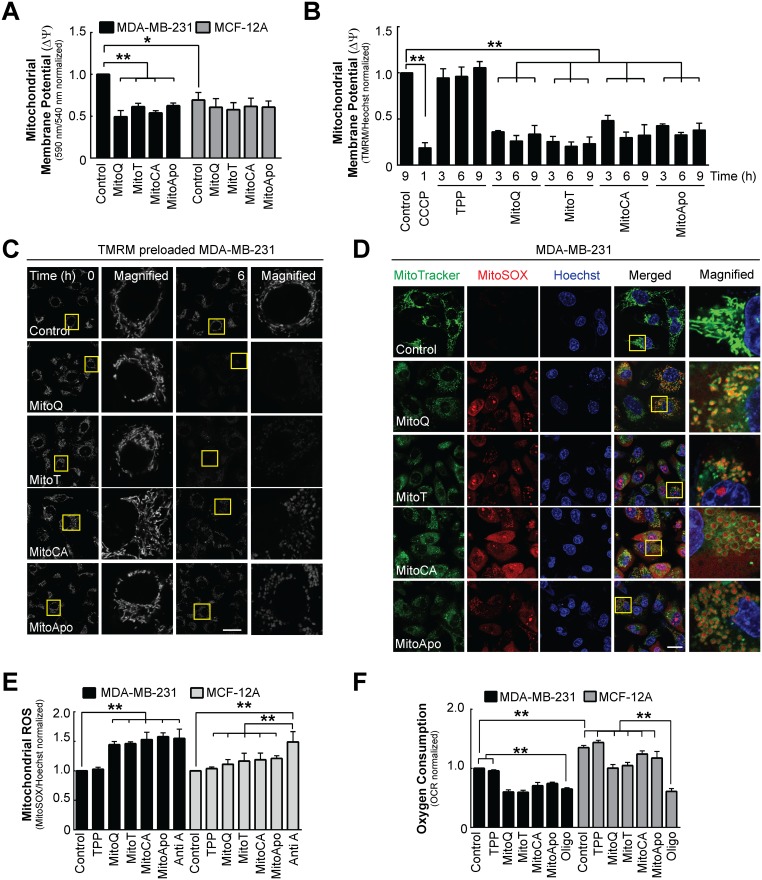
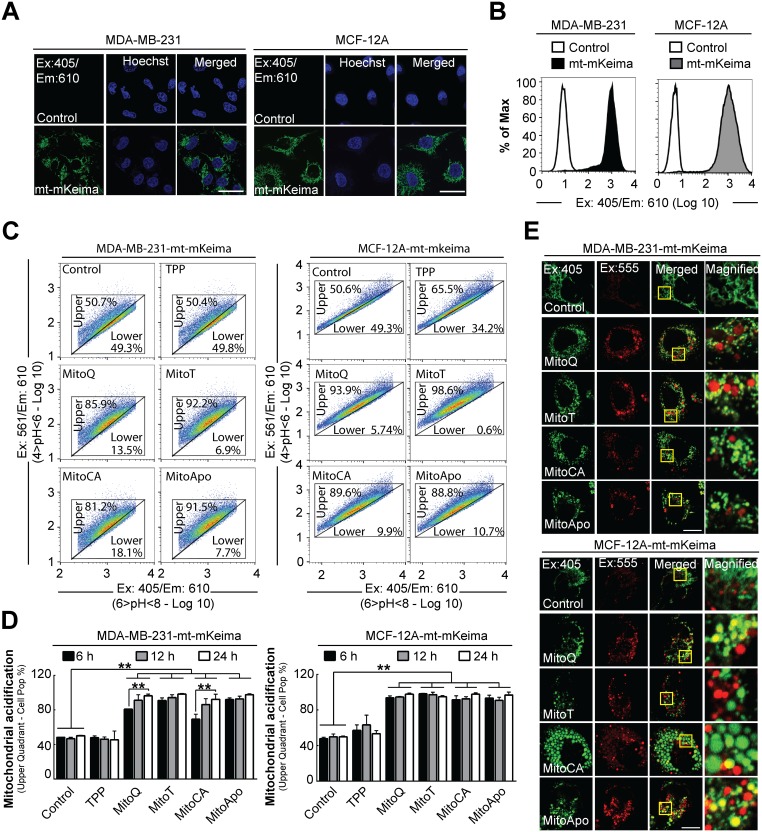
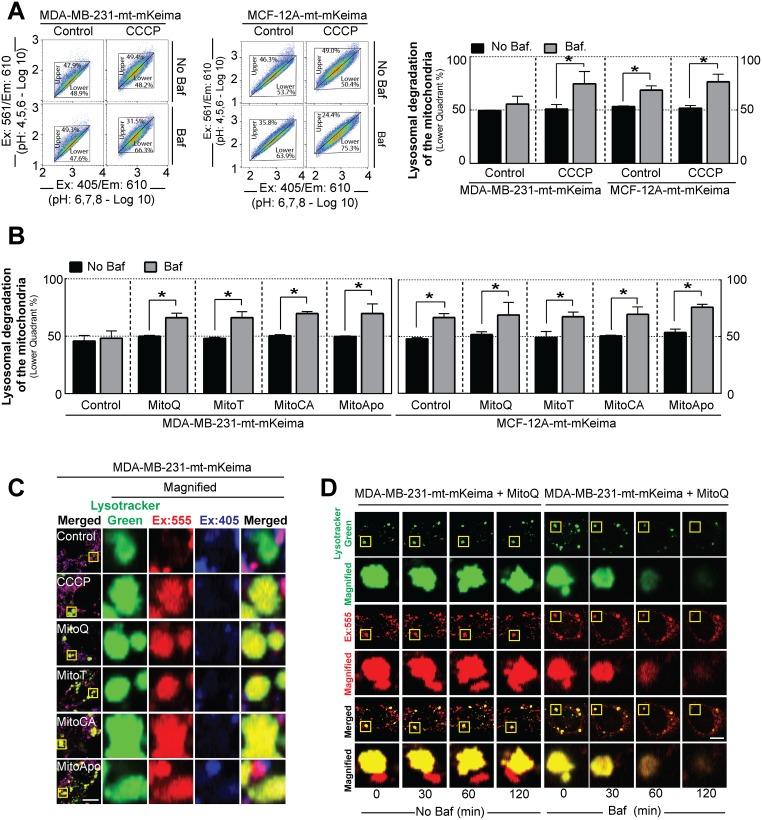
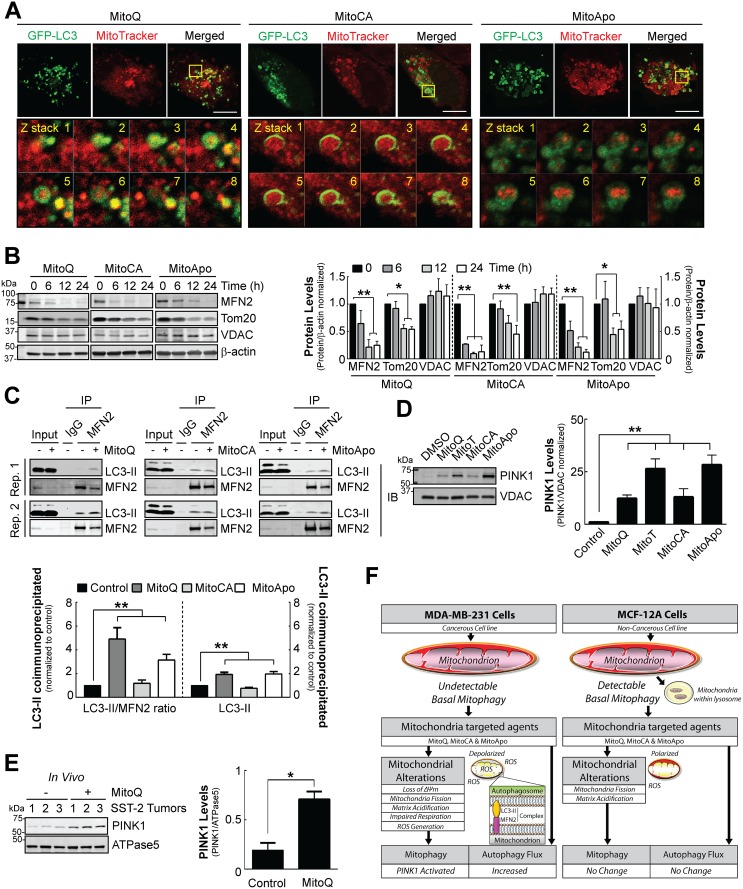
Molecules designed to target and accumulate in the mitochondria are an emerging therapeutic approach for cancer and other indications. Mitochondria-targeted redox agents (MTAs) induce mitochondrial damage and autophagy in cancer cells. However, the mechanisms for these molecules to induce mitophagy, the clearance of damaged mitochondria, are largely unknown. Using breast derived cell lines and a series of targeted molecules, mitochondrial dysfunction and autophagy was established to be selective for MDA-MB-231 cancer cells as compared to the non-cancerous MCF-12A cells. Kinetic analyses revealed that mitochondrial dysfunction precedes the activation of autophagy in these cancer cells. To determine the onset of mitophagy, stably expressing mitochondrial mKeima, a mitochondrial pH sensor, cell lines were generated and revealed that these drugs activate lysosomal dependent mitochondrial degradation in MDA-MB-231 cells. Mitophagy was confirmed by identifying the accumulation of a PINK1, mitochondria located in autophagosomes, and the formation of an autophagosome-mitochondria protein (MFN2-LC3-II) complex. These results are the first to demonstrate that mitochondrial redox agents selectively induce mitophagy in a breast cancer cell line and their potential application both as tools for investigating mitochondrial biomechanics and as therapeutic strategies that target mitochondrial metabolism.

Keywords: autophagy; cancer; mitochondria; mitophagy; mitoquinone.


Conflict of interest statement

CONFLICTS OF INTEREST The authors have no conflicts of interests. The views expressed in this article are those of the authors and do not necessarily reflect the official policy or position of the United States Food and Drug Administration and the Department of Health and Human Services, nor does mention of trade names, commercial products, or organizations imply endorsement by the United States Government.

Figures

Figure 1
Figure 1. Prolonged MTA exposed MDA-MB-231 cells do not recover mitochondrial membrane potential but increase autophagic flux in MDA-MB-231 cells
(A) MDA-MB-231 cells were subjected to DMSO (control), TPP, MitoQ, MitoT, MitoCA or MitoApo at 1 μM to analyze changes in mitochondrial membrane potential using JC-1 fluorometry at the indicated times. Bar represents mean ± SEM. (n=3) (B) Mitochondrial membrane potential was measured in MDA-MB-231 cells exposed to DMSO, ubiquinone, MitoQ, tempol, MitoT, chromanol acetate, MitoCA, apocynin or MitoApo at 1 μM for 24 hours using JC-1 fluorometry. Bars represent mean ± SEM. (n=3) (C) Representative cropped immunoblot of LC3 from MDA-MB-231 cells subjected to DMSO TPP, MitoQ, MitoT, MitoCA or MitoApo at 1 μM for 24, 48 and 72 hours with and without 5 nM Baf. Cells were treated with Baf for 2 hours prior to protein harvest. Bar represents mean ± SEM. (n=3-5) (D) Representative images of GFP-LC3 expressing MDA-MB-231 and MCF-12A cells subjected to DMSO, MitoQ, MitoT, MitoCA or MitoApo at 1 μM for 24 hours. Scale bar is 40 μM. (E) Representative cropped LC3 immunoblot from cells treated with redox active agents conjugated or unconjugated to the TPP for 24 hours. Cells were subjected to 5 nM Baf for 2 hours prior to protein harvest. Bar represents mean ± SEM. (n=3) *P<0.05, and **P<0.01 indicate statistical significance. #P<0.05 indicates statistical significance between control and MTA treated cells in the absence of Baf.
Figure 2
Figure 2. MTA-induced autophagy is selective for MDA-MB-231 cells as compared to MCF-12A cells
(A-D) Autophagic flux kinetic analyses using LC3 immunoblotting from MDA-MB-231 and MCF-12A cells exposed to 1 μM of (A) MitoQ, (B) MitoT, (C) MitoCA or (D) MitoApo in the presence and absence of 5 nM Baf at the indicated times. Baf was added for 2 hours prior to protein harvest. Bars represent mean ± SEM. (n=4) *P<0.05 indicates statistical significance.
Figure 3
Figure 3. Changes in mitochondrial homeostasis as indicated by membrane depolarization, mitochondrial ROS generation and reduced oxygen consumption in MDA-MB-231 and MCF-12A cells
MDA-MB-231 and MCF-12A cells were treated with DMSO (control), MitoQ, MitoT, MitoCA or MitoApo at 1 μM to evaluate changes in mitochondrial membrane potential, ROS production, morphology and function at 6 hours post treatment. (A) Using the JC-1 fluorometry, mitochondrial membrane potential was determined in cells treated with different MTAs. Bars represent mean ± SEM. (n=3) (B) TMRM (100 nM) preloaded MDA-MB-231 cells were exposed to different MTAs and TPP for the 3, 6 and 9 hours or CCCP (10 μM) for 1 hour to quantify the change in mitochondrial membrane potential using fluorometrics. Bars represent mean ± SEM. (n=3) (C) Representative confocal images of TMRM stained mitochondria in MDA-MB-231 cells treated with the different MTAs. Scale bar is 40 μM. Yellow box indicates area that was magnified. (D) Representative confocal images of MitoTracker Green (100 nM), MitoSox (2 nM) and Hoechst (5 μM) stained cells after a 6 hour treatment with different MTAs. Scale bar is 40 μM. Yellow box indicates area that was magnified. (E) Quantification of MitoSOX fluorescence in MDA-MB-231 and MCF-12A cells at 6 hours post MTA treatment. Bars represent mean ± SD. (n=3) MitoSOX emission intensity was normalized to Hoechst emission intensity. (F) Mitochondrial oxygen consumption in MDA-MB-231 cells subjected to different MTAs for 6 hours or Oligomycin (1 μM) for 1 hour using a Seahorse Flux Analyzer. Bars represent mean ± SD. (n=3) *P<0.05 and **P<0.01 indicate statistical significance.
Figure 4
Figure 4. Mitochondrial acidification in stably-expressing mt-mKeima MDA-MB-231 and MCF-12A cells
Stable mt-mKeima expressing MDA-MB-231 and MCF-12A cell lines were generated to analyze mitochondrial pH changes in breast cancer and non-cancer cell lines. To verify mitochondrial location, confocal images were captured of stably expressing empty vector (pLVX) or mt-mKeima (pLV-mt-mKeima) (A) MDA-MB-231 and MCF-12A cells (Ex: 405 nm/Em: 610 nm). Scale bar is 40 μm. (B) Representative FACS histogram of MDA-MB-231 and MCF-12A cells expressing an empty vector or mt-mKeima using Ex:405 nm/Em:610 nm. (C) Representative 610 nm emission population analysis of the mt-mKeima pH excitation shift from 405 nm (4>pH<6) to 561 nm (6>pH<8) of the stable cells treated with DMSO (control) or 1 μM MTAs for 12 hours. (D) Quantification of mt-mKeima fluorescent shift to the upper quadrant in cell populations at 6, 12 and 24 hours of 1 μM MTA treatments. Bars represent mean ± SD. The number of cells counted for each FACS analysis was 50,000 events per experiment. (n=3) (E) Representative confocal images (Ex. 405 nm/Em: 610 nm and Ex: 555/Em: 610) of MTA treated cells stably expressing mt-mKeima at 24 hours post treatment. Scale bar is 20 μm. Yellow box indicates the area that was magnified. *P<0.05 and **P<0.01 indicate statistical significance.
Figure 5
Figure 5. Lysosomal degradation of the mitochondria is selective for MDA-MB-231 cancer cells as compared to MCF-12A healthy cells
(A) Representative 610 nm emission population analysis of the mt-mKeima pH excitation shift from 405 nm (4>pH<6) to 561 nm (6>pH<8) of the stably expressing MDA-MB-231 and MCF-12A cells treated with or without 30 mM CCCP for 3 hours in the presence or absence of 5 nM Baf for 2 hours prior to analyses. Bar represents the mean ± SD. (n=3). (B) Cell populations were analyzed for mt-mKeima pH shifts to lower quadrant using MDA-MB-231 and MCF-12A cells treated with 1 μM of MTAs for 12 hours in the presence 5 nM Baf for 2 hours prior to analysis. Bar represents the mean ± SD. (n=3) (C) Representative confocal images of mt-mKeima fluorescent emission at 610 nm after excitation at 405 and 555 nm in stably expressing MDA-MB-231 cells treated with different MTAs at 1 μM for 24 hours in the presence of 100 nM Lysotracker Green. Scale bar is 10 μm. (D) Kinetic confocal analysis of mt-mKeima fluorescent emission at 610 nm after excitation at 555 nm in stably expressing MDA-MB-231 cells treated with MitoQ at 1 μM for 24 hours in the presence of 100 nM Lysotracker with and without Baf. Scale bar is 10 μm. *P<0.05, and **P<0.01 indicate statistical significance.
Figure 6
Figure 6. Mitophagy execution via PINK1 accumulation, MFN2/TOM20 reduction and mitophagy signaling in MDA-MB-231 cells in vitro and SST2 tumors in vivo
(A) Confocal images of GFP-LC3 expressing MDA-MB-231 cells preloaded with MitoTracker Red at 12 hours post MTA treatment. Scale bar is 10 μm. Yellow box indicates the area selected for obtaining z stacks. (B) Cropped immunoblot of the outer mitochondrial membrane proteins MFN2, TOM20 and VDAC in MDA-MB-231 cells treated with 1 μM of different MTAs at the indicated times. Bars represent the mean ± SD SEM. (n=3) (C) Representative cropped LC3 immunoblots of a mitochondrial extract (300 μg) after MFN2 immunoprecipitation from MDA-MB-231 cells exposed to 1 μM of different MTAs for 24 hours to confirm an endogenous protein complex interaction between the autophagosome and mitochondria. Bar represents the mean ± SEM. Two replicates (Rep.) are shown. (n=3) (D) Representative cropped PINK1 immunoblot from the mitochondrial fractions of cells treated with different MTAs for 12 hours. Bar represents the mean ± SEM. (n=4) (E) Representative cropped PINK1 immunoblot from tumor mitochondrial extracts using a rat SST-2 allograft model after DMSO or MitoQ treatment for 14 days. Bar represents the mean ± SD. (n=3) *P<0.05, and **P<0.01 indicate statistical significance. (F) Schematic model for the proposed mechanism for the mitophagy selective response induced by MTA in MDA-MB-231 cells as compared to MCF-12A cells (See Discussion).

References

    1. Rao VA, Klein SR, Bonar SJ, Zielonka J, Mizuno N, Dickey JS, Keller PW, Joseph J, Kalyanaraman B, Shacter E. The antioxidant transcription factor Nrf2 negatively regulates autophagy and growth arrest induced by the anticancer redox agent mitoquinone. J Biol Chem. 2010;285:34447–59. https://doi.org/10.1074/jbc.M110.133579. - DOI - PMC - PubMed
    1. Cheng G, Zielonka J, Ouari O, Lopez M, McAllister D, Boyle K, Barrios CS, Weber JJ, Johnson BD, Hardy M, Dwinell MB, Kalyanaraman B. Mitochondria-targeted analogues of metformin exhibit enhanced antiproliferative and radiosensitizing effects in pancreatic cancer cells. Cancer Res. 2016;76:3904–15. https://doi.org/10.1158/0008-5472.CAN-15-2534. - DOI - PMC - PubMed
    1. Murphy MP. Targeting lipophilic cations to mitochondria. Biochim Biophys Acta. 2008;1777:1028–31. https://doi.org/10.1016/j.bbabio.2008.03.029. - DOI - PubMed
    1. Smith RA, Adlam VJ, Blaikie FH, Manas AR, Porteous CM, James AM, Ross MF, Logan A, Cocheme HM, Trnka J, Prime TA, Abakumova I, Jones BA, et al. Mitochondria-targeted antioxidants in the treatment of disease. Ann N Y Acad Sci. 2008;1147:105–11. https://doi.org/10.1196/annals.1427.003. - DOI - PubMed
    1. Wen S, Zhu D, Huang P. Targeting cancer cell mitochondria as a therapeutic approach. Future Med Chem. 2013;5:53–67. https://doi.org/10.4155/fmc.12.190. - DOI - PMC - PubMed

LinkOut - more resources