Review
. 2018;6(1):3.
doi: 10.1007/s40134-018-0263-y. Epub 2018 Jan 22.

Advanced Imaging Techniques in Skull Base Osteomyelitis Due to Malignant Otitis Externa

Affiliations
Review

Advanced Imaging Techniques in Skull Base Osteomyelitis Due to Malignant Otitis Externa

A M J L van Kroonenburgh et al. Curr Radiol Rep. 2018.

Abstract

Purpose of review: To give an up-to-date overview of the strengths and weaknesses of current imaging modalities in diagnosis and follow-up of skull base osteomyelitis (SBO).

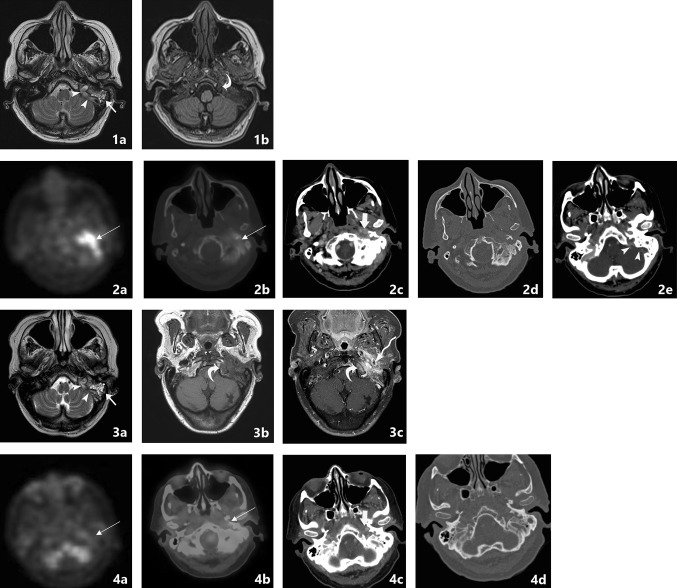
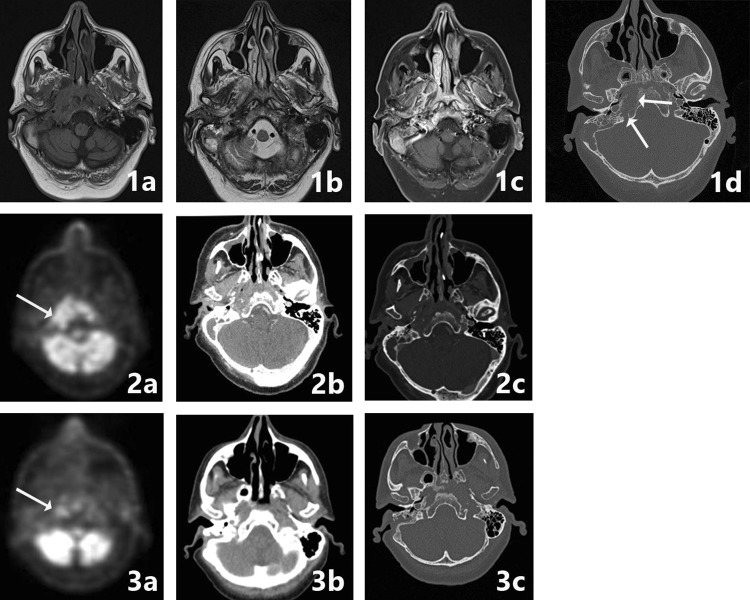
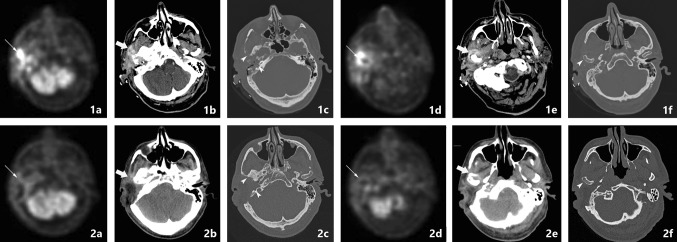
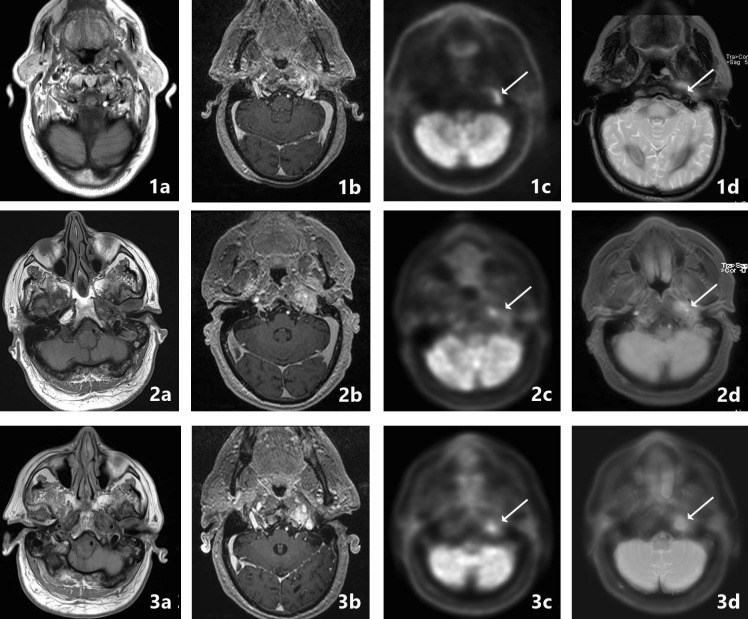
Recent findings: CT and MRI are both used for anatomical imaging, and nuclear techniques aid in functional process imaging. Hybrid techniques PET-CT and PET-MRI are the newest modalities which combine imaging strengths.

Summary: No single modality is able to address the scope of SBO. A combination of functional and anatomical imaging is needed, in the case of newly suspected SBO we suggest the use of PET-MRI (T1, T2, T1-FS-GADO, DWI) and separate HRCT for diagnosis and follow-up.

Keywords: CT; MRI; Malignant otitis externa; PET-CT; PET-MRI; Skull base osteomyelitis.


Conflict of interest statement

Compliance with Ethical GuidelinesA.M.J.L. van Kroonenburgh, W.L. van der Meer, R.J.P. Bothof, Mark van Tilburg, and Joost van Tongeren each declare no potential conflicts of interest. A.A. Postma reports speakers’ fees from Bayer and Siemens Healthcare. Dr. Postma is a section editor for Current Radiology Reports.This article does not contain any studies with human or animal subjects performed by any of the authors.

Figures

Fig. 1
Fig. 1
Spreading patterns. This figure illustrates the routes of infectious spread after NOE (EAC brown). After passing the fissures of Santorini, the infection can spread anteriorly to the fatty tissue (yellow) at the site of the temporomandibular joint and to the masticator space (red) and parotid gland (green). Medial route of spread entails the ipsilateral paranasopharyngeal fatty tissue where encasement of the internal carotid artery in the infectious site can occur (see also Fig. 5) and preclival soft tissue. From there, the infection is able to spread to the contralateral side (see also Fig. 3). Further extension through the osseous structures (purple) can lead to venous sinus thrombosis (see also Fig. 5) and dural extension (bright blue) (not shown in SBO cases but illustrated in the malignancy case in Fig. 2). Posteriorly, the infection can spread into the mastoid portion of the petrous bone (Color figure online)
Fig. 2
Fig. 2
Differential diagnosis PCC of the EAC. A 84-year-old male patient presented with ongoing otalgia and otorrhea. His medical history showed two previous operations of the temporal bone. Prior to imaging the patient was treated with antibiotics and received a tissue biopsy which came out as negative. The patient did not have type 2 diabetes nor did he have a compromised immune system otherwise. The resection specimen eventually revealed a PCC malignancy. On CT bone erosion is seen as well as the soft tissue in the EAC (image 1). Furthermore, there is soft tissue in the inner ear (arrow). SBO tends to spare the tympanic membrane in contrary to malignant disease. MRI images show T1 hypointensity in the corresponding area. Contrast enhancement of the soft tissue is seen on the post-contrast T1-w scan (image 2c arrows). Interestingly, the central portion of the soft tissue component is hypointense (image 2c asterix) corresponding with the photopenic area on FDG-PET-MRI fusion images (image 2f asterix), this is probably due to central necrosis. In image 2d and 3d the diffusion restriction in this area can be appreciated. Follow-up scan after 6 weeks shows persistent contrast enhancement of the soft tissue and further dural enhancement (image 3f arrowheads)
Fig. 3
Fig. 3
Abscess formation and involvement of facial nerve. A 65-year-old male with a history of a kidney transplant presented with headache and cranial nerve deficit, with dysphonia and facial nerve palsy. Otoscopy revealed a red and painful EAC. At MRI, there is SBO involvement of the bone marrow of the temporal bone and the clivus, with medial spreading pattern of the soft tissues (image 1a arrows). There is a hypointensity of the subtemporal soft tissues with obliteration of normal fatplanes in the masticator space. At DWI, a slight hyperintensity is shown (image 1b arrow), with relative low ADC (image 1c). At high-resolution CT demineralization and cortical destruction of the skull base and clivus can be appreciated (image 2a arrows). Follow-up PET-MRI (image 3a T1-w, 3b CE-T1-w) 1 month later shows SBO with expansion over the midline (crossed pattern) and abscess formation bilateral at the prevertebral region (image 3b arrowheads), with intense FDG avidity (image 3c PET, 3d colour fused PET-MR image). Involvement of the VII cranial nerve was seen at contrast-enhanced T1-w imaging, without osseous destruction of the facial canal (image 2b detail of skull base on T1-w-fs, arrow indicates enhancing facial nerve) (Color figure online)
Fig. 4
Fig. 4
HRCT widening of temporomandibular joint. A 67-year-old male presented after 5 weeks with signs of external otitis and pain during chewing, without improvement after admission of topical antibiotics. An EAC polyp was removed. Bacterial culture revealed Pseudomonas aeruginosa. A non-contrast HRCT of the temporal bone was performed. The figure shows a bone window (image a) and soft tissue window (image b). Non-contrast-enhanced CT shows thickening of soft tissue of the EAC (image b arrow) as well as an anteriorly displacement of the mandible head with widening of the temporomandibular joint (black double arrow), indicating anterior spread of inflammation to the TMJ. At this point, no signs of bone erosion were present. Symptoms resolved after 4 weeks of iv. antibiotic therapy
Fig. 5
Fig. 5
Transverse sinus thrombosis. A 76-year-old female presented with pain and otorrhea of the left ear since 2 months, with hearing loss and tinnitus. The symptoms were accompanied by a left-sided headache. No cranial nerve deficit was present. No history of diabetes or immune suppressive disease was present. Culture from the EAC revealed Pseudomonas as causal agent. An MRI was made at presentation with T2-w (image 1a) and T1-w (image 1b) series. At T2-w (image 1a) high signal intensity is present in the mastoid air cells at the left side (straight arrow), with loss of flow voids of the sigmoid sinus (arrowheads) indicative for sinus thrombosis. T1-w images show loss of signal intensity of the bone marrow of the skull base (image 1b, bent arrow), consistent with SBO. FDG-PET-CT performed 3 weeks after initial diagnosis confirms the location of SBO with increased uptake at the left temporal bone and surrounding soft tissue (image 2a, 2b fused PET-CT image, thin arrow). On the diagnostic CT, the decrease of subtemporal fatplanes with enhancing soft tissue at the stylomastoid foramen (image 2c thick arrow), bone erosion (image 2d) and sinus thrombosis (image 2e arrowheads) are reaffirmed. Additional MRI sequences (image 3a:T2-w; 3b:T1-w, 3c: T1-w fs) were executed showing added value of T1-w fatsat (fs) post-gadolineum scan (image 3c); the encasement of the internal carotid artery (arrow) is more easily appreciated within the area of extensive bone involvement (bent arrow). Follo-up FDG-PET-CT at 4 months (image 4a: PET; 4b: colour fused PET-CT; 4c: CE-CT soft tissue window; 4d: CE-CT-CT bone window) shows normalization of FDG avidity (image 4a thin arrow), normalization of enhancement of soft tissues (image 4b thin arrow) and sclerotic healing of the affected osseous tissue (image 4c thick arrow) (Color figure online)
Fig. 6
Fig. 6
SBO crossed extension. A 64-year-old patient presented with clinical signs of a mastoid abscess. After initial successful surgery and antibiotic therapy, the patient presented 4 weeks later with progressive cranial deficit of the X and XI nerve. Imaging at that time was performed with CT and MRI in a referring hospital, with PET-CT imaging at 1 month (image 2a–c) and at 6 months follow-up. MRI with T1-w, T2-w, contrast-enhanced T1w-fs images (image 1a, b, c) and CT (image 1d) are shown. There is marked hypointensity at the bone marrow of the right skull base, the clivus and to a lesser extent of the left skull base, with involvement of the subtemporal soft tissues, the masticator space at right side, the prevertebral tissues and nasopharyngeal wall, with crossed extension to the left side. T1 FS post-gadolineum scan illustrates the extent of bone and soft tissue involvement (image 1c). Additional high-resolution CT shows bone erosion in the corresponding region, especially at the medial part of the skull base, the jugular foramen and the clivus (image 1d arrows). FDG-PET-CT indicates the metabolic activity and spread of the inflammation sites (image 2a arrows) and was used for follow up with a normalization of the FDG avidity after 6 months (image 3a arrows). The healing process is to a lesser extent seen on CT, but there is healing and remodeling of the cortical borders of the clivus (image 3c)
Fig. 7
Fig. 7
PET-CT follow-up. A 63-year-old male presented pain and otorrhea of the right ear for 3 months. Clinical symptoms included hearing loss and signs of vertigo. He was diagnosed with NOE. Initial FDG-PET-CT scan shows increased FDG uptake in the soft tissue in the subtemporal region expanding to the masticator space (thin arrow in image 1a) and the temporomandibular joint (thin arrow in image 1d). Corresponding CT in soft tissue setting diminishing of the fatplanes of the retromandibular space and masticator space, with enhancement of the peri-mandibular region and parotid region, corresponding with infectious spread (image 1b, 1e thick arrows). CT in bone window shows bone erosion of the temporal bone and mandibular condyle (image 1c,1f arrowheads). The patient received antibiotic therapy and a lateral temporal bone resection. Follow-up FDG-PET-CT scan shows markedly decreased FDG avidity (image 2a, 2d thin arrows), with decreased enhancement of soft tissue (image 2b, 2e thick arrows) as well as sclerotic margins of involved bone segments (image 2c, 2f arrowheads)
Fig. 8
Fig. 8
PET-MRI follow-up. A 85-year-old male, with a history of diabetes, presented at a referring hospital 3 months earlier. He was treated with topical and intravenous antibiotics for external otitis. After initial improvement of symptoms, the patient presented with facial nerve palsy and recurrent pain with continuous hearing loss. At CT (not shown) SBO was suspected with obliteration of subtemporal fat planes, induration of the fat at the stylomastoid foramen, osseous destruction of the ventral border of the mesotympanum and malleus. Follow-up was performed with FDG-PET-MRI and additional CT. No increase of bone erosion on CT was noted (not shown). PET-MRI images are shown at 2, 5 and 7 months’ follow-up (respectively, upper, middle and lower panels). From left to right T1-w, contrast-enhanced T1-w, PET and colour fused PET-MRI images are shown. A hypointense signal intensity can be appreciated on the T1-w images (image 2a, 3a, 4a), with loss of fat planes and enhancement after administration of gadolinium (image 2b, 3b, 4b). There is increased uptake of FDG in the temporal bone and subtemporal region, as well as in the retromandibular region (arrows). At follow-up, MRI abnormalities resolved at the meatus and mandibular region with persistent signal abnormalities and enhancement at the medial part of the skull base. The uptake at and below the skull base is decreased at the 5 month follow up, whereas at 7 months there is again an increase in FDG uptake, with new bone marrow edema on T2-w images at the clivus (not shown). Again iv. antibiotics were given; at follow-up at 9 months there was clear improvement in FDG uptake and bone marrow edema. Interestingly enough the increased FDG avidity at the 7-month interval scan (image 3d, 3e) is hardly appreciated on the given images (the scaling of the images was not intentionally adjusted for publication). Showing the importance of quantitative measurement of FDG avidity and comparison with the contralateral side (in accordance with the research of Wong et al.) (Color figure online)

References

    1. • Adams A, Offiah C. Central skull base osteomyelitis as a complication of necrotizing otitis externa: imaging findings, complications, and challenges of diagnosis. Clin Radiol. 2012;67(10):e7–e16. A well written article with CT, MRI and PET-CT examples of SBO. - PubMed
    1. •• Grandis JR, Branstetter BFT, Yu VL. The changing face of malignant (necrotising) external otitis: clinical, radiological, and anatomic correlations. Lancet Infect Dis. 2004;4(1):34–9. A detailed and well illustrated article of SBO spreading patterns with multiple examples. - PubMed
    1. Sreepada GS, Kwartler JA. Skull base osteomyelitis secondary to malignant otitis externa. Curr Opin Otolaryngol Head Neck Surg. 2003;11(5):316–323. doi: 10.1097/00020840-200310000-00002. - DOI - PubMed
    1. Mani N, Sudhoff H, Rajagopal S, Moffat D, Axon PR. Cranial nerve involvement in malignant external otitis: implications for clinical outcome. Laryngoscope. 2007;117(5):907–910. doi: 10.1097/MLG.0b013e318039b30f. - DOI - PubMed
    1. Clark MP, Pretorius PM, Byren I, Milford CA. Central or atypical skull base osteomyelitis: diagnosis and treatment. Skull Base. 2009;19(4):247–254. doi: 10.1055/s-0028-1115325. - DOI - PMC - PubMed

LinkOut - more resources