. 2018 Feb 2:6:e4299.
doi: 10.7717/peerj.4299. eCollection 2018.

A 250 plastome phylogeny of the grass family (Poaceae): topological support under different data partitions

Affiliations

A 250 plastome phylogeny of the grass family (Poaceae): topological support under different data partitions

Jeffery M Saarela et al. PeerJ. .

Abstract

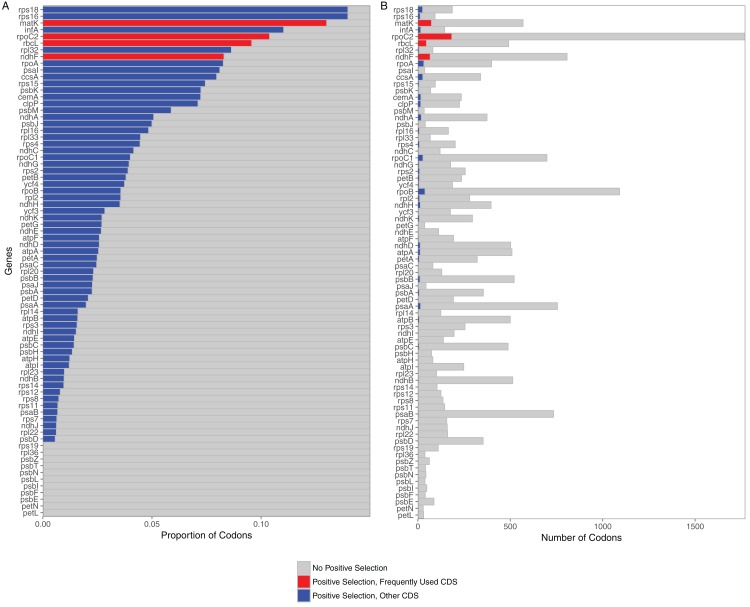
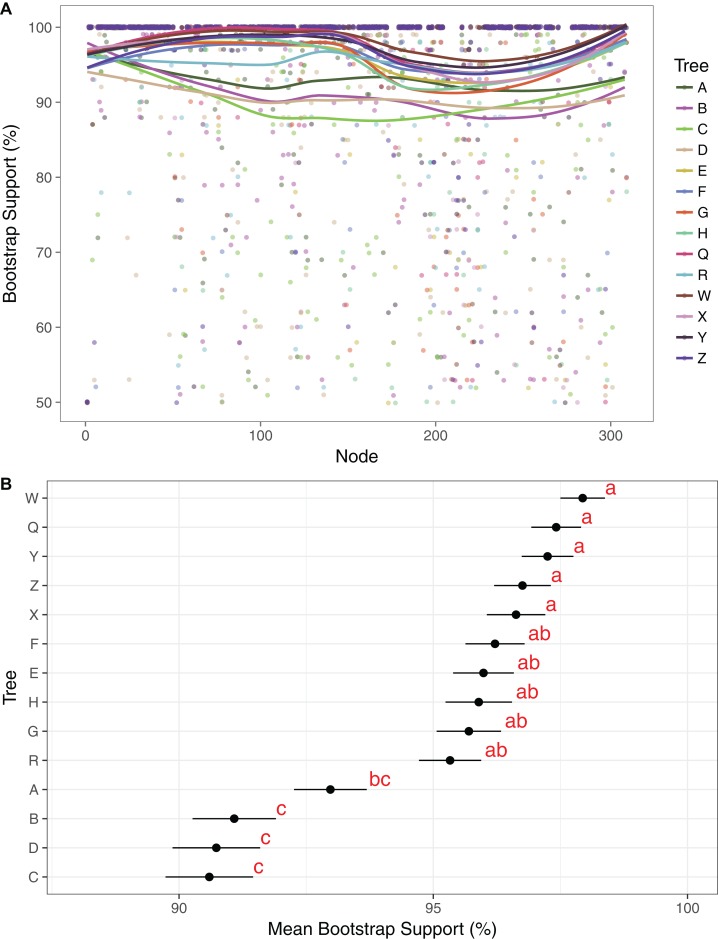
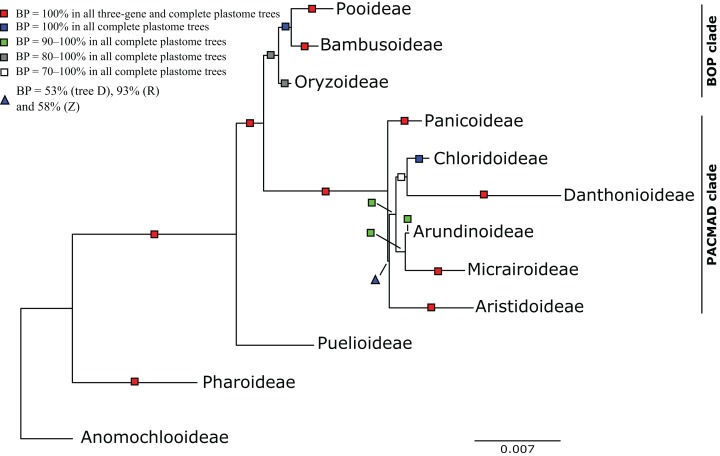
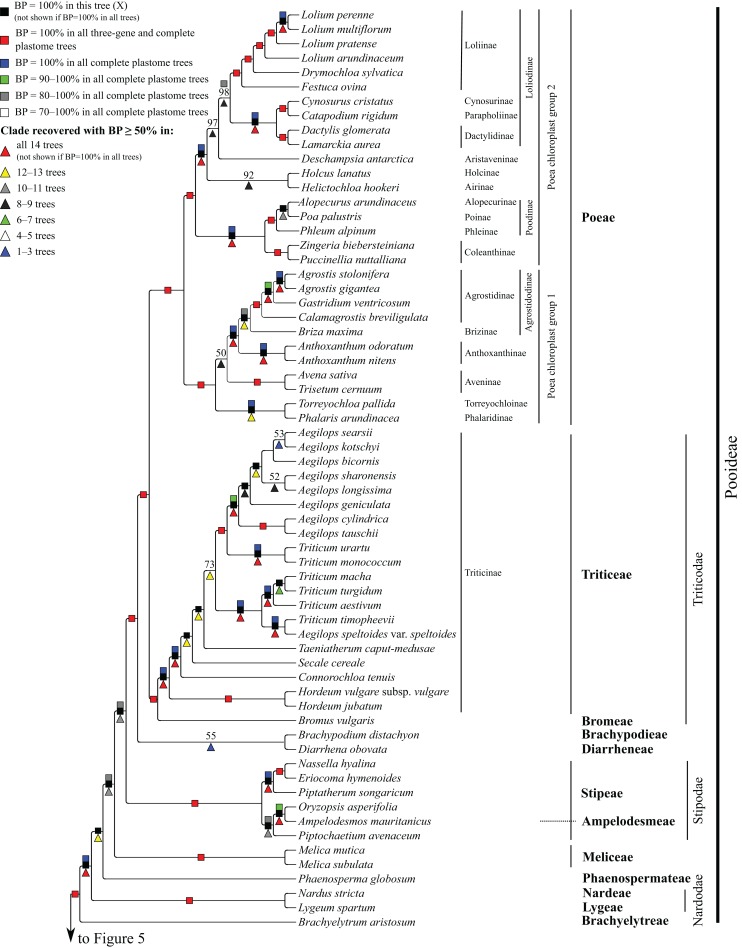
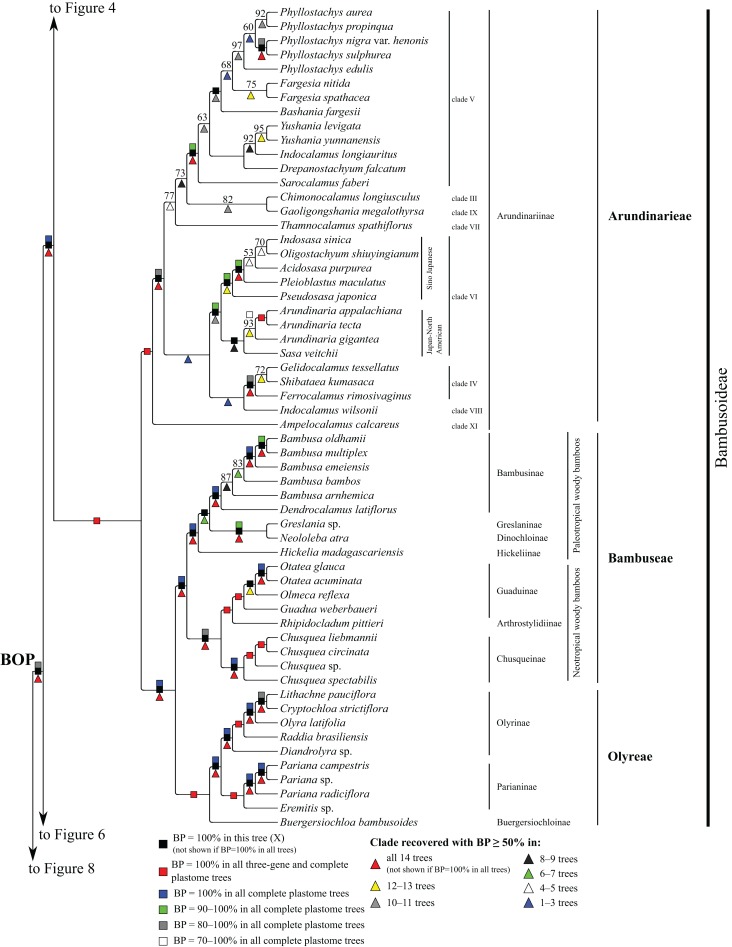
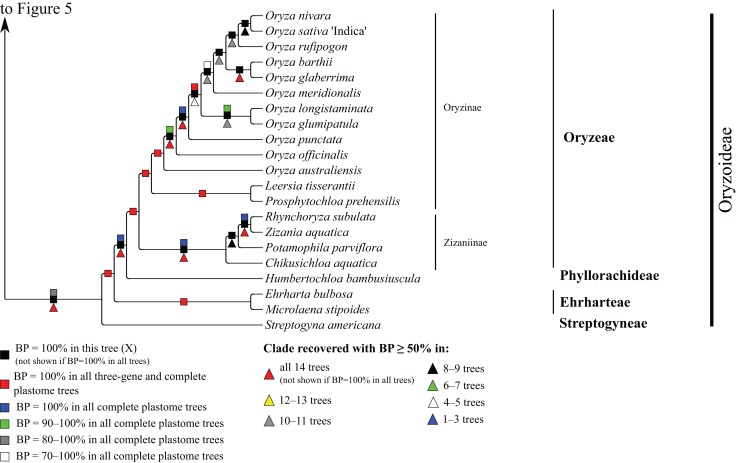
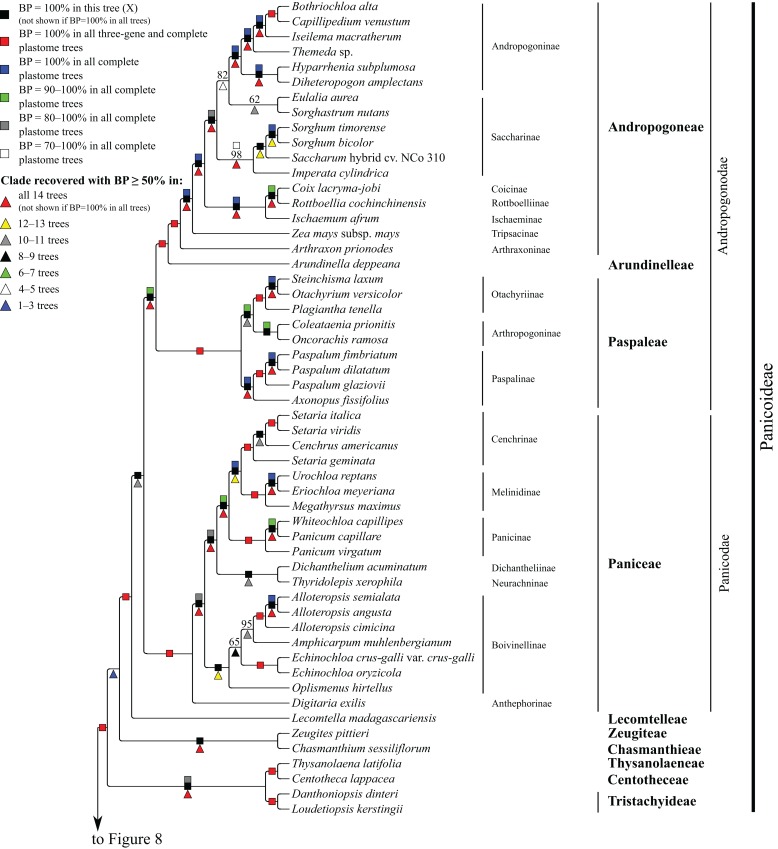
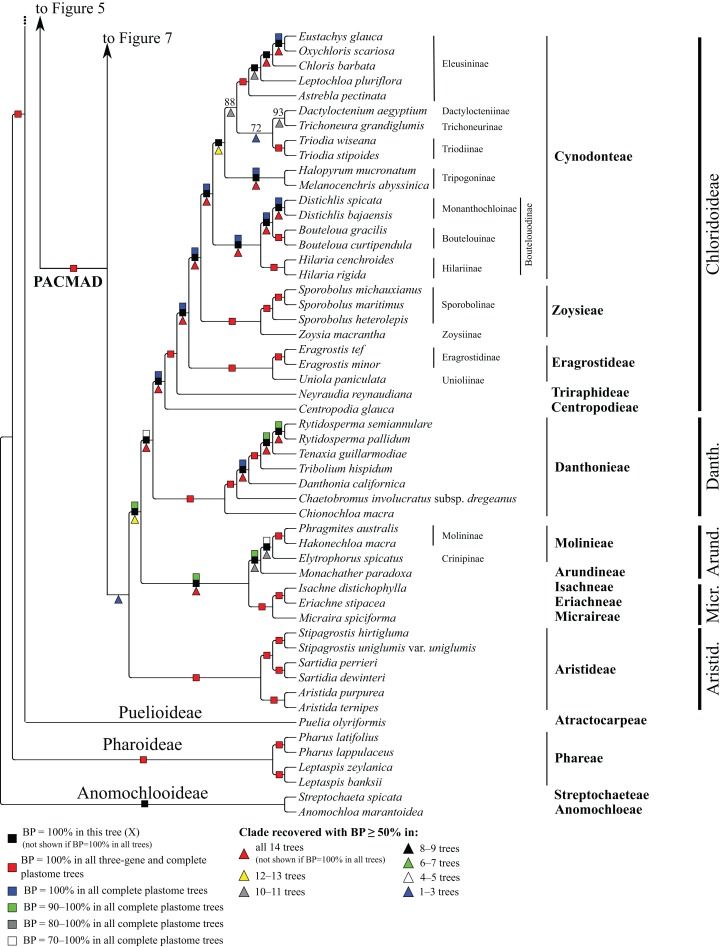
The systematics of grasses has advanced through applications of plastome phylogenomics, although studies have been largely limited to subfamilies or other subgroups of Poaceae. Here we present a plastome phylogenomic analysis of 250 complete plastomes (179 genera) sampled from 44 of the 52 tribes of Poaceae. Plastome sequences were determined from high throughput sequencing libraries and the assemblies represent over 28.7 Mbases of sequence data. Phylogenetic signal was characterized in 14 partitions, including (1) complete plastomes; (2) protein coding regions; (3) noncoding regions; and (4) three loci commonly used in single and multi-gene studies of grasses. Each of the four main partitions was further refined, alternatively including or excluding positively selected codons and also the gaps introduced by the alignment. All 76 protein coding plastome loci were found to be predominantly under purifying selection, but specific codons were found to be under positive selection in 65 loci. The loci that have been widely used in multi-gene phylogenetic studies had among the highest proportions of positively selected codons, suggesting caution in the interpretation of these earlier results. Plastome phylogenomic analyses confirmed the backbone topology for Poaceae with maximum bootstrap support (BP). Among the 14 analyses, 82 clades out of 309 resolved were maximally supported in all trees. Analyses of newly sequenced plastomes were in agreement with current classifications. Five of seven partitions in which alignment gaps were removed retrieved Panicoideae as sister to the remaining PACMAD subfamilies. Alternative topologies were recovered in trees from partitions that included alignment gaps. This suggests that ambiguities in aligning these uncertain regions might introduce a false signal. Resolution of these and other critical branch points in the phylogeny of Poaceae will help to better understand the selective forces that drove the radiation of the BOP and PACMAD clades comprising more than 99.9% of grass diversity.

Keywords: Aristidoideae; Classification; Grasses; Incongruence; Panicoideae; Phylogenomics; Plastome; Positive selection; Purifying selection; Systematics.


Conflict of interest statement

Joseph M. Craine is an employee of Jonah Ventures and an Academic Editor for PeerJ.

Figures

Figure 1
Figure 1. Proportion and raw numbers of positively selected codons for each plastome protein coding sequence (CDS).
(A) Proportion of codons. (B) Number of codons. Red represents positive selection in CDS that are commonly used in phylogenetic studies, while blue represents positive selection in other CDS. Proportionate data are only represented up to 0.15 selected codons for clarity of illustration.
Figure 2
Figure 2. Comparison of bootstrap support across trees.
(A) Support values and trend lines for all clades identified in at least one tree with support ≥50%. Trend lines were plotted in R, using the command geom_smooth in ggplot2 with the method “LOESS.” Clade no. corresponds to numerical clade identifiers as noted in Dataset S16. (B) Mean support values with standard error bars for each tree. Trees were grouped by a least significant difference test with a Bonferonni correction. Groups are identified by the analysis and labeled with one or two letter designators showing overlap in some cases.
Figure 3
Figure 3. Maximum likelihood phylogram from analysis of complete plastomes excluding gapped sites and including positively selected sites (tree X) showing relationships among major lineages of Poaceae.
Subfamilies are collapsed and only the branch subtending each subfamilial clade is shown. Bootstrap support is indicated along branches, according to the legend on the upper left. Two alternative topologies within the PACMAD clade, not shown in the figure, are identified in our trees: (1) Aristidoideae are sister to the rest of the PACMAD clade, with BP = 69–100%, in trees A, C, Q, W and Y; and (2) Aristidoideae and Panicoideae form a weakly supported clade (BP = 52%) in tree F that is sister to the rest of the PACMAD clade.
Figure 4
Figure 4. Pooideae portion of the maximum likelihood tree inferred from complete plastomes excluding gapped sites and including positively selected sites (tree X).
Bootstrap support, when ≥50%, for clades in this tree and clades shared among this and other trees, is summarized along branches, according to the legend. Numbers along branches are bootstrap support values in tree X.
Figure 5
Figure 5. Bambusoideae portion of the maximum likelihood tree inferred from complete plastomes excluding gapped sites and including positively selected sites (tree X).
Bootstrap support, when ≥50%, for clades in this tree and clades shared among this and other trees, is summarized along branches, according to the legend. Numbers along branches are bootstrap support values in tree X.
Figure 6
Figure 6. Oryzoideae portion of the maximum likelihood tree inferred from complete plastomes excluding gapped sites and including positively selected sites (tree X).
Bootstrap support, when ≥50%, for clades in this tree and clades shared among this and other trees, is summarized along branches, according to the legend. Numbers along branches are bootstrap support values in tree X.
Figure 7
Figure 7. Panicoideae portion of the maximum likelihood tree inferred from complete plastomes excluding gapped sites and including positively selected sites (tree X).
Bootstrap support, when ≥50%, for clades in this tree and clades shared among this and other trees, is summarized along branches, according to the legend. Numbers along branches are bootstrap support values in tree X.
Figure 8
Figure 8. Anomochlooideae, Pharoideae, Puelioideae, Arundinoideae, Chloridoideae, Danthonioideae and Micrairoideae portion of the maximum likelihood tree inferred from complete plastomes excluding gapped sites and including positively selected sites (tree X).
Bootstrap support, when ≥50%, for clades in this tree and clades shared among this and other trees, is summarized along branches, according to the legend. Numbers along branches are bootstrap support values in tree X.

References

    1. Acosta JM, Scataglini MA, Reinheimer R, Zuloaga FO. A phylogenetic study of subtribe Otachyriinae (Poaceae, Panicoideae, Paspaleae) Plant Systematics and Evolution. 2014;300(10):2155–2166. doi: 10.1007/s00606-014-1034-8. - DOI
    1. Akaike H. A new look at the statistical model identification. IEEE Transactions on Automatic Control. 1974;19(6):716–723. doi: 10.1109/TAC.1974.1100705. - DOI
    1. Asano T, Tsudzuki T, Takahashi S, Shimada H, Kadowaki K-I. Complete nucleotide sequence of the sugarcane (Saccharum officinarum) chloroplast genome: a comparative analysis of four monocot chloroplast genomes. DNA Research. 2004;11(2):93–99. doi: 10.1093/dnares/11.2.93. - DOI - PubMed
    1. Attigala L, Triplett JK, Kathriarachchi H-S, Clark LG. A new genus and a major temperate bamboo lineage of the Arundinarieae (Poaceae: Bambusoideae) from Sri Lanka based on a multi-locus plastid phylogeny. Phytotaxa. 2014;174(4):187–205. doi: 10.11646/phytotaxa.174.4.1. - DOI
    1. Attigala L, Wysocki WP, Duvall MR, Clark LG. Phylogenetic estimation and morphological evolution of Arundinarieae (Bambusoideae: Poaceae) based on plastome phylogenomic analysis. Molecular Phylogenetics and Evolution. 2016;101:111–121. doi: 10.1016/j.ympev.2016.05.008. - DOI - PubMed

LinkOut - more resources