. 2018 Apr;29(4):711-722.
doi: 10.1007/s13361-017-1886-6. Epub 2018 Feb 7.

MALDI Mass Spectral Imaging of Bile Acids Observed as Deprotonated Molecules and Proton-Bound Dimers from Mouse Liver Sections

Affiliations

MALDI Mass Spectral Imaging of Bile Acids Observed as Deprotonated Molecules and Proton-Bound Dimers from Mouse Liver Sections

Ignacy Rzagalinski et al. J Am Soc Mass Spectrom. 2018 Apr.

Abstract

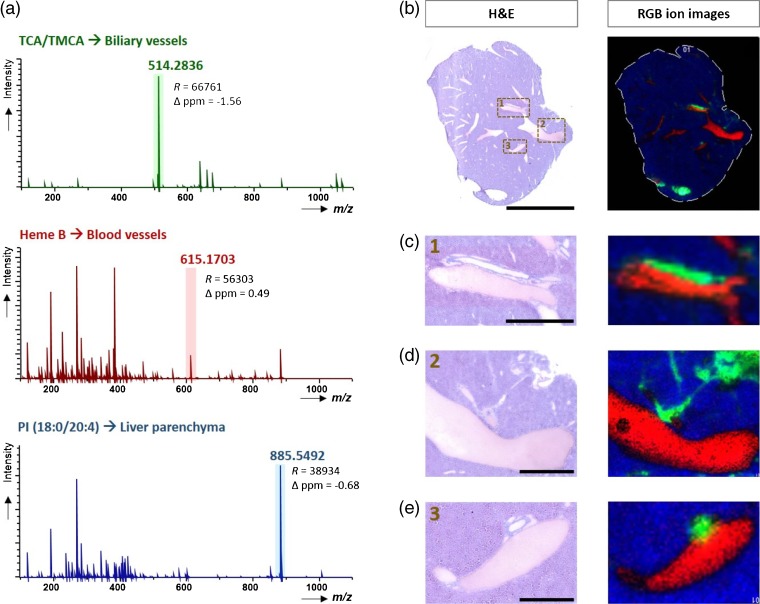
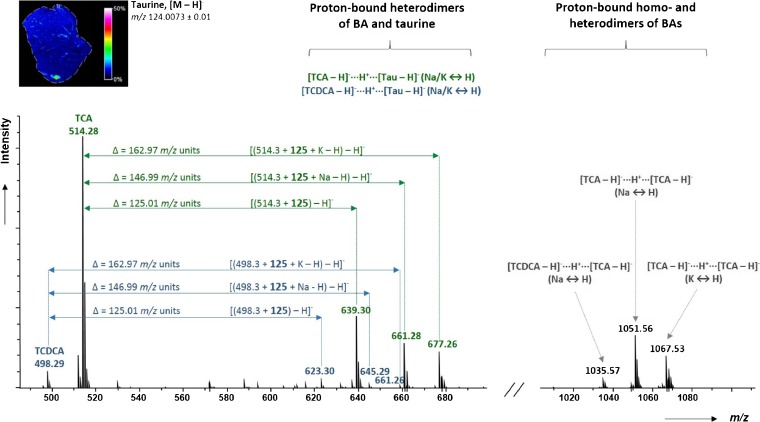
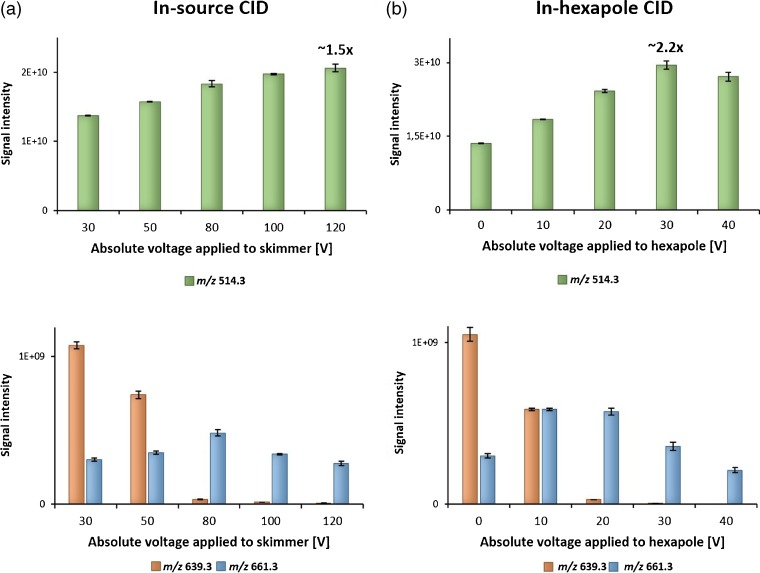
Bile acids (BAs) play two vital roles in living organisms, as they are involved in (1) the secretion of cholesterol from liver, and (2) the lipid digestion/absorption in the intestine. Abnormal bile acid synthesis or secretion can lead to severe liver disorders. Even though there is extensive literature on the mass spectrometric determination of BAs in biofluids and tissue homogenates, there are no reports on the spatial distribution in the biliary network of the liver. Here, we demonstrate the application of high mass resolution/mass accuracy matrix-assisted laser desorption/ionization (MALDI)-Fourier-transform ion cyclotron resonance (FTICR) to MS imaging (MSI) of BAs at high spatial resolutions (pixel size, 25 μm). The results show chemical heterogeneity of the mouse liver sections with a number of branching biliary and blood ducts. In addition to ion signals from deprotonation of the BA molecules, MALDI-MSI generated several further intense signals at larger m/z for the BAs. These signals were spatially co-localized with the deprotonated molecules and easily misinterpreted as additional products of BA biotransformations. In-depth analysis of accurate mass shifts and additional electrospray ionization and MALDI-FTICR experiments, however, confirmed them as proton-bound dimers. Interestingly, dimers of bile acids, but also unusual mixed dimers of different taurine-conjugated bile acids and free taurine, were identified. Since formation of these complexes will negatively influence signal intensities of the desired [M - H]- ions and significantly complicate mass spectral interpretations, two simple broadband techniques were proposed for non-selective dissociation of dimers that lead to increased signals for the deprotonated BAs. Graphical Abstract ᅟ.

Keywords: Adducts; Bile acids; FTICR; MALDI; Mass spectrometry imaging; Proton-bound dimers; Taurine; Taurocholic acid.


Figures

Graphical Abstract
Graphical Abstract
Figure 1
Figure 1
(a) Typical four-ring steroid structures of 24-carbon bile acids, including differences in number and positions of hydroxyl groups (R1-R3) as well as N-amide conjugation (R4). (b) Most common non-conjugated bile acids present in humans and rodents, with the different positions of hydroxyl groups as well as two major conjugation types
Figure 2
Figure 2
(a) MSI single pixel mass spectrum for the m/z range 450–700 (center), with two smaller expanded m/z range: m/z 492–508 (top) and m/z 522–540 (bottom), showing signals from deprotonated molecules of trihydroxy, dihydroxy, and tetrahydroxy bile acids, respectively. (b) CID mass spectra of three identified BAs, confirming taurine-conjugated side chains, obtained after isolation in the quadrupole and dissociation in the hexapole collision cell at energies of 50, 55, and 50 eV for dihydroxy, trihydroxy, and tetrahydroxy BAs, respectively. (c) Structures of the three identified BAs (TCA and TMCA isomers are both shown, as distinction was not possible with the present method)
Figure 3
Figure 3
MS ion images representing spatial distributions of the identified taurine-conjugated bile acids at m/z 498.2904 ± 0.05 (TCDCA), m/z 514.2836 ± 0.05 (TCA/TMCA), and m/z 530.2789 ± 0.05 (TTHBA) for the whole section of mouse liver at low spatial resolution (pixel size, 70 μm) (a), and in smaller sub-regions of an adjacent tissue section at high spatial resolution (pixel size, 25 μm) (bd). All ion images were normalized to the 9-AA matrix signal. The green arrows indicate gall bladder (a) or bile vessels (bd), whereas the red arrows show blood vessels. Scale bars: 5 mm (a), 1000 μm (b, c), and 500 μm (d)
Figure 4
Figure 4
MALDI-MSI single pixel mass spectra from three regions of liver tissue section with different microstructures and chemical compositions: biliary tree (bile duct), blood vessel, and liver parenchyma. The m/z values used for RGB MS images are highlighted in the spectra (a). RGB ion images representing three different compounds, showing clear distinction between anatomical features (as shown by the H&E stained images) across the whole tissue section (pixel size, 70 μm) (b). Expansion of the smaller sub-region (c) as well as smaller sub-regions from an adjacent section (pixel size, 25 μm) (d, e). Scale bars: 5 mm (b), 1000 μm (c, d), and 500 μm (e)
Figure 5
Figure 5
Single MSI pixel mass spectrum from the bile duct region in the range m/z 490–1100, showing signals from proton-bound dimers formed between bile acids (homo- and heterodimers) as well as between bile acids and taurine. The 2D ion image on the upper left illustrates the distribution of taurine in the liver section
Figure 6
Figure 6
Bar chart showing signal intensities for three different m/z values, m/z 514.3 (deprotonated TCA), m/z 639.3 (mixed dimer of TCA and taurine), and m/z 661.3 (sodiated dimer of TCA and taurine) obtained by direct infusion ESI-FTICR and two different approaches for CID: in-source CID (increasing voltage applied to skimmer) (a) and in-hexapole CID (b)

References

    1. Russell DW. The enzymes, regulation, and genetics of bile acid synthesis. Annu. Rev. Biochem. 2003;72:137–174. doi: 10.1146/annurev.biochem.72.121801.161712. - DOI - PubMed
    1. Hofmann AF, Hagey LR, Krasowski MD. Bile salts of vertebrates: structural variation and possible evolutionary significance. J. Lipid Res. 2010;51:226–246. doi: 10.1194/jlr.R000042. - DOI - PMC - PubMed
    1. Rudling M. Understanding mouse bile acid formation: Is it time to unwind why mice and rats make unique bile acids? J. Lipid Res. 2016;57:2097–2098. doi: 10.1194/jlr.C072876. - DOI - PMC - PubMed
    1. Bonde, Y., Eggertsen, G., Rudling, M.: Mice abundant in muricholic bile acids show resistance to dietary induced steatosis, weight gain, and to impaired glucose metabolism. PLoS One. 11, (2016) - PMC - PubMed
    1. Qi Y, Jiang C, Cheng J, Krausz KW, Li T, Ferrell JM, Gonzalez FJ, Chiang JYL. Bile acid signaling in lipid metabolism: Metabolomic and lipidomic analysis of lipid and bile acid markers linked to anti-obesity and anti-diabetes in mice. Biochim. Biophys. Acta – Mol. Cell Biol. Lipids. 2015;1851:19–29. doi: 10.1016/j.bbalip.2014.04.008. - DOI - PMC - PubMed

LinkOut - more resources