. 2018 Feb 8:7:e32838.
doi: 10.7554/eLife.32838.

MELK expression correlates with tumor mitotic activity but is not required for cancer growth

Affiliations

MELK expression correlates with tumor mitotic activity but is not required for cancer growth

Christopher J Giuliano et al. Elife. .

Abstract

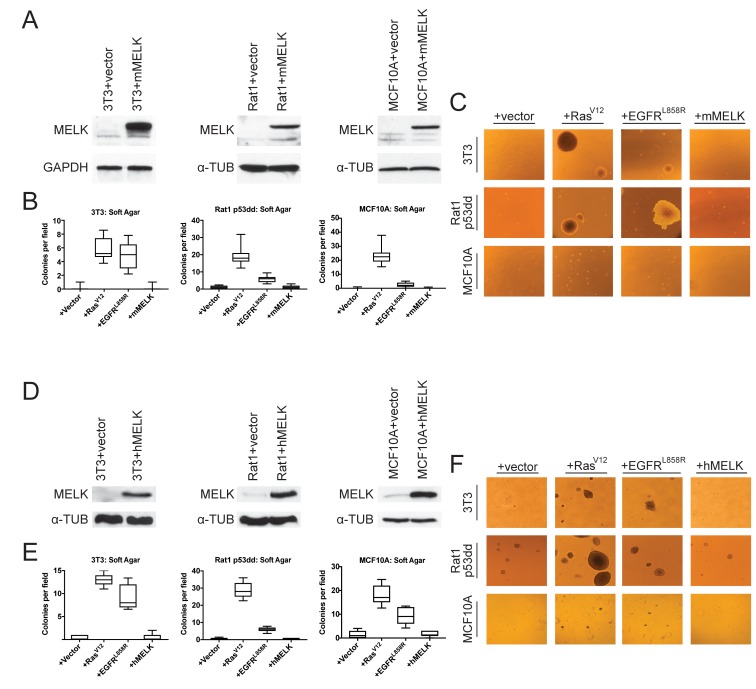
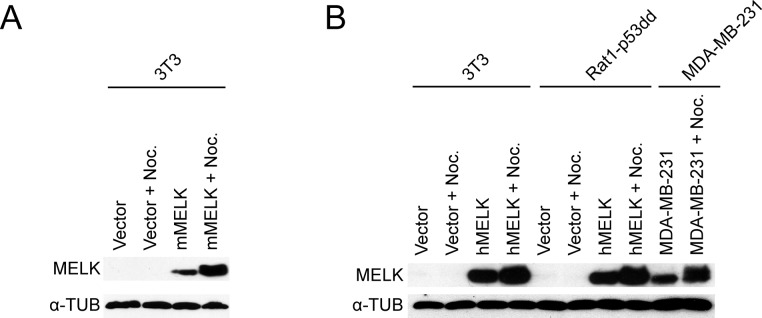
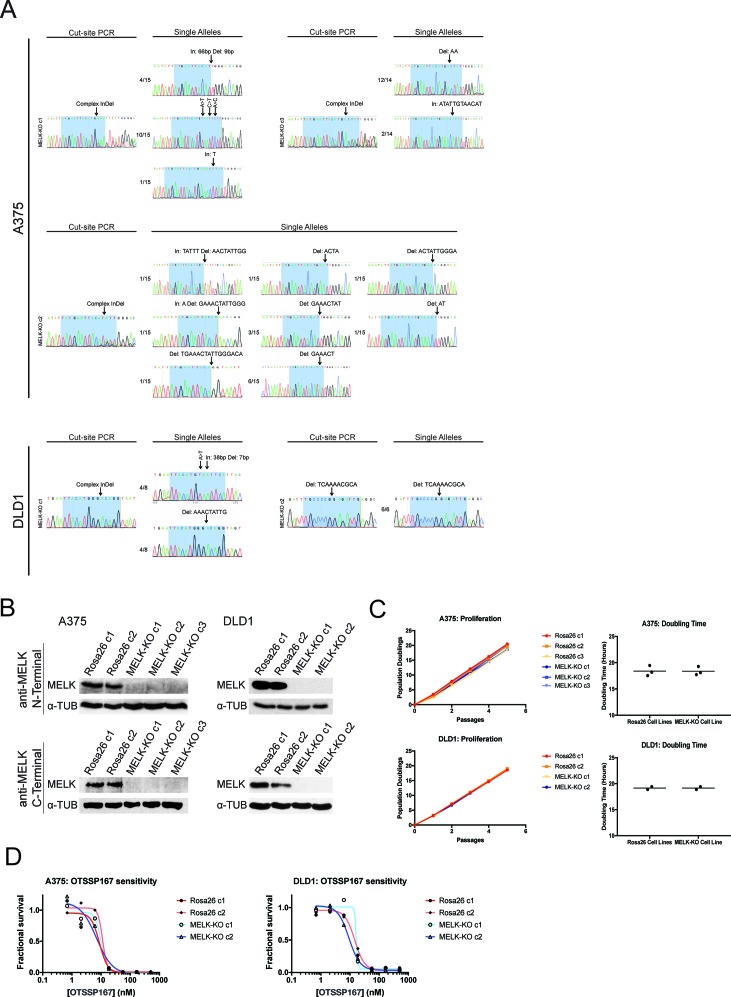
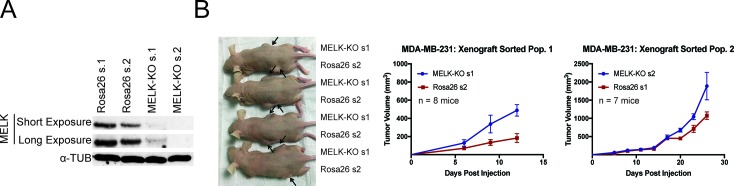
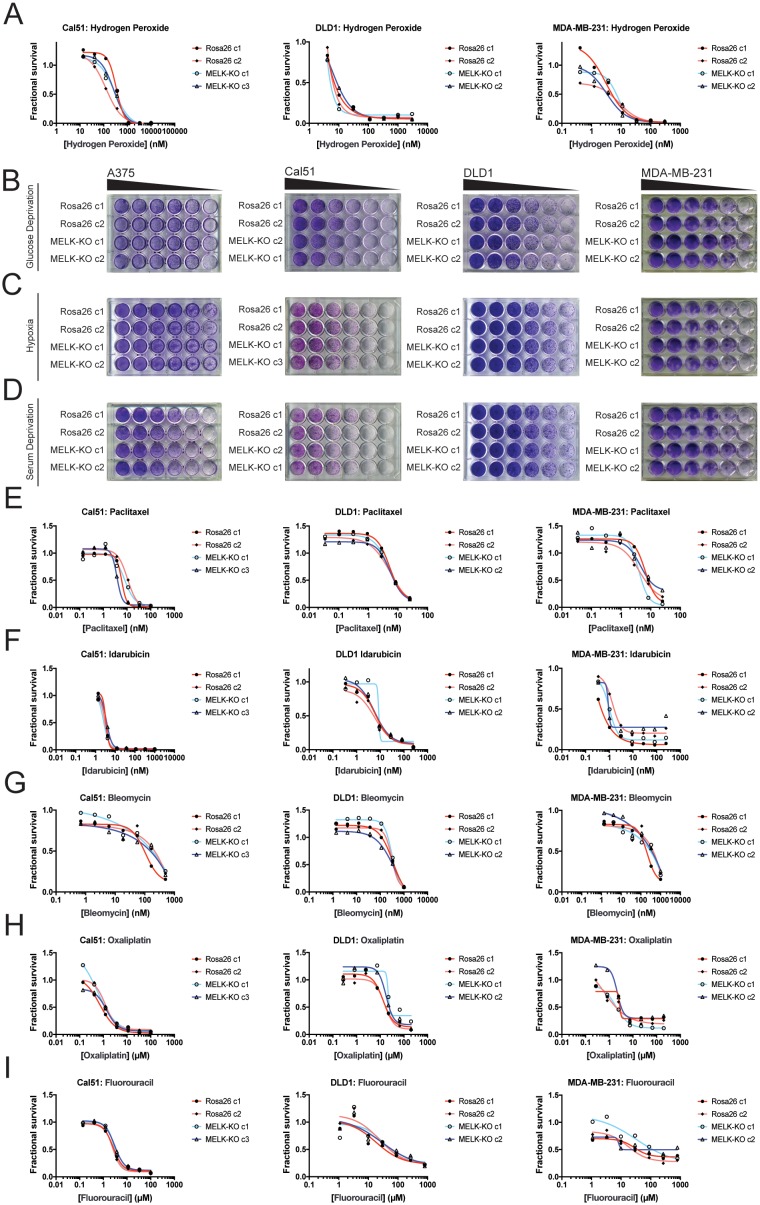
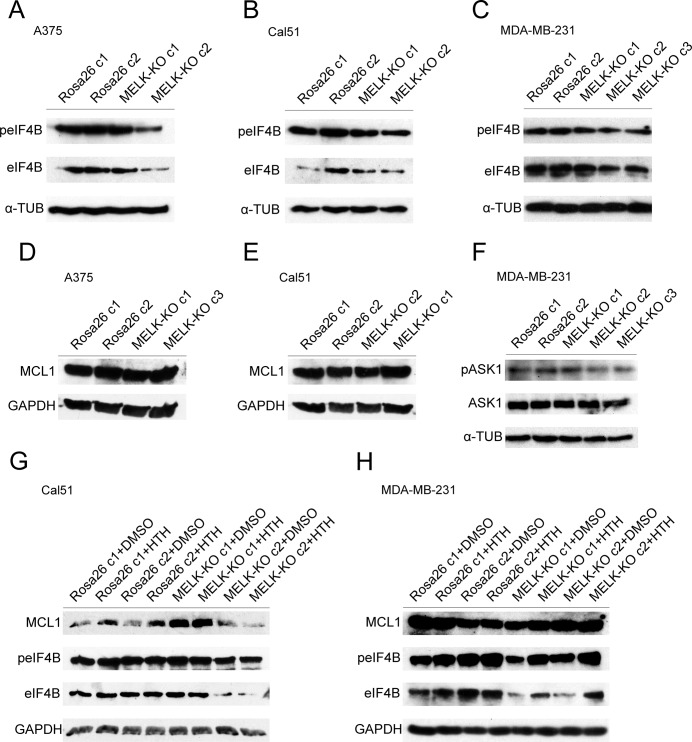
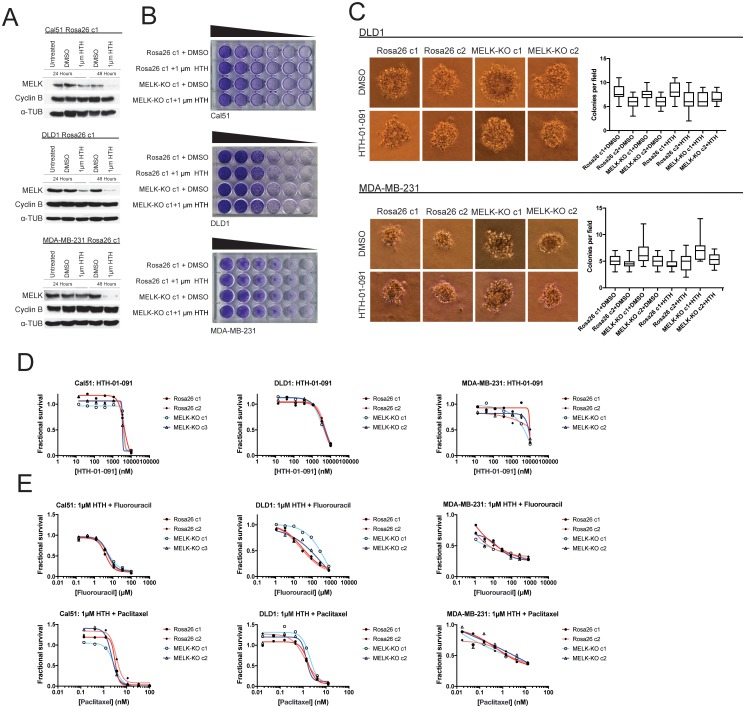
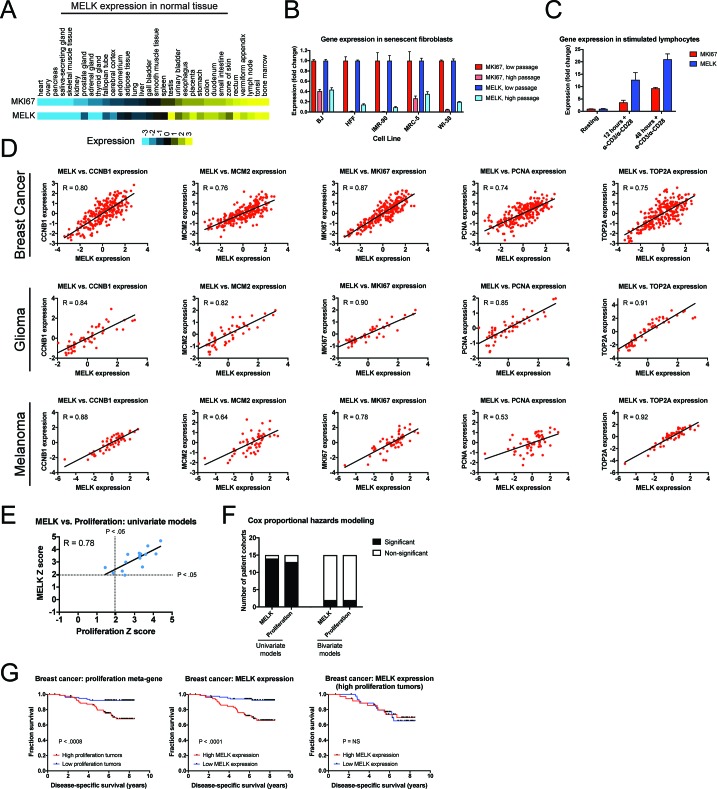
The Maternal Embryonic Leucine Zipper Kinase (MELK) has been identified as a promising therapeutic target in multiple cancer types. MELK over-expression is associated with aggressive disease, and MELK has been implicated in numerous cancer-related processes, including chemotherapy resistance, stem cell renewal, and tumor growth. Previously, we established that triple-negative breast cancer cell lines harboring CRISPR/Cas9-induced null mutations in MELK proliferate at wild-type levels in vitro (<xref ref-type="bibr" rid="bib34">Lin et al., 2017</xref>). Here, we generate several additional knockout clones of MELK and demonstrate that across cancer types, cells lacking MELK exhibit wild-type growth in vitro, under environmental stress, in the presence of cytotoxic chemotherapies, and in vivo. By combining our MELK-knockout clones with a recently described, highly specific MELK inhibitor, we further demonstrate that the acute inhibition of MELK results in no specific anti-proliferative phenotype. Analysis of gene expression data from cohorts of cancer patients identifies MELK expression as a correlate of tumor mitotic activity, explaining its association with poor clinical prognosis. In total, our results demonstrate the power of CRISPR/Cas9-based genetic approaches to investigate cancer drug targets, and call into question the rationale for treating patients with anti-MELK monotherapies.

Keywords: CRISPR/Cas9; biomarkers; cancer biology; cell cycle; drug targets; human; mitotic kinase.


Conflict of interest statement

CG, AL, AP, JS No competing interests declared, JS Joan C. Smith is affiliated with Google Inc. The author has no financial interests to declare.

Figures

Figure 1.
Figure 1.. MELK over-expression fails to confer anchorage-independent growth.
(A) Western blot analysis of mouse MELK over-expression in 3T3, Rat1-p53dd, and MCF10a cell lines. (B) Quantification of colony formation of control and mouse MELK over-expressing cell lines in soft agar. For each assay, colonies were counted in at least 15 fields under a 10x objective. Boxes represent the 25th, 50th, and 75th percentiles of colonies per field, while the whiskers represent the 10th and 90th percentiles. (C) Representative images of the indicated cell lines grown in soft agar. (D) Western blot analysis of human MELK over-expression in 3T3, Rat1-p53dd, and MCF10a cell lines. (E) Quantification of colony formation of control and human MELK over-expressing cell lines in soft agar. For each assay, colonies were counted in at least 15 fields under a 10x objective. Boxes represent the 25th, 50th, and 75th percentiles of colonies per field, while the whiskers represent the 10th and 90th percentiles. (F) Representative images of the indicated cell lines grown in soft agar.
Figure 1—figure supplement 1.
Figure 1—figure supplement 1.. Ectopically-expressed MELK exhibits a phospho-shift in mitosis.
(A) Western blot analysis of 3T3 cells transduced with mouse MELK or with an empty vector. The cells were grown asynchronously or arrested in mitosis with 300 ng/ml nocodazole for 18 hr. (B) Western blot analysis of 3T3 and Rat1-p53dd cells transduced with human MELK or with an empty vector, and the human breast cancer cell line MDA-MB-231. The cells were grown asynchronously or arrested in mitosis with 100 ng/ml nocodazole for 18 hr.
Figure 2.
Figure 2.. MELK is dispensable for growth in vitro and in vivo.
(A) Crystal violet staining of serial dilution plates of control and MELK knockout clones from A375 (melanoma), Cal51 (breast cancer), DLD1 (colorectal cancer), and MDA-MB-231 (breast cancer) cell lines. (B) Representative images of colonies of A375 control and MELK knockout clones grown in soft agar. (C) Quantification of colony formation in A375, DLD1, and MDA-MB-231 MELK-KO and control clones. For each assay, colonies were counted in at least 15 fields under a 10x objective. Boxes represent the 25th, 50th, and 75th percentiles of colonies per field, while the whiskers represent the 10th and 90th percentiles. (D–E) Representative images and quantification of mammosphere growth in Cal51 or MDA-MB-231 MELK-KO and control clones. For each assay, mammospheres were counted in at least six fields under a 10x objective. Boxes represent the 25th, 50th, and 75th percentiles of colonies per field, while the whiskers represent the 10th and 90th percentiles. (F–G) Representative images and quantification of xenograft growth in nude mice. Cal51 and MDA-MB-231 MELK-KO and control clones were injected subcutaneously into nude mice, and then tumor growth was measured every 3 days. Arrows indicate the location of the tumor. Error bars in the volume measurements indicate the standard error.
Figure 2—figure supplement 1.
Figure 2—figure supplement 1.. Generation and characterization of MELK-KO clones in A375 and DLD1.
(A) Sanger sequencing of either the PCR-amplified cut-site or single alleles isolated by TOPO cloning from MELK knockout clones in the A375 (melanoma) and DLD1 (colorectal cancer) cell lines. Highlighted regions indicate bases recognized by the gRNA. Of note, in A375 MELK-KO c2 we recovered seven different indel mutations in the MELK gene. We believe that at the time of single-cell sorting, one allele in this cell had acquired a small deletion that did not fully abolish gRNA recognition. Then, during clonal expansion, this allele underwent additional mutagenesis to generate the multiple large indels that we recovered. Additionally, in A375 MELK-KO c1, we identified one allele that had three different single-nucleotide substitutions that generated three independent missense mutations (E15V, T16I, I17L). These mutations occur in a highly-conserved region of the protein, and Ile17 is predicted to form a part of MELK’s ATP-binding domain, likely explaining why this allele is non-functional. (B) Western blot analysis of A375 and DLD1 MELK-KO clones using an antibody that recognizes an epitope in the MELK N-terminus (Abcam; Cat. No. ab108529) or an antibody that recognizes an epitope in the MELK C-terminus (Cell Signal; Cat. No. 2274S). (C) Proliferation and doubling time analysis of A375 and DLD1 Rosa26 and MELK-KO clones. (D) Dose-response curves of the putative MELK inhibitor OTS167 in A375 and DLD1 Rosa26 and MELK-KO clones.
Figure 2—figure supplement 2.
Figure 2—figure supplement 2.. MELK is dispensable for tumor formation in heterogeneous MDA-MB-231 populations.
(A) Western blot analysis of MDA-MB-231 cells transduced with guides targeting Rosa26 or MELK. (B) Representative images and quantification of xenograft growth in nude mice. MDA-MB-231 control and MELK-mutant populations were injected subcutaneously into nude mice, and then tumor growth was measured every 3 days. Mice injected with MDA-MB-231 sorted population one had to be euthanized 15 days post injection due to health issues. Arrows indicate the location of the tumor. Error bars in the volume measurements indicate the standard error.
Figure 3.
Figure 3.. MELK is not required for growth under stress.
(A) Dose-response curves of Cal51, DLD1, and MDA-MB-231 Rosa26 and MELK-KO clones grown in the presence of H2O2. (B–D) Crystal violet staining of A375, Cal51, DLD1, and MDA-MB-231 Rosa26 and MELK-KO clones grown as serial dilutions under the indicated stressful culture condition. (E–I) Dose-response curves of Cal51, DLD1, and MDA-MB-231 Rosa26 and MELK-KO clones grown in the presence of the indicated chemotherapy drug.
Figure 3—figure supplement 1.
Figure 3—figure supplement 1.. MELK is not required for the phosphorylation or expression of previously-reported targets.
(A–C) Western blot analysis of A375, Cal51, or MDA-MB-231 with antibodies against phospho-EIF4B and total EIF4B. (D–E) Western blot analysis of A375 or Cal51 with antibodies against MCL1. (F) Western blot analysis of MDA-MB-231 with antibodies against phospho-ASK1 and total ASK1. (G–H) Western blot analysis of Cal51 or MDA-MD-231 treated with 1 µM of HTH-01–091 with antibodies against MCL1, phospho-EIF4B and total EIF4B.
Figure 4.
Figure 4.. Acute inhibition of MELK fails to block growth.
(A) Western blot analysis of MELK expression levels during treatment with 1 µM HTH-01–091 in the Cal51, DLD1, and MDA-MB-231 Rosa26 clonal cell lines. (B) Crystal violet staining of Cal51, DLD1, and MDA-MB-231 Rosa26 and MELK-KO cell lines grown as serial dilutions in the presence of DMSO or 1 µM HTH-01–091. (C) Quantification and representative images of colony formation of DLD1 and MDA-MB-231 Rosa26 and MELK-KO clones in soft agar in the presence of DMSO or 1 µM HTH-01–091. (D) Dose-response curves of Cal51, DLD1, and MDA-MB-231 Rosa26 and MELK-KO clones grown in the presence of HTH-01–091. (E) Dose-response curves of Cal51, DLD1, and MDA-MB-231 Rosa26 and MELK-KO clones grown in the presence of 1 µm HTH-01–091 and the indicated chemotherapy drug.
Figure 5.
Figure 5.. MELK expression correlates with proliferation markers in vitro, in normal tissue, and in cancer.
(A) A heatmap of the expression of either MKI67 or MELK in normal tissue sorted according to MKI67 expression (Uhlén et al., 2015). (B) The expression level of either MKI67 or MELK is displayed in five different primary human fibroblast lines at either low passage (proliferating) or high passage (senescence) (Marthandan et al., 2015). (C) The expression level of either MKI67 or MELK is displayed in CD4 + lymphocytes resting or after stimulation with α-CD3/α-CD28 beads (Abbas et al., 2005). (D) The expression level of MELK is plotted against the expression of five common proliferation markers in cohorts of patients with breast cancer, glioma, or melanoma (Sabatier et al., 2011; Turcan et al., 2012; Jönsson et al., 2010). Black lines represent linear regressions plotted against the data. (E) Univariate Cox proportional hazards models were calculated for the 15 breast cancer cohorts listed in Supplementary file 3. For each cohort, the expression of either MELK or the average expression of CCNB1, MCM2, MKI67, PCNA, and TOP2A in each tumor was regressed against patient outcome. Dotted lines represent Z scores of 1.96, corresponding to a p-value of 0.05. The black line represents a linear regressions plotted against the data. (F) Bar graphs depict the number of cohorts in which MELK and a proliferation meta-gene are significantly associated with poor outcome in either univariate or bivariate models. The full results are presented in Supplementary file 3 and Supplementary file 4. (G) Kaplan-Meier curves displaying disease-specific survival in one breast cancer cohort (Pawitan et al., 2005). Patients were split into two populations based on the average expression of either MELK or the five-gene proliferation meta-gene.

Comment in

References

    1. Abbas AR, Baldwin D, Ma Y, Ouyang W, Gurney A, Martin F, Fong S, van Lookeren Campagne M, Godowski P, Williams PM, Chan AC, Clark HF. Immune response in silico (IRIS): immune-specific genes identified from a compendium of microarray expression data. Genes & Immunity. 2005;6:319–331. doi: 10.1038/sj.gene.6364173. - DOI - PubMed
    1. Badouel C, Chartrain I, Blot J, Tassan JP. Maternal embryonic leucine zipper kinase is stabilized in mitosis by phosphorylation and is partially degraded upon mitotic exit. Experimental Cell Research. 2010;316:2166–2173. doi: 10.1016/j.yexcr.2010.04.019. - DOI - PubMed
    1. Beke L, Kig C, Linders JT, Boens S, Boeckx A, van Heerde E, Parade M, De Bondt A, Van den Wyngaert I, Bashir T, Ogata S, Meerpoel L, Van Eynde A, Johnson CN, Beullens M, Brehmer D, Bollen M. MELK-T1, a small-molecule inhibitor of protein kinase MELK, decreases DNA-damage tolerance in proliferating cancer cells. Bioscience Reports. 2015;35:e00267. doi: 10.1042/BSR20150194. - DOI - PMC - PubMed
    1. Borowicz S, Van Scoyk M, Avasarala S, Karuppusamy Rathinam MK, Tauler J, Bikkavilli RK, Winn RA. The soft agar colony formation assay. Journal of Visualized Experiments. 2014;92:e51998. doi: 10.3791/51998. - DOI - PMC - PubMed
    1. Charafe-Jauffret E, Ginestier C, Iovino F, Wicinski J, Cervera N, Finetti P, Hur MH, Diebel ME, Monville F, Dutcher J, Brown M, Viens P, Xerri L, Bertucci F, Stassi G, Dontu G, Birnbaum D, Wicha MS. Breast cancer cell lines contain functional cancer stem cells with metastatic capacity and a distinct molecular signature. Cancer Research. 2009;69:1302–1313. doi: 10.1158/0008-5472.CAN-08-2741. - DOI - PMC - PubMed

Publication types

Substances