Comparative Study
. 2018 Apr;16(4):734-748.
doi: 10.1111/jth.13968. Epub 2018 Mar 12.

Evolutionary conservation of the allosteric activation of factor VIIa by tissue factor in lamprey

Affiliations
Comparative Study

Evolutionary conservation of the allosteric activation of factor VIIa by tissue factor in lamprey

D L Beeler et al. J Thromb Haemost. 2018 Apr.

Abstract

Essentials Tissue factor (TF) enhances factor VIIa (FVIIa) activity through structural and dynamic changes. We analyzed conservation of TF-activated FVIIa allosteric networks in extant vertebrate lamprey. Lamprey Tf/FVIIa molecular dynamics show conserved Tf-induced structural/dynamic FVIIa changes. Lamprey Tf activation of FVIIa allosteric networks follows molecular pathways similar to human.

Summary: Background Previous studies have provided insight into the molecular basis of human tissue factor (TF) activation of activated factor VII (FVIIa). TF-induced allosteric networks of FVIIa activation have been rationalized through analysis of the dynamic changes and residue connectivities in the human soluble TF (sTF)/FVIIa complex structure during molecular dynamics (MD) simulation. Evolutionary conservation of the molecular mechanisms for TF-induced allosteric FVIIa activation between humans and extant vertebrate jawless fish (lampreys), where blood coagulation emerged more than 500 million years ago, is unknown and of considerable interest. Objective To model the sTf/FVIIa complex from cloned Petromyzon marinus lamprey sequences, and with comparisons to human sTF/FVlla investigate conservation of allosteric mechanisms of FVIIa activity enhancement by soluble TF using MD simulations. Methods Full-length cDNAs of lamprey tf and f7 were cloned and characterized. Comparative models of lamprey sTf/FVIIa complex and free FVIIa were determined based on constructed human sTF/FVIIa complex and free FVIIa models, used in full-atomic MD simulations, and characterized using dynamic network analysis approaches. Results Allosteric paths of correlated motion from Tf contact points in lamprey sTf/FVIIa to the FVIIa active site were determined and quantified, and were found to encompass residue-residue interactions along significantly similar paths compared with human. Conclusions Despite low conservation of residues between lamprey and human proteins, 30% TF and 39% FVII, the structural and protein dynamic effects of TF activation of FVIIa appear conserved and, moreover, present in extant vertebrate proteins from 500 million years ago when TF/FVIIa-initiated extrinsic pathway blood coagulation emerged.

Keywords: allosteric regulation; blood coagulation factors; factor VIIa; thromboplastin; tissue factor.


Conflict of interest statement

Disclosure of Conflict of Interests

The authors state that they have no conflict of interest.

Figures

Fig. 1
Fig. 1. Comparative functional clotting assays and domain structure of human and lamprey FVII and TF(Tf)
(A) PT assay of plasma from human and lamprey (Petromyzon marinus) using thromboplastin from rabbit (mammalian) or lamprey at room temperature. Data are presented as mean ± SD (n=3). (B) Lamprey f7 cDNA encodes a putative protein of 484 amino acids. Processing of a putative N-terminal 38-amino acid signal-prosequence (PRO) would result in a predicted protein of 446 amino acids with putative homologous post-translational modifications, including γ-carboxylation of glutamic acid residues in the N-terminal domain. Annotated with yellow circles are human Gla-residue modifications and conserved Glu residues in lamprey FVII that are putative Gla-residue modification sites. Identified domains are the γ-carboxyglutamic acid rich Gla domain (GLA), two EGF-like domains (EGF), and the trypsin-family serine protease (SP) domain. Lamprey tf cDNA encodes a putative protein of 295 amino acids. Processing of a putative N-terminal 24-amino acid signal sequence (SS) would result in a mature protein of 271 amino acids. Identified protein domains of lamprey Tf are the extracellular domain fibronectin type III N- and C-modules (N-module, C-module), transmembrane region (TM) and cytoplasmic region (C).
Fig. 2
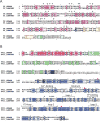
Fig. 2. Human and lamprey TF(Tf) and FVII sequence alignment
(A) Sequence alignment of human and lamprey TF. Boxed regions in aligned sequences, which are colored according to domain structure as in Fig. 1B. (magenta, N- and C-module; yellow-orange, TM; cyan, C), identify sequence conservation (color-shaded background) and sequence similarity (white background). (B) Sequence alignment of human and lamprey FVII. Boxed regions in aligned sequences, which are colored according to domain structure as in Fig. 1B. (red, GLA; green,EGF; blue, SP), identify sequence conservation (color-shaded background) and sequence similarity (white background). Important functional sub-regions of FVII SP domain are annotated. Gaps created in aligning sequences are indicated by (●). Crosses (black) denote residues in human TF extracellular domain or FVIIa serine protease which are in close contact in the X-ray structure of sTF/FVIIa (inhibited) complex.[10]
Fig. 3
Fig. 3. Lamprey tf and f7 expression in lamprey tissues
Quantitative PCR (qPCR) analysis of tf (A) and f7 (B) in lamprey organs and whole blood. mRNA expression is represented as copy number per 106 18S copies. Data are presented as mean ± SD (n=3 fish).
Fig. 4
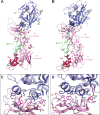
Fig. 4. Structural comparisons of human and lamprey sTF/FVIIa complexes
Structures of human (A) and lamprey (B) sTF/FVIIa complexes visualized using PyMol [67]. TF N- and C-modules (magenta), FVIIa Gla domain (red), EGFs (green), and heavy chain (blue) are shown in backbone cartoon representation. Catalytic triad residues of FVIIa serine protease (SP) domain are shown as sticks (orange). Bound and modeled calcium ions are shown as spheres (yellow). Residues involved in the sTF-FVIIa interaction interface are shown in sticks. Detailed inspection of the interface sub-region between TF N-module and FVIIa heavy chain (4.4 Å distance cutoff) in human (C) and lamprey (D) complexes. In both, two neighboring ‘key-and-lock’ interactions involving FVIIa catalytic domain residues Met306-Asp309 (TF-binding loop), Arg271 and Phe275-Phe278 in human FVIIa and Asp351-Gln354 and Arg319-Val322 in lamprey FVIIa, fit into and over the combined surface of TF N-module subregions within Gln37-Trp45, Leu72-Phe78, and Pro92-Asn96 in human TF, and Glu37, Thr42-Gln48, Arg76,Arg78 and Val90-Trp92 in lamprey Tf.
Fig. 5
Fig. 5. Structural dynamics in human and lamprey sTF/FVIIa complexes during MD simulation
Cα atom RMSDs verses simulation time (relative to the initial structure) for human (A) and lamprey (B) free (black) or sTF-bound (red) FVIIa heavy chain. Distances between catalytic site triad residues for human (C) and lamprey (D) free (black) or sTF-bound (red) FVIIa heavy chain. (E) Structural dynamics of the 170-loop and activation loops monitored by solvent accessible surface area (SASA) of FVIIa Trp364 (human) or Trp405 (lamprey), and (F) distances between side-chain atoms in FVIIa heavy chain verses time for human or lamprey free and sTF-bound FVIIa. Human distances from (green) Arg315N-Gly372C, (blue) Ser333Cβ-Gln313Cβ, (purple) Asp289Cβ-Thr370Cβ, and (black) Ile153N-Asp343CG. Lamprey distances from (green) Met359Cβ -Lys415Cβ, (blue) Glu374Cβ-Ala358Cβ, (purple) Glu334Cβ-Arg411Cβ, and (black) Val199N-Asp384CG. The latter distances (black) are to monitor the N-termini inserted positions as controls for human and lamprey FVIIa domain stability during MD simulation.
Fig. 6
Fig. 6. Conformational flexibility of FVIIa during MD simulation
The average root mean square deviation (RMSD) (A) and root mean square fluctuation (RMSF) (B) of residue Cα atom distances over the MD trajectory structures of free FVIIa (black) or sTF-bound FVIIa (red) are plotted versus residue number, for human and lamprey.
Fig. 7
Fig. 7. Conservation in TF-induced changes in the residue-residue covariance matrix for FVIIa serine protease during MD simulation
Maps of the dynamic cross-correlation matrices (DCCM) show the extent of correlation for all residue Cα pairs of human (A) free FVIIa and (B) sTF-bound FVIIa, and lamprey (C) free FVIIa and (D) sTf-bound FVIIa. FVIIa residues along the axes of each DCCM map are represented by FVIIa domain schematics. The DCCM diagonal represents the correlations between covalently bonded residues, while off-diagonal regions provide information of correlations across non-covalently bonded residues. Motion occurring along the same direction is represented by positive correlation (blue, +1.0), whereas anti-correlated motion is represented by negative correlation (red, -1.0).
Fig. 8
Fig. 8. Conserved pathway propagation of long-range allosteric signal from the TF interaction point to the FVIIa active site
Visualization of the five most-optimal pathways of long-range allosteric signal propagation within human (A,B) and lamprey (C,D) TF-bound FVIIa heavy chain using the dynamic network analysis tool WISP [53] in VMD [68] to determine the dynamic interdependence between residues in FVIIa across superposed MD simulation structure trajectories. Correlated motion among residue pairs, represented as nodes (spheres) positioned at the residue center of mass, and the interdependence in correlated motion among nodes, represented as connecting edges (spline lines) with associated numeric values reflecting the strength (thickness) of each edge. Pathway propagation from M306 in human and D351 in lamprey, to active site Asp/His residues [Pathway I] or to active site residue Ser [Pathway II], follows nearly identical pathways in human and lamprey TF-bound FVIIa heavy chain and along pathways of exclusively conserved residues. Pathway I: TF-contact point → Cys → Phe → Met → Thr → Asp/His; and Pathway II: TF-contact point → Cys → Ala → Tyr → Val → Ser. Pathway correlation strength is represented in color, from red (strongest) to yellow, and line thickness.

Comment in

Similar articles

Cited by

References

    1. Davidson CJ, Tuddenham EG, McVey JH. 450 million years of hemostasis. J Thromb Haemost. 2003;1:1487–94. - PubMed
    1. Davie EW, Fujikawa K, Kisiel W. The coagulation cascade: initiation, maintenance, and regulation. Biochemistry. 1991;30:10363–70. - PubMed
    1. Smith SA, Travers RJ, Morrissey JH. How it all starts: initiation of the clotting cascade. Critical reviews in biochemistry and molecular biology. 2015;50:326–36. - PMC - PubMed
    1. Chung DW, Xu W, Davie EW. The blood coagulation factors and inhibitors: their primary structure, complementary DNAs, genes, and expression. In: Marder VJ, Aird WC, Bennet JS, Schulman S, White GC, editors. Hemostasis and Thrombosis, Basic Principles and Clinical Practice. 6th. Philadelphia: Wolters Kluwer, Lippincott Williams & Wilkins; 2013. pp. 110–45.
    1. Morrissey JH, Broze GJ. Tissue factor and the initiation and regulation (TFPI) of coagulation. In: Marder VJ, Aird WC, Bennett JS, Schulman S, White GC, editors. Hemostasis and Thrombosis: Basic Principles and Clinical Practice. 6th. Philadelphia: Lippincott Williams & Wilkins; 2013.

Publication types

MeSH terms