

Deep sequencing and flow cytometric characterization of expanded effector memory CD8+CD57+ T cells frequently reveals T-cell receptor Vβ oligoclonality and CDR3 homology in acquired aplastic anemia
- PMID: 29419434
- PMCID: PMC5927970
- DOI: 10.3324/haematol.2017.176701
Deep sequencing and flow cytometric characterization of expanded effector memory CD8+CD57+ T cells frequently reveals T-cell receptor Vβ oligoclonality and CDR3 homology in acquired aplastic anemia
Abstract
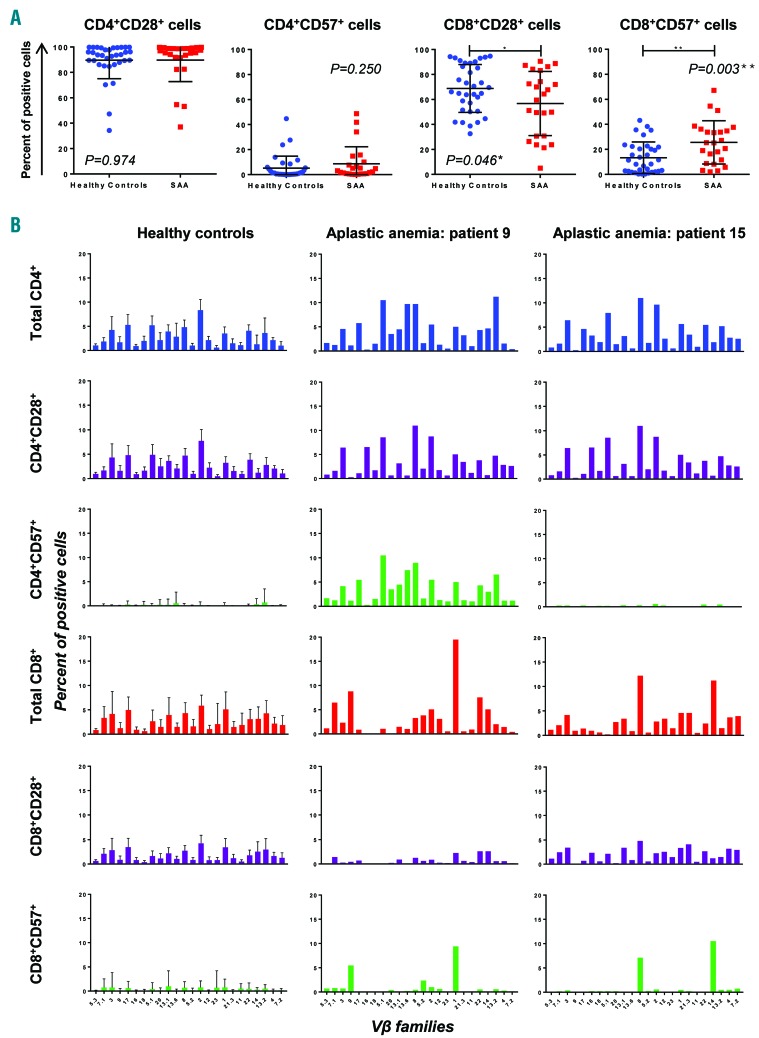
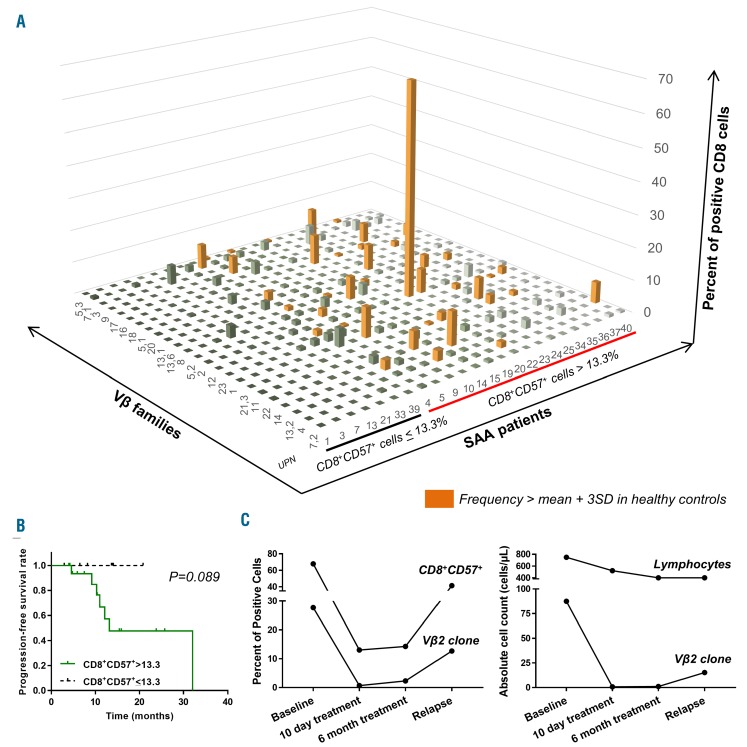
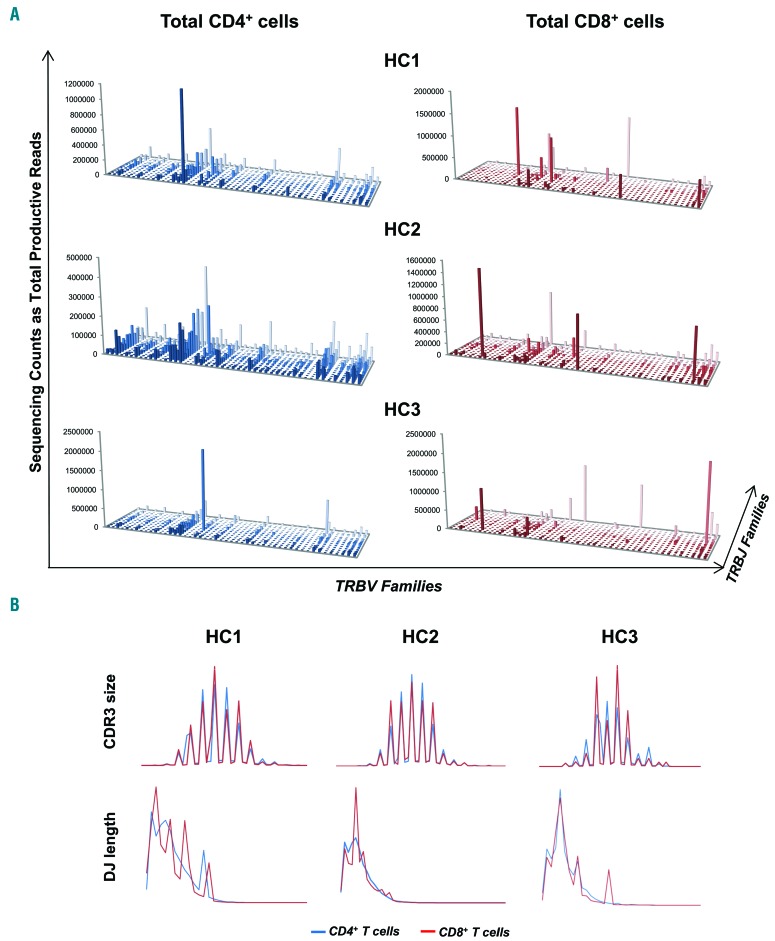
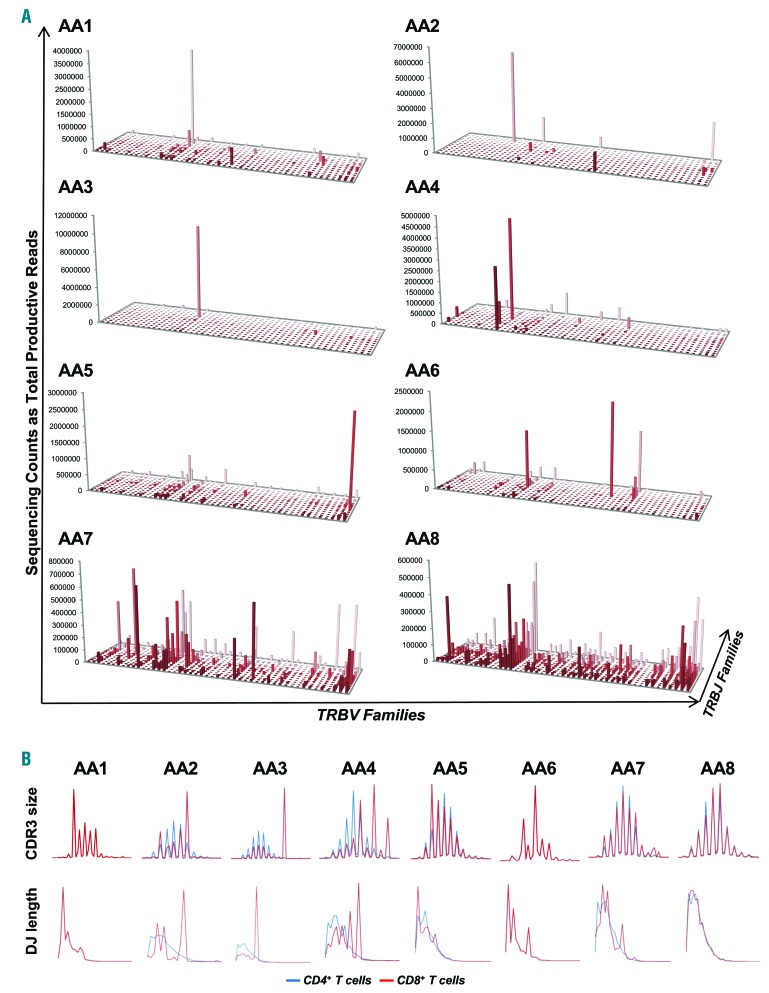
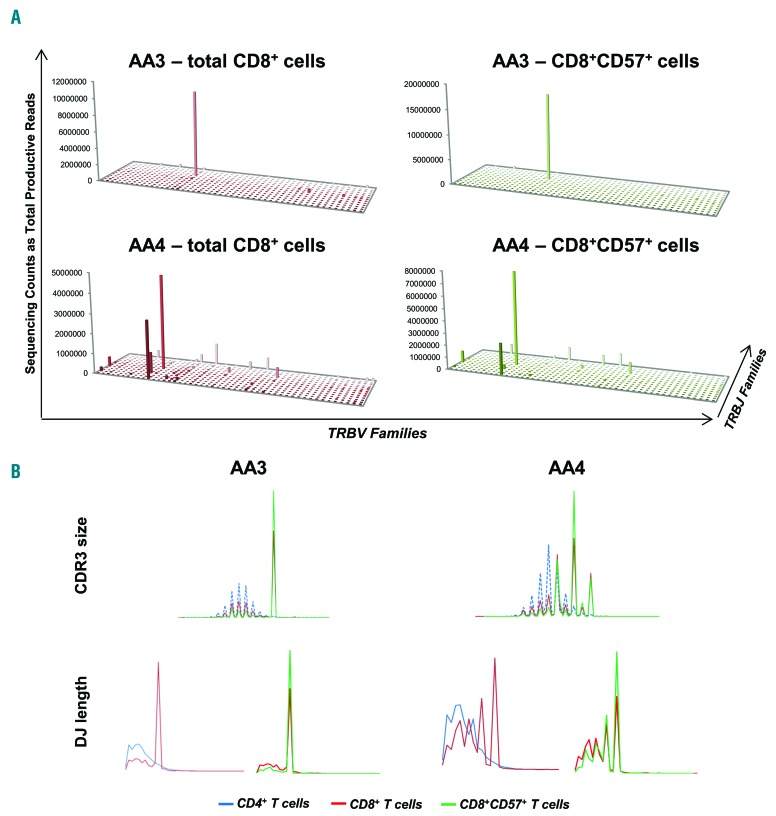
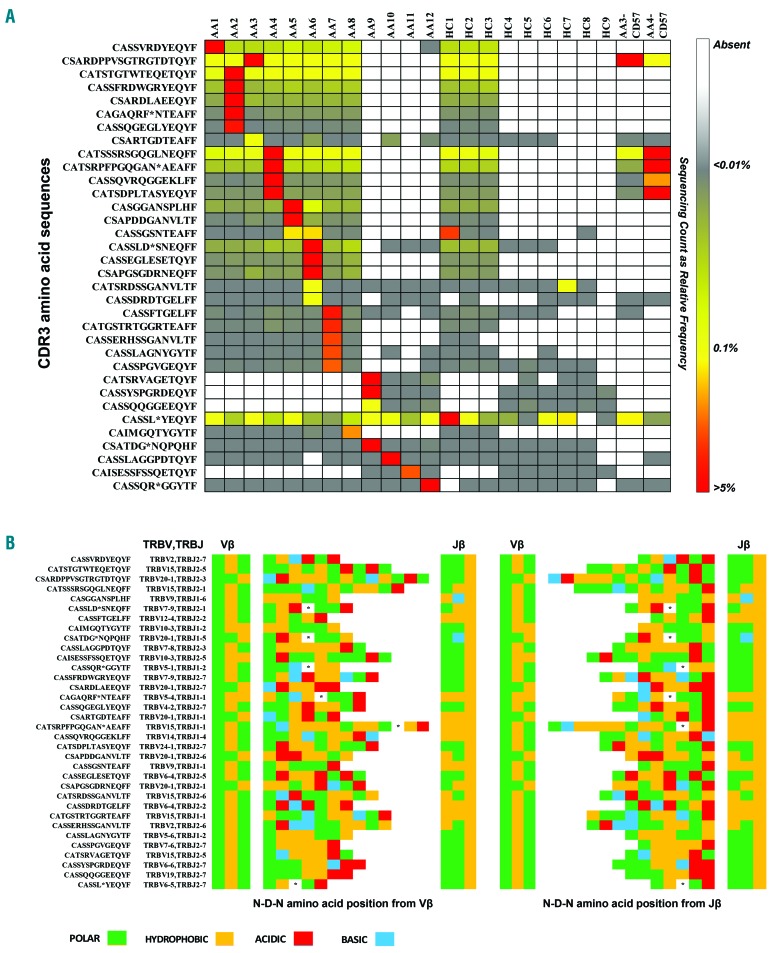
Oligoclonal expansion of CD8+ CD28- lymphocytes has been considered indirect evidence for a pathogenic immune response in acquired aplastic anemia. A subset of CD8+ CD28- cells with CD57 expression, termed effector memory cells, is expanded in several immune-mediated diseases and may have a role in immune surveillance. We hypothesized that effector memory CD8+CD28-CD57+ cells may drive aberrant oligoclonal expansion in aplastic anemia. We found CD8+CD57+ cells frequently expanded in the blood of aplastic anemia patients, with oligoclonal characteristics by flow cytometric Vβ usage analysis: skewing in 1-5 Vβ families and frequencies of immunodominant clones ranging from 1.98% to 66.5%. Oligoclonal characteristics were also observed in total CD8+ cells from aplastic anemia patients with CD8+CD57+ cell expansion by T-cell receptor deep sequencing, as well as the presence of 1-3 immunodominant clones. Oligoclonality was confirmed by T-cell receptor repertoire deep sequencing of enriched CD8+CD57+ cells, which also showed decreased diversity compared to total CD4+ and CD8+ cell pools. From analysis of complementarity-determining region 3 sequences in the CD8+ cell pool, a total of 29 sequences were shared between patients and controls, but these sequences were highly expressed in aplastic anemia subjects and also present in their immunodominant clones. In summary, expansion of effector memory CD8+ T cells is frequent in aplastic anemia and mirrors Vβ oligoclonal expansion. Flow cytometric Vβ usage analysis combined with deep sequencing technologies allows high resolution characterization of the T-cell receptor repertoire, and might represent a useful tool in the diagnosis and periodic evaluation of aplastic anemia patients. (Registered at clinicaltrials.gov identifiers: 00001620, 01623167, 00001397, 00071045, 00081523, 00961064).
Trial registration: ClinicalTrials.gov NCT00001620 NCT01623167 NCT00001397 NCT00071045 NCT00081523 NCT00961064.
Copyright © 2018 Ferrata Storti Foundation.
Figures
Comment in
-
(Auto-)immune signature in aplastic anemia.Haematologica. 2018 May;103(5):747-749. doi: 10.3324/haematol.2018.190884. Haematologica. 2018. PMID: 29712817 Free PMC article. No abstract available.
References
-
- Maciejewski JP, Selleri C, Sato T, Anderson S, Young NS. A severe and consistent deficit in marrow and circulating hematopoietic cells (long-term culture-initiating cells) in acquired aplastic anemia. Blood. 1996;88(6):1983–1991. - PubMed
-
- Maciejewski JP, Kim S, Sloand E, Selleri C, Young NS. Sustained long-term hematologic recovery despite a marked quantitative defect in the stem cell compartment of patients with aplastic anemia after immunosuppressive therapy. Am J Hematol. 2000;65(2):123–131. - PubMed
-
- Risitano AM, Maciejewski JP, Selleri C, Rotoli B. Function and malfunction of hematopoietic stem cells in primary bone marrow failure syndromes. Curr Stem Cell Res Ther. 2007;2(1):39–52. - PubMed
Publication types
MeSH terms
Substances
Associated data
LinkOut - more resources
Full Text Sources
Other Literature Sources
Medical
Molecular Biology Databases
Research Materials
