. 2018 May;159(5):968-977.
doi: 10.1097/j.pain.0000000000001171.

Neuroinflammation of the spinal cord and nerve roots in chronic radicular pain patients

Affiliations

Neuroinflammation of the spinal cord and nerve roots in chronic radicular pain patients

Daniel S Albrecht et al. Pain. 2018 May.

Abstract

Numerous preclinical studies support the role of spinal neuroimmune activation in the pathogenesis of chronic pain, and targeting glia (eg, microglia/astrocyte)- or macrophage-mediated neuroinflammatory responses effectively prevents or reverses the establishment of persistent nocifensive behaviors in laboratory animals. However, thus far, the translation of those findings into novel treatments for clinical use has been hindered by the scarcity of data supporting the role of neuroinflammation in human pain. Here, we show that patients suffering from a common chronic pain disorder (lumbar radiculopathy), compared with healthy volunteers, exhibit elevated levels of the neuroinflammation marker 18 kDa translocator protein, in both the neuroforamina (containing dorsal root ganglion and nerve roots) and spinal cord. These elevations demonstrated a pattern of spatial specificity correlating with the patients' clinical presentation, as they were observed in the neuroforamen ipsilateral to the symptomatic leg (compared with both contralateral neuroforamen in the same patients as well as to healthy controls) and in the most caudal spinal cord segments, which are known to process sensory information from the lumbosacral nerve roots affected in these patients (compared with more superior segments). Furthermore, the neuroforaminal translocator protein signal was associated with responses to fluoroscopy-guided epidural steroid injections, supporting its role as an imaging marker of neuroinflammation, and highlighting the clinical significance of these observations. These results implicate immunoactivation at multiple levels of the nervous system as a potentially important and clinically relevant mechanism in human radicular pain, and suggest that therapies targeting immune cell activation may be beneficial for chronic pain patients.


Figures
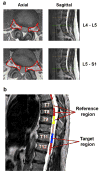
Figure 1
Figure 1. Visualization of spinal root and cord region of interest (ROI) placement
(a) Neuroforamina ROI labels. Right: Sagittal T2W images are shown to visualize the caudal/rostral level of ROI placement. Left: ROIs were manually drawn on the high-resolution T1W axial TSE sequence at the L3–L4, L4–L5, and L5–S1 levels (the latter two are pictured here). (b) Spinal cord ROI labels. Cord segments contained in T7, T8, and T9 served as the reference region segments contained in T11 and T12 were target regions, as this level of spinal cord receives nociceptive input from L4, L5, and S1 spinal roots.
Figure 2
Figure 2
Regional differences in spinal root [11C]PBR28 signal. (a) A linear mixed effects model showed that high-affinity binding patients had elevated tracer uptake on the side ipsilateral to pain, relative to the side contralateral to pain and to uptake in healthy controls. Boxes represent 25% – 75% interquartile range, and horizontal line represents the median. *t(27.4) = −3.09, P = 0.016; ** t(26) = −4.10, P < 0.001, corrected. (b) Between group comparison of spinal root SUVR (patients – target divided by reference neuroforamina SUV; controls – left divided by right neuroforamina SUV). Statistical results from a linear regression analysis are shown in Table 3. (c) Individual lumbar PET/MR scans from two subjects, matched for age (control – 49; patient – 47), sex (M), and TSPO genotype (HAB). On the right (pain patient), focal elevation of [11C]PBR28 uptake in the L4–L5 neuroforamen ipsilateral to the side of pain is highlighted by green arrowheads, compared to unaffected, contralateral side. This can be compared to the absence of neuroforaminal signal in the control subject’s scan (left). The dashed boxes in the top panels are enlarged in the middle (PET overlaid on MR) and bottom (MR only) panels. Note: the coronal sections are shown only for display purposes; all data were extracted from axial slices.
Figure 3
Figure 3
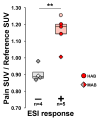
Comparison between spinal root laterality (target SUV / reference SUV) in ESI non-responders (n=4; mean relief 0 ± 0%) and ESI responders (n=5; mean relief 90 ± 11%). ESI responders have a ratio of pain SUV to reference SUV greater than 1, indicating that increased lateral uptake in roots ipsilateral to pain is associated with a positive response to ESI. This is true both when using prospective data alone (i.e., patients receiving the ESI after the PET/MR scan) and also when including two retrospective subjects, **t(4.99) = −3.94, P = 0.011; and t(6.27) = −5.13, P = 0.002, respectively, Welch two-sample t-test. HAB – high affinity binder; MAB – mixed-affinity binder. Light gray and light red identify a retrospectively-treated ESI non-responder and a responder, respectively.
Figure 4
Figure 4
Regional comparison of spinal cord [11C]PBR28 uptake. (a) A linear mixed effects model showed that patients had elevated SUV in spinal cord contained in T11–T12 vertebrae, relative to spinal cord contained in T7–T9 vertebrae in patients and to uptake in healthy controls. Boxes represent 25% – 75% interquartile range, and horizontal line represents the median. While a genotype interaction term was not retained in this statistical model as it did not improve model fit, data from HAB and MAB subjects are presented separately here for illustrative purposes, and for consistency with Figure 2a. #differences between target signal in patients and signal in healthy controls (main effect, irrespective of genotype), t(26.9) = −3.6, P = 0.002 (corrected); ##differences between target and reference in patients (irrespective of genotype), t(18) = −4.82, P < 0.001 (corrected). (b) Between group comparisons of spinal cord SUVR (SUV from cord contained in T11–T12 divided by SUV from cord contained in T7–T9). See Table 5 for the results from a linear regression analysis. While a genotype interaction term was not retained in this statistical model, data from HAB and MAB subjects here are presented separately for illustrative purposes, and for consistency with Figure 2b. ##differences between patient and control SUVR (main effect, irrespective of genotype) at P = 0.024 (Table 5). (c) Mean spinal cord PET SUVR images for both controls and patients. Coronal and axial slices in the middle and right of the panel show [11C]PBR28 data overlaid on the SCT T2 template. White dashed lines denote the borders of the spinal cord. A full-length image of the SCT T2 template on the left displays the spinal region common to all subjects (red overlay). The images shown here in SCT template space are for visualization purposes only, all data were extracted from images in subject space.
Figure 5
Figure 5. Relationship between spinal root and spinal cord SUVR
The association between spinal root and spinal cord SUVR was not significant with the inclusion of all pain patients for whom both root and spinal cord data were available (n=8). However, the regression became significant (F(1,5) = 17.13, P = 0.009, R2 = 0.77) after removal of one subject (bottom right). Notably, this subject did not receive any relief after ESI.

References

    1. Akaike H. Breakthroughs in statistics. Springer; 1992. Information theory and an extension of the maximum likelihood principle; pp. 610–624.
    1. Albrecht DS, Granziera C, Hooker JM, Loggia ML. In vivo imaging of human neuroinflammation. ACS chemical neuroscience. 2016;7(4):470–483. - PMC - PubMed
    1. Albrecht DS, Normandin MD, Shcherbinin S, Wooten DW, Schwarz AJ, Zurcher NR, Barth VN, Guehl NJ, Johnson-Akeju O, Atassi N, Veronese M, Turkheimer F, Hooker JM, Loggia ML. Pseudo-reference regions for glial imaging with 11C-PBR28: investigation in two clinical cohorts. J Nucl Med. 2017 - PMC - PubMed
    1. Aliyev A, Saboury B, Kwee TC, Torigian DA, Basu S, Wulff Christensen H, Alavi A. Age-related inflammatory changes in the spine as demonstrated by (18)F-FDG-PET:observation and insight into degenerative spinal changes. Hell J Nucl Med. 2012;15(3):197–201. - PubMed
    1. Alshikho MJ, Zurcher NR, Loggia ML, Cernasov P, Chonde DB, Izquierdo Garcia D, Yasek JE, Akeju O, Catana C, Rosen BR, Cudkowicz ME, Hooker JM, Atassi N. Glial activation colocalizes with structural abnormalities in amyotrophic lateral sclerosis. Neurology. 2016;87(24):2554–2561. - PMC - PubMed

MeSH terms