. 2018 Feb 8;19(2):519.
doi: 10.3390/ijms19020519.

Live Dynamics of 53BP1 Foci Following Simultaneous Induction of Clustered and Dispersed DNA Damage in U2OS Cells

Affiliations

Live Dynamics of 53BP1 Foci Following Simultaneous Induction of Clustered and Dispersed DNA Damage in U2OS Cells

Alice Sollazzo et al. Int J Mol Sci. .

Abstract

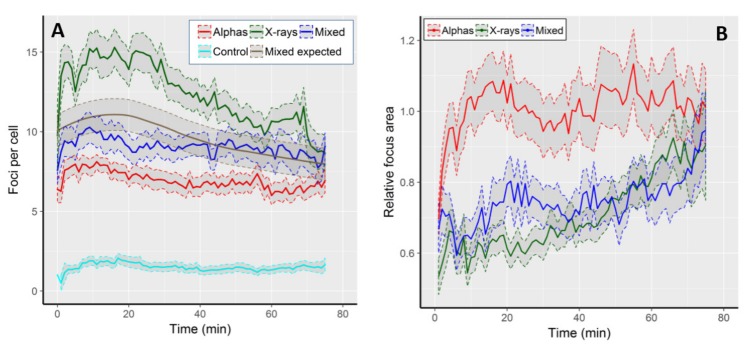
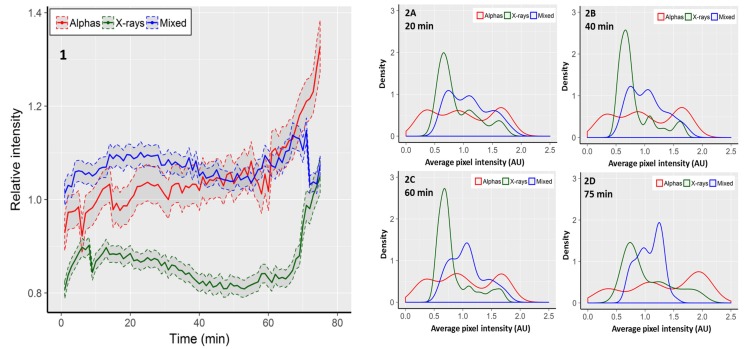
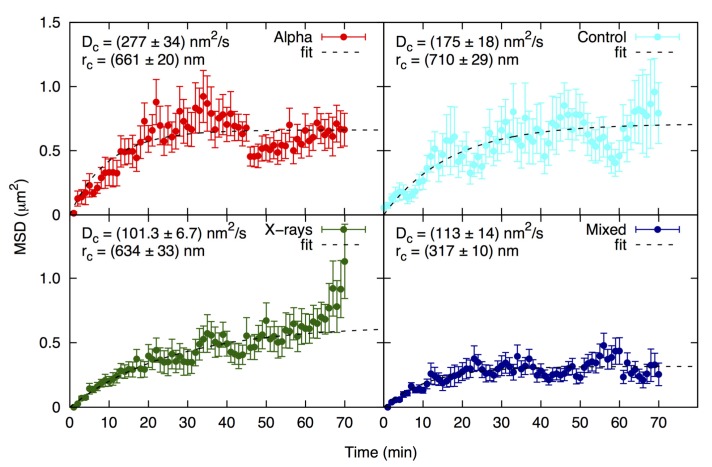
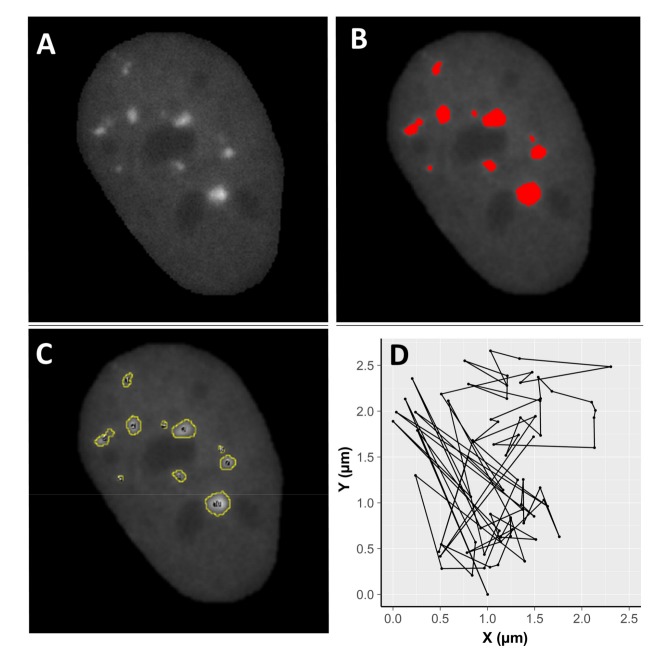
Cells react differently to clustered and dispersed DNA double strand breaks (DSB). Little is known about the initial reaction to simultaneous induction of DSBs with different complexities. Here, we used live cell microscopy to analyse the behaviour of 53BP1-GFP (green fluorescence protein) foci formation at DSBs induced in U2OS cells by alpha particles, X-rays or mixed beams over a 75 min period post irradiation. X-ray-induced foci rapidly increased and declined over the observation interval. After an initial increase, mixed beam-induced foci remained at a constant level over the observation interval, similarly as alpha-induced foci. The average areas of radiation-induced foci were similar for mixed beams and X-rays, being significantly smaller than those induced by alpha particles. Pixel intensities were highest for mixed beam-induced foci and showed the lowest level of variability over time as compared to foci induced by alphas and X-rays alone. Finally, mixed beam-exposed foci showed the lowest level of mobility as compared to alpha and X-ray exposure. The results suggest paralysation of chromatin around foci containing clustered DNA damage.

Keywords: 53BP1 foci; X-rays; alpha particles; clustered DSB; live cell imaging.


Conflict of interest statement

The authors declare no conflict of interest.

Figures

Figure 1
Figure 1
(A) Kinetics of 53BP1 focus frequency in control cells and following exposure to alpha particles, X-rays and mixed beams. The expected frequencies following mixed beam exposure were calculated as half of the sum of corresponding values from alpha and X-ray exposed cells, and are shown as a smooth grey curve. (B) Average, relative focus areas in cells exposed to alpha particles, X-rays, and mixed beams. Focus area is expressed as fraction of the respective control value. Shaded areas represent standard error of the mean.
Figure 2
Figure 2
1: Average, relative pixel intensity per focus. Intensity is expressed as fraction of the respective control value. Shaded areas represent standard error of the mean. Distributions of foci according to average relative pixel intensity observed after 20 min (2A), 40 min (2B), 60 min (2C), and 75 min (2D). Graphs show kernel density estimations normalised to an area under the curve equal to 1. The density values correspond to relative focus frequencies. The 0 AUs shown for alpha particles are the outcome of the smoothing procedure used for density estimations.
Figure 3
Figure 3
Mean square displacement (MSD) analysis of alpha (red), X-ray (green), mixed beam (dark blue)-induced foci, and control (light blue) foci. Dc = diffusion coefficient; rc = radius of constraint.
Figure 4
Figure 4
Examples of focus splitting (A), merging (B), and statistics (C). Arrows mark foci that split or merge. (A) foci induced by X-rays, (B) foci induced by alpha particles; (C) frequency of focus merging and splitting events per nucleus. “Merging and splitting” refers to foci that exhibited both behaviours. White arrows point at sites of foci splitting and merging. Error bars: standard deviation. * significant differences to control (one way ANOVA).
Figure 5
Figure 5
Example of image processing using Fiji. A cell nucleus after selection and filtering (A), focus recognition (B), and identification (C). Image (D) demonstrates two dimensional (X,Y) focus movement inside a nucleus stabilized by rigid body transformation (see Section 4. Materials and Methods). A total of 25 irradiated nuclei per radiation type and 30 control nuclei were analysed.

References

    1. Jeggo P.A., Lobrich M. Radiation-induced DNA damage responses. Radiat. Prot. Dosim. 2006;122:124–127. doi: 10.1093/rpd/ncl495. - DOI - PubMed
    1. Blackford A.N., Jackson S.P. ATM, ATR, and DNA-PK: The Trinity at the Heart of the DNA Damage Response. Mol. Cell. 2017;66:801–817. doi: 10.1016/j.molcel.2017.05.015. - DOI - PubMed
    1. Matsuoka S., Ballif B.A., Smogorzewska A., McDonald E.R., III, Hurov K.E., Luo J., Bakalarski C.E., Zhao Z., Solimini N., Lerenthal Y., et al. ATM and ATR substrate analysis reveals extensive protein networks responsive to DNA damage. Science. 2007;316:1160–1166. doi: 10.1126/science.1140321. - DOI - PubMed
    1. Dantuma N.P., van Attikum H. Spatiotemporal regulation of posttranslational modifications in the DNA damage response. EMBO J. 2016;35:6–23. doi: 10.15252/embj.201592595. - DOI - PMC - PubMed
    1. Schipler A., Iliakis G. DNA double-strand-break complexity levels and their possible contributions to the probability for error-prone processing and repair pathway choice. Nucleic Acids Res. 2013;41:7589–7605. doi: 10.1093/nar/gkt556. - DOI - PMC - PubMed

Substances

LinkOut - more resources