. 2018 Mar;13(3):478-494.
doi: 10.1038/nprot.2017.146. Epub 2018 Feb 8.

Structural prediction of protein models using distance restraints derived from cross-linking mass spectrometry data

Affiliations

Structural prediction of protein models using distance restraints derived from cross-linking mass spectrometry data

Zsuzsanna Orbán-Németh et al. Nat Protoc. 2018 Mar.

Erratum in

Abstract

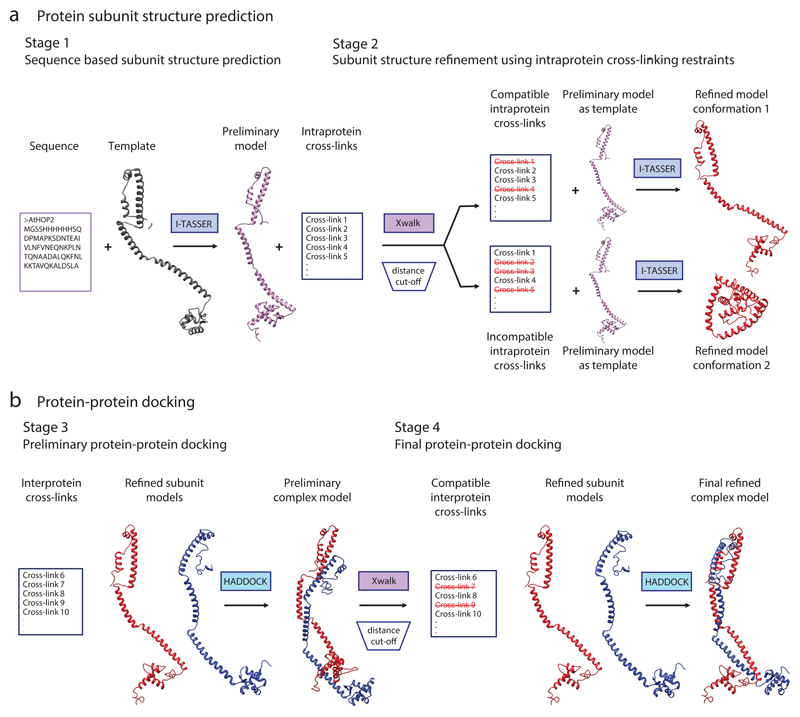
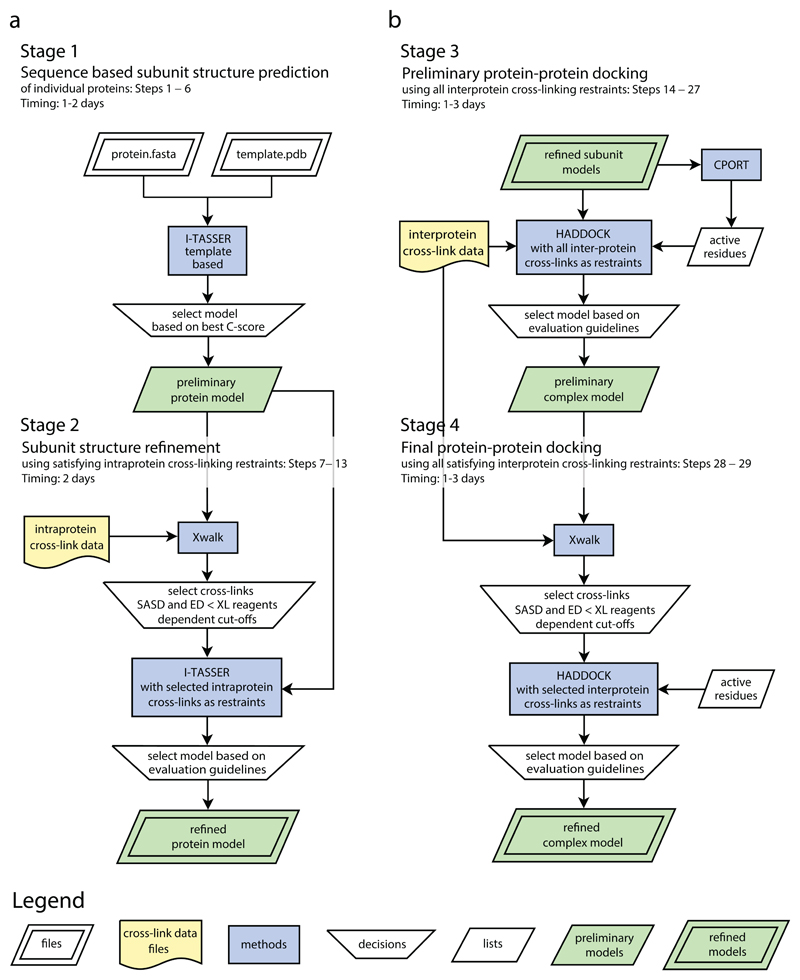
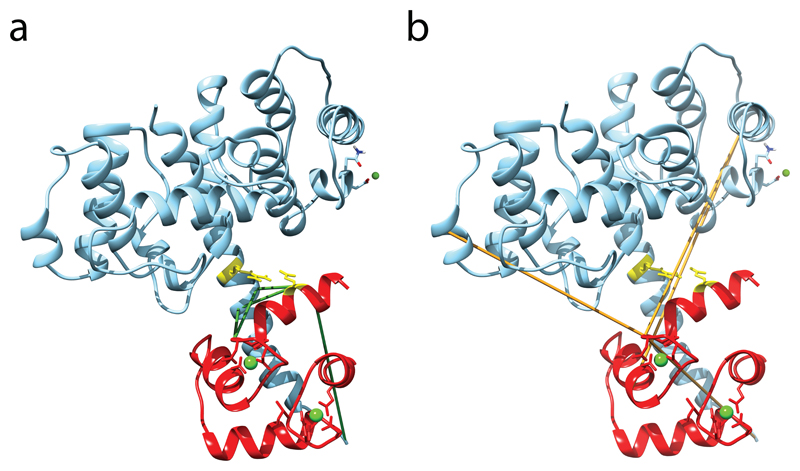
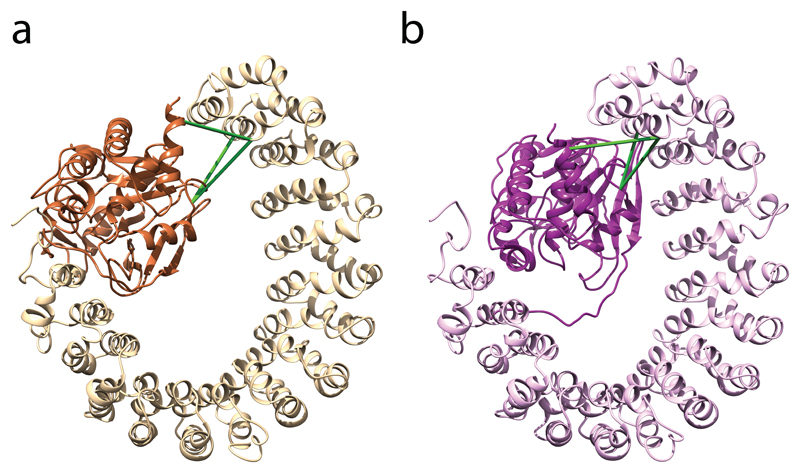
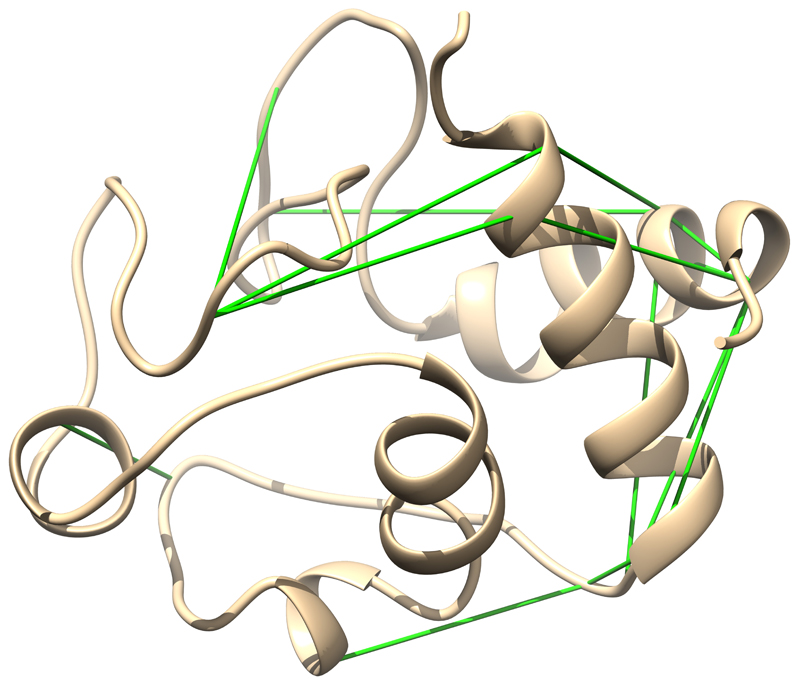
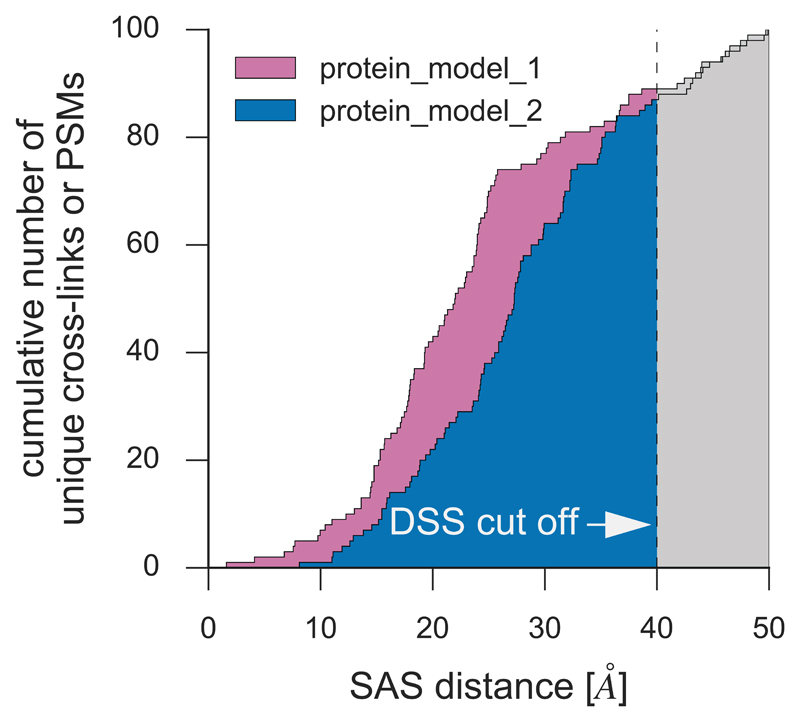
This protocol describes a workflow for creating structural models of proteins or protein complexes using distance restraints derived from cross-linking mass spectrometry experiments. The distance restraints are used (i) to adjust preliminary models that are calculated on the basis of a homologous template and primary sequence, and (ii) to select the model that is in best agreement with the experimental data. In the case of protein complexes, the cross-linking data are further used to dock the subunits to one another to generate models of the interacting proteins. Predicting models in such a manner has the potential to indicate multiple conformations and dynamic changes that occur in solution. This modeling protocol is compatible with many cross-linking workflows and uses open-source programs or programs that are free for academic users and do not require expertise in computational modeling. This protocol is an excellent additional application with which to use cross-linking results for building structural models of proteins. The established protocol is expected to take 6-12 d to complete, depending on the size of the proteins and the complexity of the cross-linking data.


Conflict of interest statement

Competing Financial Interests

The authors declare no competing financial interests.

Figures

Figure 1
Figure 1. Overview of the structural modeling workflow using XL-MS data.
(a) Schematic illustration of an example modeling procedure for protein subunit structure. Stage 1: a preliminary model of the protein is generated using the I-TASSER algorithm. Here, the structure is predicted on the basis of the primary amino acid sequence and the structure of a homologous template. Stage 2: the distances between the residues of the intraprotein cross-links are calculated within the preliminary model with Xwalk. The cross-links are subsequently divided according to their compatibility with the preliminary structure; those that bridge residues that are close together in 3D space are compatible with the model and are used to generate refined model 1. The cross-links that do not satisfy the model can be used to predict an alternative conformation (conformation 2, Stage 2). In this case, refined model conformation 1 corresponds to an open conformation, whereas refined model conformation 2 reflects a closed conformation. (b) Schematic illustration of the docking procedure for a protein dimer. Stage 3: a preliminary complex model is generated using the HADDOCK protein–protein docking tool, which combines the subunit structures obtained from Stage 2 with interprotein cross-link data. Stage 4: interprotein cross-links are divided according to their compatibility with the preliminary complex model. Compatible cross-links are used for a second round of protein complex docking with HADDOCK, generating the final refined protein complex model.
Figure 2
Figure 2. Cross-link data driven modeling workflow for predicting structures of proteins and protein complexes
(a) Comparative modeling of individual protein structures using XL-MS data. Stage 1: preliminary structural models of the protein subunits are generated using the I-TASSER algorithm, the amino acid sequence and a structural template. Stage 2: after selection of the best model on the basis of the C-score, the distances of the cross-links are calculated with Xwalk. The cross-links are subsequently sorted according to their compatibility with the predicted model. Selected cross-links are used for a second I-TASSER structure prediction run. The best model is selected on the basis of the C-score and the compatibility of the cross-links with the model (Box 1). (b) Two-step protein–protein docking leading to the refined complex structure. Stage 3: the preliminary complex structure is built with the HADDOCK protein–protein docking tool using the refined individual protein models, the interprotein cross-link data and the active residue information, generated by CPORT. The best preliminary model is selected on the basis of the HADDOCK score and the compatibility of the cross-links with the model. Stage 4: Optionally, a refined complex model is generated by a second HADDOCK run using selected cross-links. The final refined protein complex model is chosen according to the evaluation guidelines. Adapted with permission from ref. , American Chemical Society. Flowcharts were generated using Dia v0.97.2.
Figure 3
Figure 3. Chemical cross-links mapped onto the resulting comparative open protein-protein model of the HOP2-MND1 heterodimeric complex.
The distances between the cross-linked residues are depicted on the calculated structure. (a) A model of an ‘open’ conformation that is most similar to the template structure 4y66, with 45 matching interprotein cross-links shown in green. (b) The 22 incompatible cross-links shown in orange indicate the existence of a closed conformation. a adapted with permission from ref. , Copyright 2015 American Chemical Society.
Figure 4
Figure 4. Predicted protein structure of calmodulin.
(a) The 8 cross-links compatible with the structure are shown in green. (b) 12 incompatible cross-links are depicted in orange.
Figure 5
Figure 5. Predicted structure of the plectin ABD–calmodulin complex.
(a,b) Compatible (a) and incompatible (b) cross-links mapped onto the selected model of the complex between plectin ABD and the N-terminal lobe of calmodulin. The calmodulin chain is colored red. Compatible and incompatible cross-links are colored green and orange, respectively, and calcium and magnesium ions are shown as green balls. Residues E14 of calmodulin and R40 of plectin, the residues involved in the known salt bridge formation, are shown as sticks and are colored yellow.
Figure 6
Figure 6. Comparison of the predicted structure and the crystal structure of the PPP2R1A–PPP2CA complex.
(a) The predicted structure is the highest-scoring model that was calculated by HADDOCK using the cross-links shown in green as distance restraints. PPP2R1A and PPP2CA are colored light and dark, respectively. (b) The experimental cross-links are also shown on the crystal structure.
Figure 7
Figure 7. Predicted protein structure of bovine cytochrome C.
All 16 cross-links are compatible with the structure and are shown in green.
Figure 8
Figure 8. Simulated distribution of alpha-carbon distances between cross-linked residues in two resulting comparative models.
The plot depicts the cumulative number of DSS-derived cross-links that have an SASD less than or equal to a specified distance. Comparison of the plots for different structures (e.g. by calculating the normalized area under the resulting curve below a defined cut off value) facilitates best model selection at the evaluation step of the modeling workflow.

Comment in

  • Defining distance restraints in HADDOCK.
    Bonvin AMJJ, Karaca E, Kastritis PL, Rodrigues JPGLM. Bonvin AMJJ, et al. Nat Protoc. 2018 Jul;13(7):1503. doi: 10.1038/s41596-018-0017-6. Epub 2018 Jun 25. Nat Protoc. 2018. PMID: 29942005 No abstract available.

References

    1. Berman HM, et al. The Protein Data Bank. Nucleic Acids Res. 2000;28:235–242. - PMC - PubMed
    1. Leitner A, Faini M, Stengel F, Aebersold R. Crosslinking and Mass Spectrometry: An Integrated Technology to Understand the Structure and Function of Molecular Machines. Trends Biochem Sci. 2016;41:20–32. - PubMed
    1. Holding AN. XL-MS: Protein cross-linking coupled with mass spectrometry. Methods. 2015;89:54–63. - PubMed
    1. Herzog F, et al. Structural probing of a protein phosphatase 2A network by chemical cross-linking and mass spectrometry. Science. 2012;337:1348–1352. - PubMed
    1. Kahraman A, et al. Cross-link guided molecular modeling with ROSETTA. PLoS One. 2013;8:e73411. - PMC - PubMed

Publication types

MeSH terms

LinkOut - more resources