. 2018 Jan 23;22(4):1054-1066.
doi: 10.1016/j.celrep.2017.12.089. Epub 2018 Jan 28.

AP2σ Mutations Impair Calcium-Sensing Receptor Trafficking and Signaling, and Show an Endosomal Pathway to Spatially Direct G-Protein Selectivity

Affiliations

AP2σ Mutations Impair Calcium-Sensing Receptor Trafficking and Signaling, and Show an Endosomal Pathway to Spatially Direct G-Protein Selectivity

Caroline M Gorvin et al. Cell Rep. .

Abstract

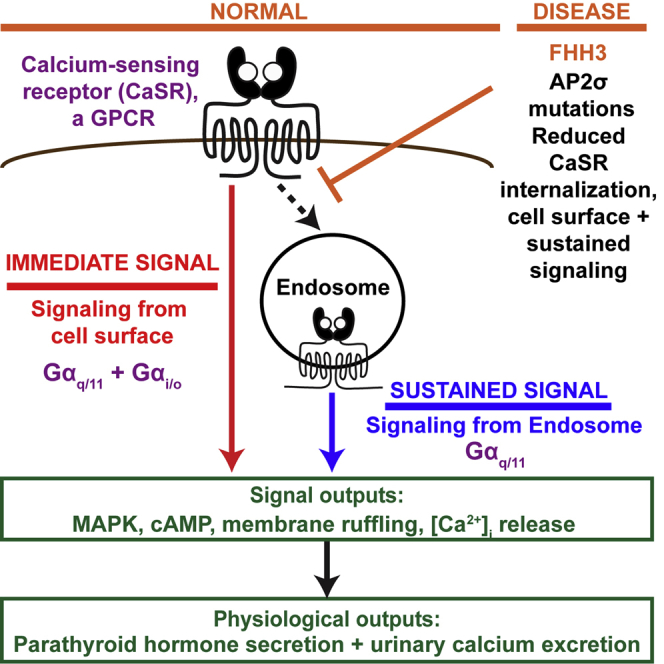
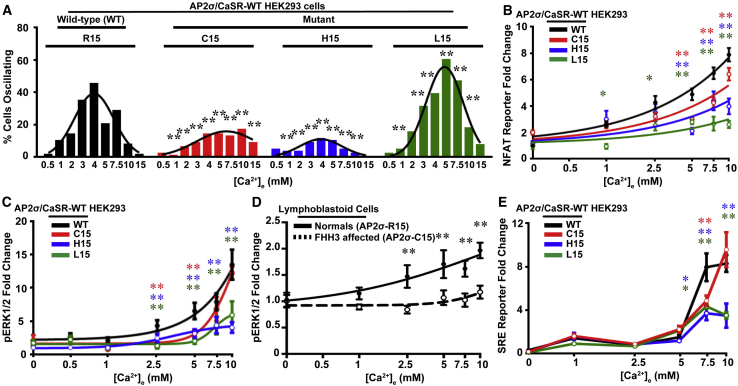
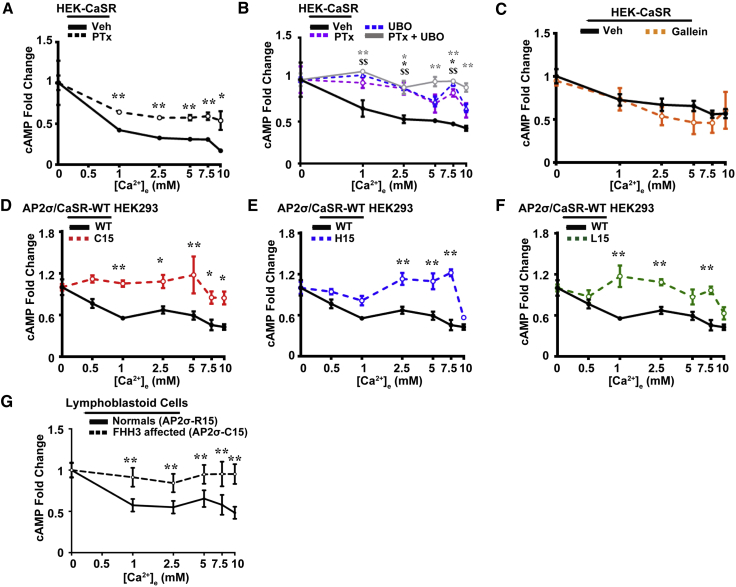
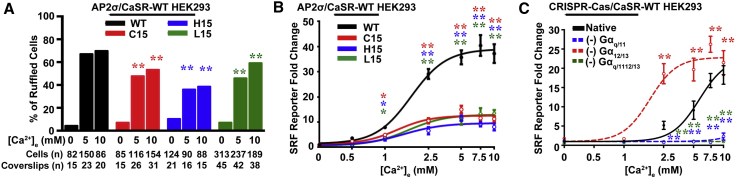
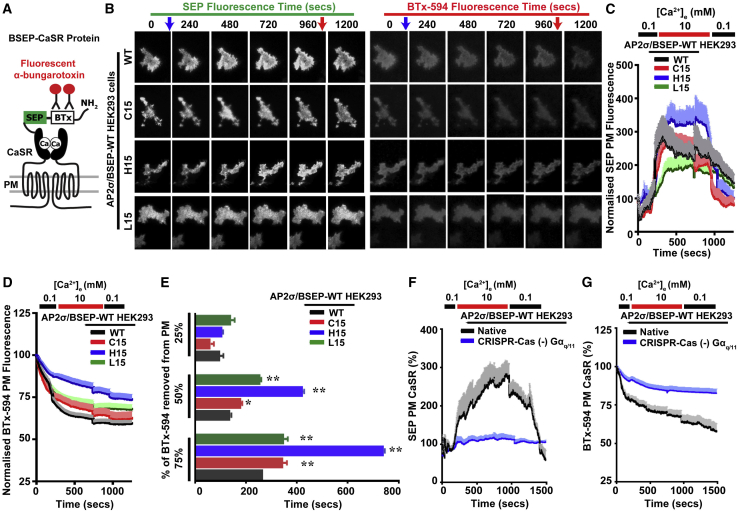
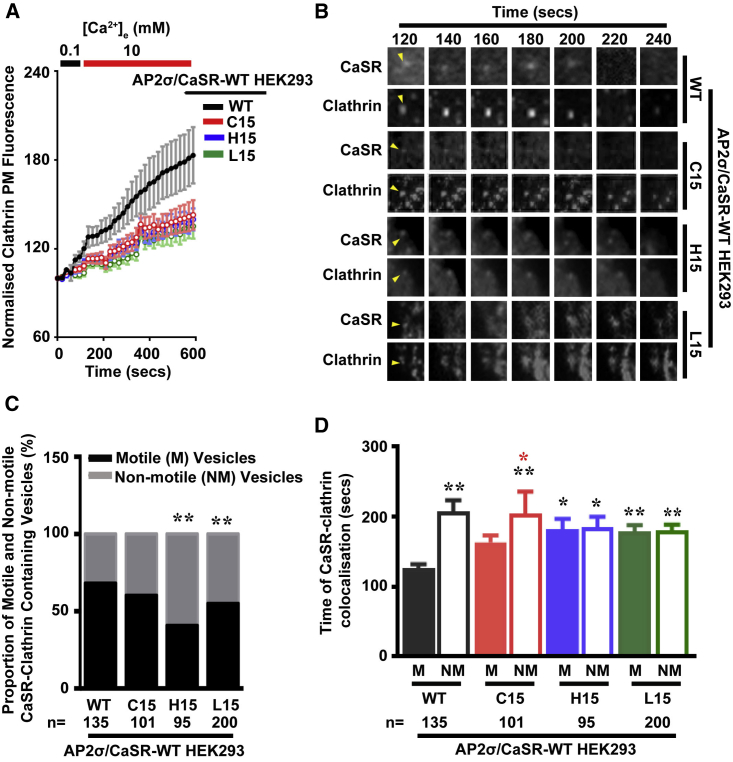
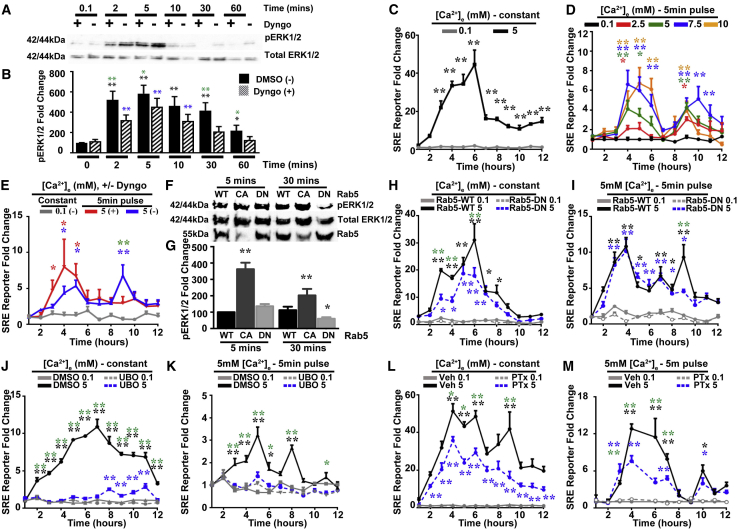
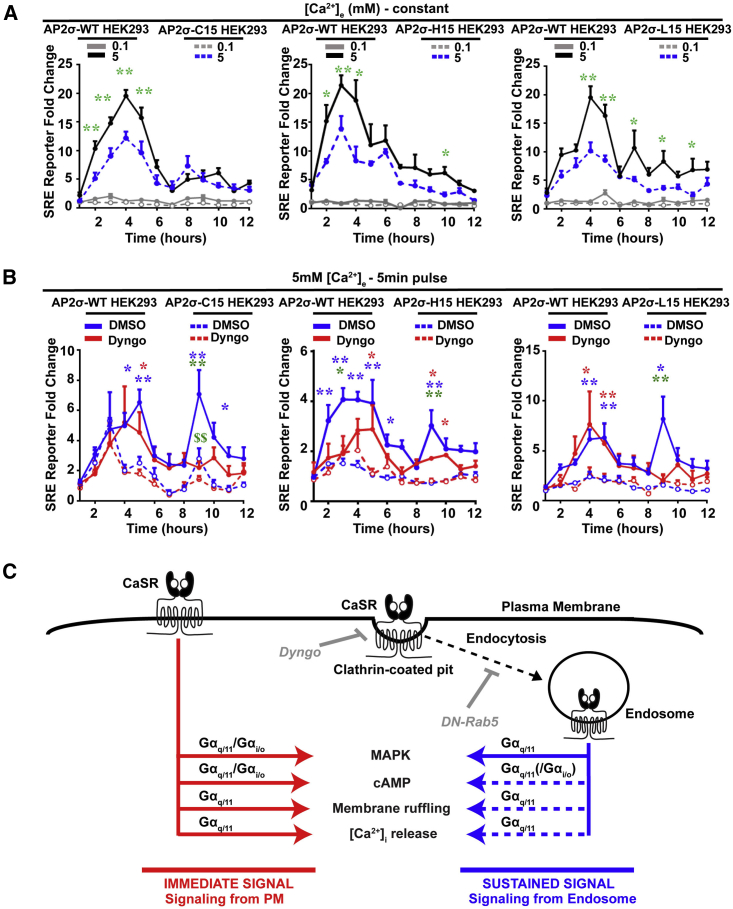
Spatial control of G-protein-coupled receptor (GPCR) signaling, which is used by cells to translate complex information into distinct downstream responses, is achieved by using plasma membrane (PM) and endocytic-derived signaling pathways. The roles of the endomembrane in regulating such pleiotropic signaling via multiple G-protein pathways remain unknown. Here, we investigated the effects of disease-causing mutations of the adaptor protein-2σ subunit (AP2σ) on signaling by the class C GPCR calcium-sensing receptor (CaSR). These AP2σ mutations increase CaSR PM expression yet paradoxically reduce CaSR signaling. Hypercalcemia-associated AP2σ mutations reduced CaSR signaling via Gαq/11 and Gαi/o pathways. The mutations also delayed CaSR internalization due to prolonged residency time of CaSR in clathrin structures that impaired or abolished endosomal signaling, which was predominantly mediated by Gαq/11. Thus, compartmental bias for CaSR-mediated Gαq/11 endomembrane signaling provides a mechanistic basis for multidimensional GPCR signaling.

Keywords: G proteins; GPCR; adaptor protein-2; calcium signaling; clathrin-mediated endocytosis; endosomal signaling; hypercalcemia.


Figures

None
Graphical abstract
Figure 1
Figure 1
AP2σ-R15 Mutations Impair Gαq/11 Signaling (A) Number of oscillating cells measured by normalized Fura-2 ratios in response to increasing doses of Ca2+e in single AP2σ/CaSR-WT HEK293 cells that stably expressed AP2σ-wild-type (WT; R15) or mutant (C15, H15, or L15) proteins and transiently expressed pEGFP-CaSR-WT (n = 36–50 cells from 9 to 10 transfections). ∗∗p < 0.02 versus WT (χ2 test) (Figures S1 and S2). (B) Ca2+e-induced NFAT luciferase reporter responses in AP2σ/CaSR-WT HEK293 cells (n = 8). (C) Ca2+e-induced phosphorylation of ERK1/2 (pERK1/2) measured by AlphaScreen (n = 4). AP2σ-WT/CaSR-WT cells had a dose-dependent increase in pERK1/2, which was reduced in AP2σ mutant/CaSR-WT cells within the range 2.5–5 mM Ca2+e in C15 cells and 2.5–10 mM Ca2+e in H15 and L15 cells. (D) Ca2+e-induced pERK1/2 responses measured by AlphaScreen in EBV-transformed lymphoblastoid cells from members of the FHH3 kindred in which affected members have AP2σ-C15 mutations (Figure S3). Unaffected (normal) relatives (AP2σ-R15) were used as controls (n = 4). (E) Ca2+e-induced SRE luciferase reporter responses in AP2σ/CaSR-WT HEK293 cells (n = 8). (B–E) Data are shown as mean ± SEM with p < 0.05 and ∗∗p < 0.02 (two-way ANOVA of WT versus mutants).
Figure 2
Figure 2
AP2σ-R15 Mutations Impair the Gαi/o Signaling Pathway Ca2+e-induced cAMP inhibition was measured by AlphaScreen. (A) Effect of ethanol-diluent (vehicle, veh) or pertussis toxin (PTx) on Ca2+e-induced cAMP inhibition in HEK-CaSR-WT cells. PTx inhibits Gαi/o-mediated, Ca2+e-induced cAMP reductions (n = 4). (B) Effect of veh, PTx, the Gαq/11 inhibitor UBO-QIC (UBO), or combined PTx and UBO treatment on Ca2+e-induced cAMP inhibition in HEK-CaSR-WT cells (n = 4). (C) Effect of DMSO (vehicle, veh) or the Gβγ inhibitor gallein on Ca2+e-induced cAMP inhibition in HEK-CaSR-WT cells. Gallein did not significantly alter Ca2+e-induced cAMP responses when compared to vehicle (n = 4). (D–F) Ca2+e-induced cAMP inhibition in AP2σ-WT/CaSR-WT and AP2σ mutant/CaSR-WT HEK293 cells. AP2σ mutant cells—(D) C15, (E) H15, and (F) L15—had impaired responses when compared to WT (AP2σ-R15) cells (n = 8–12). (G) Ca2+e-induced cAMP inhibition in EBV-transformed lymphoblastoid cells from FHH3 patients, with AP2σ-C15 mutation, and unaffected (normal) relatives (Figure S3). Data are shown as mean ± SEM with p < 0.05 and ∗∗p < 0.02 (two-way ANOVA comparing WT versus mutant in AP2σ HEK293 cells and normal versus FHH3 affected in lymphoblastoid cells). (B) shows vehicle versus PTx (black asterisk), UBO (dollar signs), and combined PTx and UBO (gray asterisks).
Figure 3
Figure 3
AP2σ-R15 Mutations Impair Membrane Ruffling via Reduction in Gαq/11 Signaling (A) Percentage of AP2σ/CaSR-WT cells with membrane ruffling (Figure S4) at each Ca2+e concentration measured. Numbers (n) of cells—AP2σ-WT (R15) or mutant (C15, H15, or L15)—and coverslips are indicated. ∗∗p < 0.02 (χ2 test). (B) Ca2+e-induced SRF luciferase reporter activity (n = 8). Responses were reduced in AP2σ mutant cells. (C) Ca2+e-induced SRF luciferase reporter activity in native HEK293 cells or CRISPR-Cas gene-edited HEK293 knockout cells of Gαq/11, Gα12/13, or Gαq/11/12/13 transfected with pEGFP-CaSR-WT. (−) denotes genes deleted. SRF reporter activity was abolished in cells depleted of Gαq/11 and Gαq/11/12/13 but elevated in cells depleted of Gα12/13. Data are shown as mean ± SEM (n = 8) with p < 0.05 and p < 0.02 (two-way ANOVA of WT, or native, versus mutant).
Figure 4
Figure 4
AP2σ-R15 Mutations Impair CaSR Internalization TIRF microscopy analyses in AP2σ-WT (R15) or mutant (C15, H15, or L15) HEK293 cells transfected with BSEP-CaSR. (A) Schematic diagram of BSEP-CaSR. BSEP-CaSR encodes CaSR with an N-terminal modification of a minimal bungarotoxin (BTx) binding site, to which BTx-594 binds to measure endocytosis, and superecliptic pHluorin (SEP), which maximally fluoresces at neutral pH and measures total cell surface CaSR. (B) TIRF microscopy images of SEP and BTx-594 fluorescence. Blue arrows indicate addition of 10 mM, and red arrows the return to 0.1 mM Ca2+e. (C and D) Quantification of fluorescence in each movie frame for (C) SEP and (D) BTx-594 images. [Ca2+]e is shown above. Data are normalized to the fluorescence in the first frame of each movie (set at 100%). Data are shown as mean + SEM. (E) Time taken to reduce BTx-594 expression by 25%, 50%, and 75%. (F and G) TIRF microscopy analyses in native HEK293 cells or CRISPR-Cas gene-edited HEK293 cells of Gαq/11 transfected with BSEP-CaSR. Quantification of fluorescence in each movie frame for (F) SEP and (G) BTx-594 images. [Ca2+]e is shown above. (−) denotes genes deleted. Cells depleted of Gαq/11 had impaired ADIS and endocytosis. Data are shown as mean + SEM with p < 0.05 and ∗∗p < 0.02 for comparison to WT (two-way ANOVA).
Figure 5
Figure 5
Impairments in CaSR Internalization Are due to Prolonged CaSR-Clathrin Colocalization TIRF microscopy analyses of colocalized CaSR (BSEP-CaSR) and Clathrin (dsRed-Clathrin) performed in AP2σ-WT (R15) or mutant (C15, H15, or L15) cells. (A) Quantification of clathrin fluorescence with changes in [Ca2+]e (shown above). Data are normalized to the fluorescence in the first frame of each movie (set at 100%). Data shown as mean ± SEM. (B) Images of CaSR and clathrin expression in single vesicles (yellow arrow). (C and D) Proportion of motile (M) versus non-motile (NM) CaSR and clathrin-containing vesicles (C), and duration of colocalization between CaSR and Clathrin in individual (motile, M, filled box, and non-motile, NM, open box) vesicles (D). Data from 95 to 200 vesicles (n = 14–16 recordings) are expressed as mean ± SEM with p < 0.05 and ∗∗p < 0.02 (two-way ANOVA) illustrated by black and red asterisks for WT motile versus mutant motile vesicles and C15 motile versus non-motile vesicles, respectively.
Figure 6
Figure 6
Second Signal of CaSR Is from the Rab5-Endosomal Internalization Pathway (A) Effects of dynamin inhibitor Dyngo on MAPK signaling by western blot analyses of pERK1/2 responses in HEK-CaSR cells treated with Dyngo (+) or DMSO (−), given a 5 min pulse of 5 mM Ca2+e, and then incubated in 0.1 mM Ca2+e. (B) Densitometry analysis showing data from blots (n = 8). Black and blue asterisks indicate p values of response versus response at 0 min for DMSO and Dyngo treated, respectively; green asterisks indicate DMSO versus Dyngo responses. (C) SRE luciferase reporter responses to treatment of either 0.1 or 5 mM Ca2+e over 12 hr in HEK-CaSR cells. Asterisks indicate p values of response versus response to 0.1 mM (n = 4). (D) SRE luciferase reporter activity in response to 5 min pulses of 0–10 mM Ca2+e in HEK-CaSR cells. Asterisks indicate p values of 0.1 mM responses versus 2.5 mM (red), 5 mM (green), 7.5 mM (blue), and 10 mM (yellow) (two-way ANOVA) (n = 4). Both initial and sustained peaks were enhanced by increasing concentrations of Ca2+e, which plateaued at 7.5 mM. Subsequent experiments were performed at Ca2+e = 5 mM. (E) SRE luciferase reporter responses to a 5 min pulse of 0.1 or 5 mM Ca2+e with DMSO (−) or Dyngo (+) in HEK-CaSR cells. DMSO (blue)-treated cells and Dyngo (red)-treated cells had a peak at 4 hr, while the second peak at 9 hr was abolished by treatment with Dyngo. Asterisks indicate p values of 0.1 mM Ca2+e versus DMSO (blue) or Dyngo (red) and DMSO versus Dyngo (green) (two-way ANOVA). (F) Western blot analysis of pERK1/2 responses in HEK-CaSR cells exposed for 5 or 30 min to 5 mM Ca2+e. Cells were transiently transfected with the Rab5 WT (S34/Q79) or the constitutively active (CA; L79) or dominant-negative (DN; N34) Rab5 mutants. (G) Densitometric analyses of pERK1/2 in western blots (n = 4). Asterisks indicate p values of mutants compared to WT responses at each time point (two-way ANOVA). Rab5-CA had higher expression of pERK1/2 after 5 and 30 min of treatment, while Rab5-DN had lower pERK1/2 responses after 30 min. (H) SRE luciferase reporter responses to treatment of 0.1 or 5 mM Ca2+e over 12 hr in HEK-CaSR cells transiently transfected with Rab5-WT or Rab5-DN mutant (n = 8). (I) SRE luciferase reporter response to 5 min pulses of 0.1 or 5 mM Ca2+e in HEK-CaSR cells transiently transfected with Rab5-WT or Rab5-DN mutant (n = 8). (J) SRE luciferase reporter responses to treatment of 0.1 or 5 mM Ca2+e over 12 hr in HEK-CaSR cells treated with DMSO or the Gαq/11 inhibitor UBO-QIC (UBO) (n = 4). (K) SRE luciferase reporter response to 5 min pulses of 0.1 or 5 mM Ca2+e in HEK-CaSR cells treated with DMSO or UBO (n = 4). (L) SRE luciferase reporter responses to treatment of 0.1 or 5 mM Ca2+e over 12 hr in HEK-CaSR cells treated with vehicle (Veh) or PTx, a Gαi/o inhibitor (n = 8). (M) SRE luciferase reporter response to 5 min pulses of 0.1 or 5 mM Ca2+e in HEK-CaSR cells treated with Veh or PTx (n = 8). Rab5-DN, UBO, and PTx all reduced constant Ca2+e responses. In (H)–(M), asterisks show basal 0.1 mM Ca2+e responses versus 5 mM Ca2+e responses in Rab5-WT-, DMSO-, or Veh-treated cells (black); basal 0.1 mM Ca2+e responses versus 5 mM Ca2+e responses in Rab5-DN-, UBO-, or PTx-treated cells (blue); and Rab5-WT versus Rab5-DN, DMSO versus UBO, or Veh versus PTx (green) (two-way ANOVA). ∗∗p < 0.02, p < 0.05. Rab5-DN and UBO reduced the sustained MAPK signal, while PTx had no effect on the sustained signal.
Figure 7
Figure 7
AP2σ-R15 Mutations Impair Sustained Signaling from Endosomes Studies of sustained signaling using SRE luciferase reporter assays in AP2σ-WT/CaSR-WT and AP2σ mutant/CaSR-WT HEK293 cells. (A) SRE luciferase reporter responses to constant treatment of 0.1 or 5 mM Ca2+e. Asterisks indicate p values for WT versus mutant responses (green) (n = 10–12). Statistical comparisons between 0.1 and 5 mM in the same cell type are not shown but were significantly greater for 5 mM in all cells between hours 2 and 11 (p < 0.05). Responses to 5 mM Ca2+e were significantly greater in AP2σ-WT (R15) cells compared to AP2σ mutant (C15, H15, and L15) cells. Data are shown as mean + SEM with p < 0.05, ∗∗p < 0.02 (two-way ANOVA). (B) SRE luciferase reporter response to 5 min pulses of 5 mM Ca2+e treated with DMSO (blue) or Dyngo (red) in AP2σ-WT or AP2σ mutant cells (n = 10–12). Blue and red asterisks indicate WT versus mutant cells treated with DMSO and with Dyngo, respectively, and green asterisks and dollar signs indicate WT DMSO versus WT Dyngo and mutant DMSO versus mutant Dyngo, respectively. Data are shown as mean + SEM with p < 0.05, ∗∗p < 0.02 or $$p < 0.02 (two-way ANOVA). (C) Summary of effects of AP2σ-R15 mutations on CaSR signaling pathways. CaSR is able to signal from the PM (red), using the Gαq/11 and Gαi/o pathways to enhance MAPK signaling and to reduce cAMP, and increase membrane ruffling and Ca2+i release, using Gαq/11. Following activation, CaSR is clustered into CCPs, before vesicle scission and internalization in clathrin-coated vesicles, and then into endosomes. Our results show that CaSR can induce sustained MAPK signaling (blue) from Rab5 endosomes and that FHH3-associated AP2σ mutations (C15, H15, and L15) impair all immediate signaling pathways (red) and impair or abolish sustained Gαq/11 signaling from the endosome, with responses of MAPK shown as a solid blue line (Figures 6 and 7) and other likely responses shown as a broken blue line and in parentheses. Pit invagination can be blocked by Dyngo, and maturation to Rab5-positive vesicles can be blocked by DN Rab5 mutant.

Similar articles

Cited by

References

    1. Avlani V.A., Ma W., Mun H.C., Leach K., Delbridge L., Christopoulos A., Conigrave A.D. Calcium-sensing receptor-dependent activation of CREB phosphorylation in HEK293 cells and human parathyroid cells. Am. J. Physiol. Endocrinol. Metab. 2013;304:E1097–E1104. - PubMed
    1. Bouschet T., Martin S., Kanamarlapudi V., Mundell S., Henley J.M. The calcium-sensing receptor changes cell shape via a beta-arrestin-1 ARNO ARF6 ELMO protein network. J. Cell Sci. 2007;120:2489–2497. - PMC - PubMed
    1. Calebiro D., Nikolaev V.O., Gagliani M.C., de Filippis T., Dees C., Tacchetti C., Persani L., Lohse M.J. Persistent cAMP-signals triggered by internalized G-protein-coupled receptors. PLoS Biol. 2009;7:e1000172. - PMC - PubMed
    1. Chakravarti B., Chattopadhyay N., Brown E.M. Signaling through the extracellular calcium-sensing receptor (CaSR) In: Signaling C., Islam M.S., editors. Advances in Experimental Medicine and Biology. Springer; 2012. pp. 103–142. - PubMed
    1. Clague M.J., Urbé S. The interface of receptor trafficking and signalling. J. Cell Sci. 2001;114:3075–3081. - PubMed

Publication types

MeSH terms

Substances