. 2018 Jan 23;22(4):860-868.
doi: 10.1016/j.celrep.2017.12.087. Epub 2018 Jan 28.

Asymmetric PI3K Activity in Lymphocytes Organized by a PI3K-Mediated Polarity Pathway

Affiliations

Asymmetric PI3K Activity in Lymphocytes Organized by a PI3K-Mediated Polarity Pathway

Yen-Hua Chen et al. Cell Rep. .

Abstract

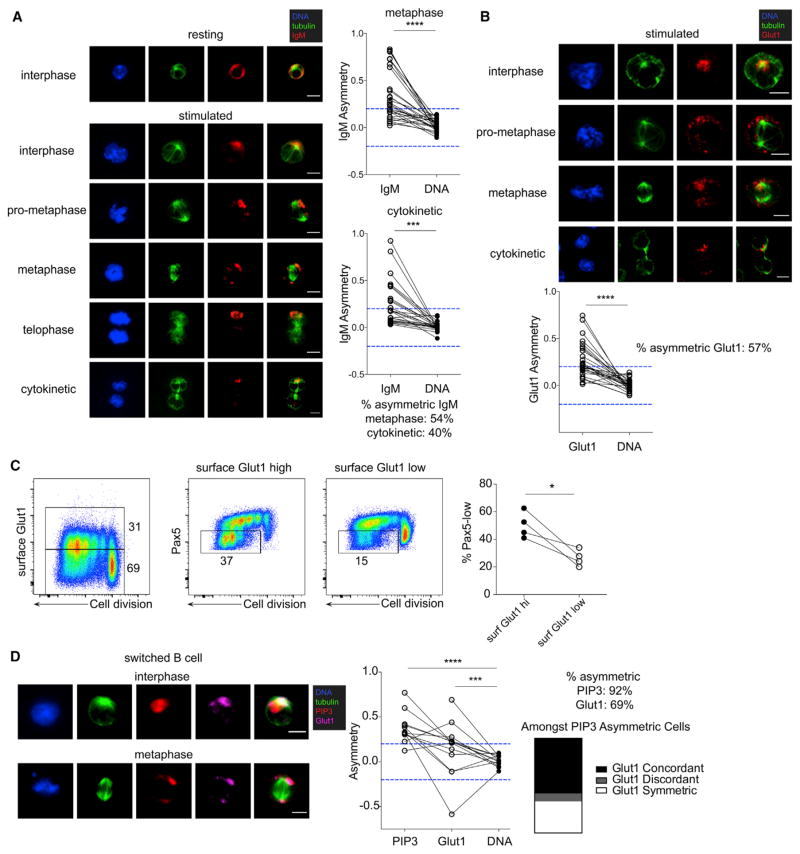
Unequal transmission of nutritive signaling during cell division establishes fate disparity between sibling lymphocytes, but how asymmetric signaling becomes organized is not understood. We show that receptor-associated class I phosphatidylinositol 3-kinase (PI3K) signaling activity, indexed by phosphatidylinositol (3,4,5)-trisphosphate (PIP3) staining, is spatially restricted to the microtubule-organizing center and subsequently to one pole of the mitotic spindle in activated T and B lymphocytes. Asymmetric PI3K activity co-localizes with polarization of antigen receptor components implicated in class I PI3K signaling and with facultative glucose transporters whose trafficking is PI3K dependent and whose abundance marks cells destined for differentiation. Perturbation of class I PI3K activity disrupts asymmetry of upstream antigen receptors and downstream glucose transporter traffic. The roles of PI3K signaling in nutrient utilization, proliferation, and gene expression may have converged with the conserved role of PI3K signaling in cellular symmetry breaking to form a logic for regenerative lymphocyte divisions.

Keywords: FoxO1; Pax5; TCF1; Warburg effect; actin; anabolism; asymmetric division; mTOR; stem cell.


Conflict of interest statement

DECLARATION OF INTERESTS

The authors declare no competing interests.

Figures

Figure 1
Figure 1. Asymmetric Division of Functional PI3K Activity in CD8+ T Cells
(A) Confocal immunofluorescence (IF) microscopy of CD3 localization in unstimulated (N = 16) or gp33 peptide-stimulated interphase P14 CD8+ T cells activated for 3 days (N = 23). (B) Top: CD3 and PIP3 localization in interphase and metaphase P14 blasts at day 3 post-activation. Bottom left: quantification of CD3 and PIP3 asymmetry in metaphase cells. ****p < 0.001. Chi-square test with Bonferroni correction. Bottom right: among PIP3 asymmetric cells, proportion with CD3 asymmetric concordant (same MTOC), CD3 asymmetric discordant (opposite MTOC), or CD3 symmetric localization. (C) Left: Glut1 localization in interphase and metaphase P14 blasts. Right: quantification of Glut1 asymmetry in metaphase cells. ****p < 0.001. Fisher’s exact test. (D) CD8+ T cells expressing myc-tagged Glut1 were stimulated with anti-CD3/CD28 + IL-2 for 3.5 days. Left: surface Glut1 versus cell division, gated for high and low populations. Middle: TCF1 expression versus cell division within surface Glut1-high and -low populations. Right: quantification of TCF1-low population frequency. *p < 0.05. Paired t test. For all panels, dashed blue line denotes an asymmetry cutoff value of 0.2, and scale bars are 5 μm. See also Figures S1 and S2.
Figure 2
Figure 2. Asymmetric Division of Functional PI3K Activity in B Cells
(A) Confocal IF microscopy analysis of IgM localization in LPS-stimulated B cells at day 3 post-activation. Left: IgM localization in unstimulated (resting) interphase (N = 16) or LPS-stimulated interphase and mitotic B cells (N = 19). Right: quantification of IgM asymmetry in metaphase and cytokinetic cells. ****p < 0.0001; ***p < 0.001. Fisher’s exact test. (B) Left: Glut1 localization in LPS-stimulated mitotic B cells at indicated stages of the cell cycle. Right: quantification of Glut1 asymmetry in metaphase cells. ****p < 0.0001. Fisher’s exact test. (C) B cells expressing myc-tagged Glut1 stimulated with LPS for 3.5 days. Left: surface Glut1 versus cell division, gated for high and low populations. Middle: Pax5 expression versus cell division within the surface Glut1-high and -low populations. Right: quantification of Pax5-low population frequency. *p < 0.05. Paired t test. (D) Class-switched (IgM negative), resting memory B cells stimulated with LPS and analyzed by IF microscopy on day 3 post-activation. Left: subcellular localization of PIP3 and Glut1 in interphase and metaphase blasts. Middle: quantification of PIP3 and Glut1 asymmetry in metaphase cells. ****p < 0.0001; ***p < 0.001. Chi-square test with Bonferroni correction. Right: among cells with asymmetric PIP3, proportion of asymmetric concordant, asymmetric discordant, and symmetric Glut1 localization. See also Figures S1 and S2.
Figure 3
Figure 3. PI3K-Dependent Polarity Control of Asymmetric PI3K Signaling
(A) P14 CD8+ T cells activated as in Figure 1 and treated with indicated drugs to perturb polarity. Left: CD3 localization in cells treated with no drug, LY294002, or myosin II inhibitor (Blebbistatin). Lower right: CD3 decentralization score. **p < 0.01; *p < 0.05. Kruskal-Wallis non-parametric test. (B) CD3 localization in metaphase cells treated with no drug or LY294002. Lower panel: quantification of CD3 asymmetry. **p < 0.01. Fisher’s exact test. (C) PIP3 localization in interphase CD8+ T cells treated with no drug or Blebbistatin. Lower panel: PIP3 decentralization score. ***p < 0.001. Mann-Whitney U test. (D) Class I PI3K-driven TCF1 repression and facultative glucose transporter function. Upper row: cell division and TCF1 expression at day 4 in the absence or presence of idelalisib (PI3Kδ inhibitor), pictilisib (pan-class I PI3K inhibitor), or LY294002 (pan-PI3K inhibitor). Lower left: quantification of surface Glut1 in P14 CD8+ T cells 3 days post-activation in the absence or presence of indicated inhibitors. Lower right: uptake of fluorescent glucose analog 2-NBDG in the absence or presence of the indicated inhibitors. *p < 0.05; **p < 0.01; ****p < 0.0001. One-way ANOVA. (E) Left: CD3 localization in interphase CD8+ T cells activated in the absence or presence of idelalisib or pictilisib. Middle: CD3 decentralization score. **p < 0.01; ***p < 0.001. Kruskal-Wallis non-parametric test. Far right: quantification of CD3 asymmetry in metaphase CD8+ T cells activated in the absence or presence of idelalisib. p = 0.05. Mann-Whitney U test. (F and G) Representative IF images and quantification of IgM asymmetry in LPS-activated B cells in the absence or presence of LY294002 at indicated stages of cell division. *p < 0.05 by Fisher’s exact test. (H) Representative images of Glut1 localization in interphase LPS-stimulated B cells in the absence or presence of LY294002. Decentralization score of indicated groups quantified beneath microscopy. **p < 0.01. Mann-Whitney U test. All error bars within this figure represent mean ± SEM. See also Figures S3 and S4.
Figure 4
Figure 4. Asymmetric PI3K Activity Organizing Unequal Inheritance of Antigen Receptor and Glucose Transporter In Vivo
(A) Polarization and asymmetric inheritance of CD3 and PIP3 in interphase and metaphase P14 CD8+ T cells in vivo during L. monocytogenes infection. FACS-sorted TCF7-GFP reporter P14 CD8+ T cells at day 4 to 5 post-infection analyzed by IF microscopy. Left: PIP3 and CD3 localization in interphase and metaphase blasts. Right: quantification of PIP3 and CD3 asymmetry in metaphase cells. ****p < 0.0001. Chi-square test with Bonferroni correction. (B) Polarization and asymmetric inheritance of Glut1 in vivo. Left: Glut1 localization in interphase and metaphase P14 CD8+ T cells processed as in (A). Right: quantification of Glut1 asymmetry in metaphase cells. ****p < 0.0001. Fisher’s exact test. (C) Concordant polarity of PIP3 and Glut1 in vivo. Left: PIP3 and Glut1 localization in metaphase P14 CD8+ T cells. Middle: quantification of PIP3 and Glut1 asymmetry in metaphase cells. ****p < 0.0001. Chi-square test with Bonferroni correction. Right: proportion of PIP3 asymmetric cells with Glut1 asymmetric concordant (same MTOC), Glut1 asymmetric discordant (opposite MTOC), or Glut1 symmetric localization.

References

    1. Adams WC, Chen YH, Kratchmarov R, Yen B, Nish SA, Lin WW, Rothman NJ, Luchsinger LL, Klein U, Busslinger M, et al. Anabolism-associated mitochondrial stasis driving lymphocyte differentiation over self-renewal. Cell Rep. 2016;17:3142–3152. - PMC - PubMed
    1. Berzat A, Hall A. Cellular responses to extracellular guidance cues. EMBO J. 2010;29:2734–2745. - PMC - PubMed
    1. Caro-Maldonado A, Wang R, Nichols AG, Kuraoka M, Milasta S, Sun LD, Gavin AL, Abel ED, Kelsoe G, Green DR, et al. Metabolic reprogramming is required for antibody production that is suppressed in anergic but exaggerated in chronically BAFF-exposed B cells. J Immunol. 2014;192:3626–3636. - PMC - PubMed
    1. Chang JT, Palanivel VR, Kinjyo I, Schambach F, Intlekofer AM, Banerjee A, Longworth SA, Vinup KE, Mrass P, Oliaro J, et al. Asymmetric T lymphocyte division in the initiation of adaptive immune responses. Science. 2007;315:1687–1691. - PubMed
    1. Chaturvedi A, Martz R, Dorward D, Waisberg M, Pierce SK. Endocytosed BCRs sequentially regulate MAPK and Akt signaling pathways from intracellular compartments. Nat Immunol. 2011;12:1119–1126. - PMC - PubMed

Publication types

Substances