Clinical Trial
. 2018 Feb 8;554(7691):189-194.
doi: 10.1038/nature25475. Epub 2018 Jan 31.

HER kinase inhibition in patients with HER2- and HER3-mutant cancers

Affiliations
Clinical Trial

HER kinase inhibition in patients with HER2- and HER3-mutant cancers

David M Hyman et al. Nature. .

Erratum in

  • Author Correction: HER kinase inhibition in patients with HER2- and HER3-mutant cancers.
    Hyman DM, Piha-Paul SA, Won H, Rodon J, Saura C, Shapiro GI, Juric D, Quinn DI, Moreno V, Doger B, Mayer IA, Boni V, Calvo E, Loi S, Lockhart AC, Erinjeri JP, Scaltriti M, Ulaner GA, Patel J, Tang J, Beer H, Selcuklu SD, Hanrahan AJ, Bouvier N, Melcer M, Murali R, Schram AM, Smyth LM, Jhaveri K, Li BT, Drilon A, Harding JJ, Iyer G, Taylor BS, Berger MF, Cutler RE Jr, Xu F, Butturini A, Eli LD, Mann G, Farrell C, Lalani AS, Bryce RP, Arteaga CL, Meric-Bernstam F, Baselga J, Solit DB. Hyman DM, et al. Nature. 2019 Feb;566(7745):E11-E12. doi: 10.1038/s41586-019-0974-0. Nature. 2019. PMID: 30755741

Abstract

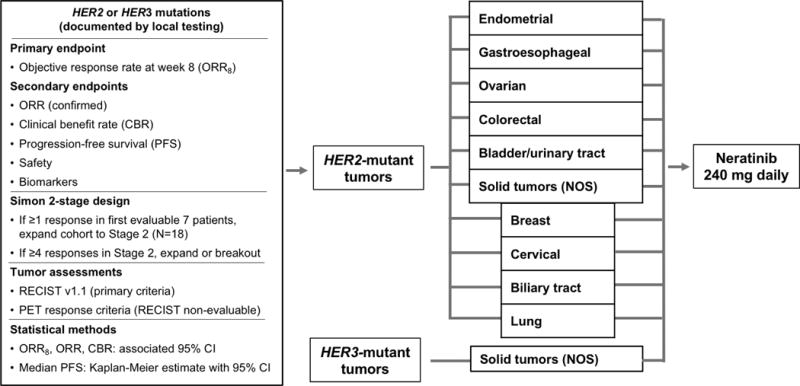
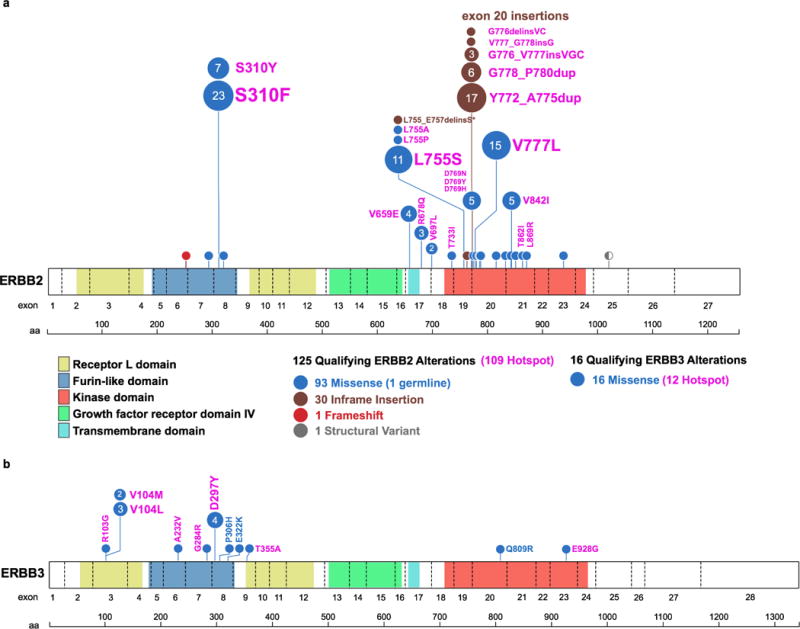
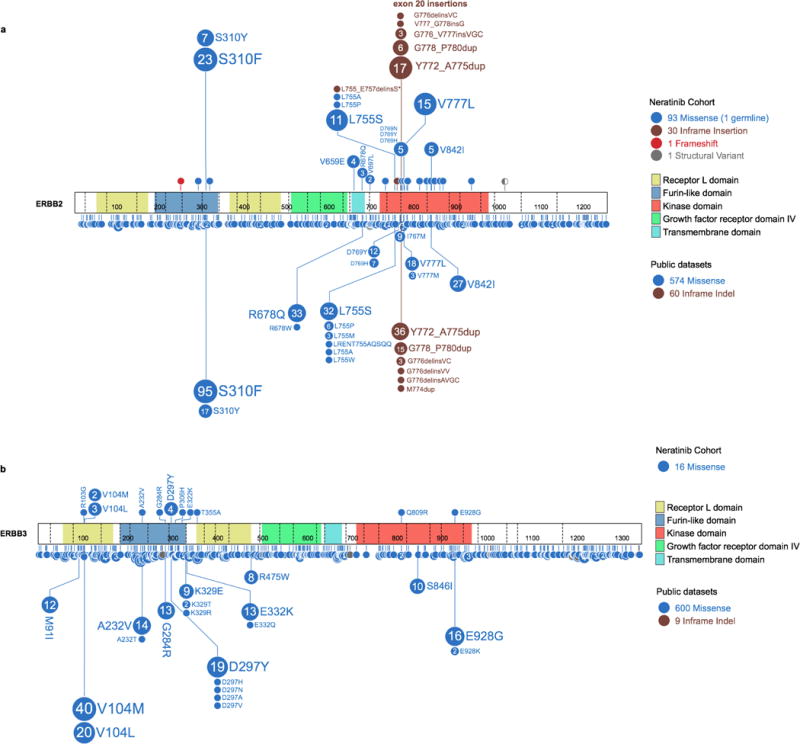
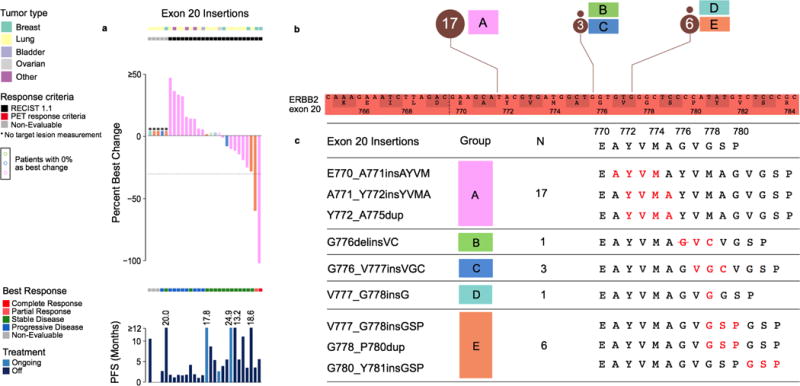
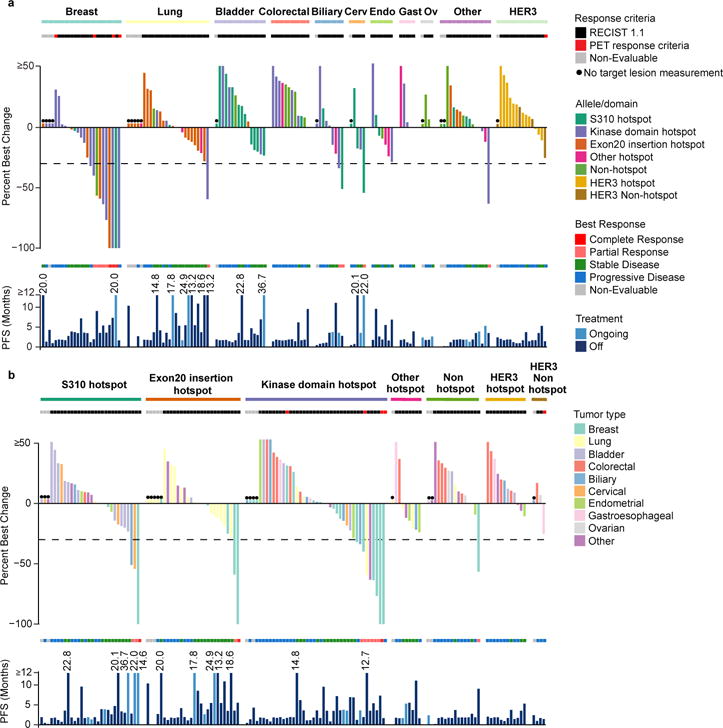
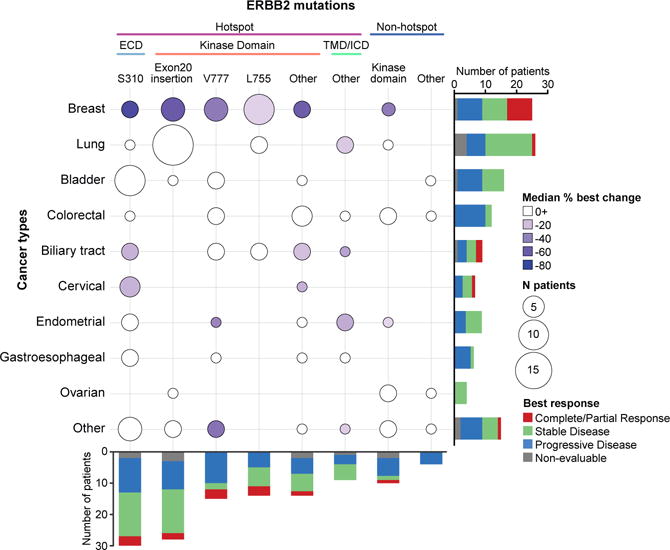
Somatic mutations of ERBB2 and ERBB3 (which encode HER2 and HER3, respectively) are found in a wide range of cancers. Preclinical modelling suggests that a subset of these mutations lead to constitutive HER2 activation, but most remain biologically uncharacterized. Here we define the biological and therapeutic importance of known oncogenic HER2 and HER3 mutations and variants of unknown biological importance by conducting a multi-histology, genomically selected, 'basket' trial using the pan-HER kinase inhibitor neratinib (SUMMIT; clinicaltrials.gov identifier NCT01953926). Efficacy in HER2-mutant cancers varied as a function of both tumour type and mutant allele to a degree not predicted by preclinical models, with the greatest activity seen in breast, cervical and biliary cancers and with tumours that contain kinase domain missense mutations. This study demonstrates how a molecularly driven clinical trial can be used to refine our biological understanding of both characterized and new genomic alterations with potential broad applicability for advancing the paradigm of genome-driven oncology.


Conflict of interest statement

Competing financial interests include the following: R.E.C., F.X., L.D.E., G.M., C.F., A.S.L., and R.P.B are employees of Puma Biotechnology. D.M.H., M.S., and J.B. receive research support from Puma Biotechnology, B.T.L. and M.S. receive research funding from Diachi, A.D. receives personal fees from Roche, and D.S. received personal fees from Loxo Oncology and Pfizer.

Figures

Extended Data Figure 1
Extended Data Figure 1. Design of SUMMIT study
Five tumour-specific HER2 (ERBB2)-mutant cohorts were pre-specified (endometrial, gastroesophageal, ovarian, colorectal and bladder/urinary tract). In addition, a sixth “Solid tumour (NOS)” HER2-mutant cohort allowed for enrollment of patients with any other cancer types. A sufficient number of patients with breast, cervical, biliary and lung cancer were enrolled in the “Solid tumours (NOS)” cohort to permit independent efficacy analysis using the same design as the pre-specified cohorts. Patients with HER3 (ERBB3)-mutant tumours were enrolled in a HER3-specific cohort regardless of tumour type. CBR, clinical benefit rate; cfDNA, cell-free [tumour] DNA; CI, confidence interval; FFPE, formalin-fixed paraffin-embedded; MSKCC, Memorial Sloan Kettering Cancer Center; MSK-IMPACT, Memorial Sloan Kettering-Integrated Mutation Profiling of Actionable Cancer Targets; NGS, next-generation sequencing; NOS, not otherwise specified; ORR, objective response rate; ORR8, objective response rate at week 8; PET, positron-emission tomography; PFS, progression-free survival; RECIST, Response Evaluation Criteria in Solid Tumors.
Extended Data Figure 2
Extended Data Figure 2. Distribution of a) 125 HER2 and b) 16 HER3 mutations positioned by their amino acid co-ordinates across the respective protein domains
Each unique mutation is represented by a circle, with the circle size and number representing the frequency, and coloured to show the mutation class as indicated in the legend. The corresponding amino acid change and common hotspot mutations (shown in pink) are labelled next to the circles.
Extended Data Figure 3
Extended Data Figure 3. Spectrum of HER2 and HER3 Mutations Observed in Neratinib Study versus TCGA, ICGC, and other Public Datasets
Distribution of a) HER2 and b) HER3 mutations observed across our cohort in comparison to the spectrum of HER2 and HER3 mutations (reflected lollipop) from publically available datasets (TCGA, ICGC, other published studies).
Extended Data Figure 4
Extended Data Figure 4. Distribution and outcome of 28 HER2 exon 20 insertions
a) Percent best change and PFS plots corresponding to each type of exon 20 insertion (colour coded by synonymous amino acid change). Three cases with no change are indicated in colour-coded circles above the x-axis. b) Zoomed-in schematic of all exon 20 insertions positioned by their amino acid co-ordinates and frequencies. c) Five unique types of exon 20 insertions observed in the study with the resulting full amino acid sequences (insertion indicated in red). PET, positron-emission tomography; PFS, progression-free survival; RECIST, Response Evaluation Criteria in Solid Tumors.
Extended Data Figure 5
Extended Data Figure 5. Genomic modifiers of response and outcome by treatment duration
a) Cancer cell fractions with 95% confidence intervals and clonality status of all HER2 mutations in 74 patients with sufficient sequencing data ordered by increasing clinical benefit (weeks on therapy). b) Comparison of the percent activation of known oncogenic alterations in the three pathways between the patients of clinical benefit (n=20, biologically independent samples) and no benefit (n=66, biologically independent samples). Nominal Fisher’s p-values shown.
Extended Data Figure 6
SUMMIT Consort Diagram.
Figure 1
Figure 1. Individual treatment outcome and response for 141 patients grouped by a) tumour cohort and b) mutant allele/domain
For each panel: The top graph shows percent best change from baseline in the target lesion assessed by the appropriate response criteria (RECIST version 1.1 or PET). Each bar is colour coded according to its a) mutation allele/domain or b) tumour type. The middle section shows best overall response. The bottom graph shows PFS colour coded by treatment status. *Non-evaluable. Cerv, cervical; endo, endometrial; gastro, gastroesophageal; Ov, ovarian; PET, positron-emission tomography; PFS, progression-free survival; RECIST, Response Evaluation Criteria in Solid Tumors.
Figure 2
Figure 2. Integrated efficacy by tumour type and HER2 allele/domain
The y-axis represents the ten tumour types and the x-axis represents the mutated allele/domain and hotspot status. The hotspot mutations are further broken down into the various domains. The size of the circle is proportional to the frequency of the tumour type and allele/domain; the colour of the circle reflects the median percent best change in the target lesion (any positive median change is indicated in white). The stacked bars represent the best overall change for the tumour type or domain/allele, as indicated in the legend. ECD, extracellular domain; ICD, intracellular domain; TMB, transmembrane domain.
Figure 3
Figure 3. Genomic modifiers of response and outcome by treatment duration
a) Comprehensive OncoPrint of the dichotomous clinical benefit groups for 86 patients with broad profiling data (left: no benefit (n=66, biologically independent samples), right: clinical benefit (n=20, biologically independent samples)). From top to bottom: TMB with the dotted line indicating the threshold for high TMB at 13.8 mutations per megabase, MSI status, allele/domain, tumour type, HER2 (ERBB2) status showing amplification, clonality and multiple mutations, and co-alterations in genes associated with key pathways. *Nominal Fisher’s p-values unadjusted for multiple hypothesis testing shown. Statistical significance is lost when corrected for multiple hypothesis testing. MSI, microsatellite instability; TMB, tumour mutational burden.

Comment in

References

    1. Chmielecki J, et al. Oncogenic alterations in ERBB2/HER2 represent potential therapeutic targets across tumors from diverse anatomic sites of origin. Oncologist. 2015;20:7–12. - PMC - PubMed
    1. Zehir A, et al. Mutational landscape of metastatic cancer revealed from prospective clinical sequencing of 10,000 patients. Nat Med. 2017;23:703–713. - PMC - PubMed
    1. Schram A, et al. Landscape of somatic ERBB2 mutations: Findings from AACR GENIE and comparison to ongoing ERBB2 mutant basket study. Cancer Res. 2017;77(13 Supplement):LB-103.
    1. Chang MT, et al. Identifying recurrent mutations in cancer reveals widespread lineage diversity and mutational specificity. Nat Biotechnol. 2016;34:155–163. - PMC - PubMed
    1. Bose R, et al. Activating HER2 mutations in HER2 gene amplification negative breast cancer. Cancer Discov. 2013;3:224–237. - PMC - PubMed

Publication types

MeSH terms

Associated data