. 2018 Feb 8;554(7691):239-243.
doi: 10.1038/nature25461. Epub 2018 Jan 31.

Enhancer redundancy provides phenotypic robustness in mammalian development

Affiliations

Enhancer redundancy provides phenotypic robustness in mammalian development

Marco Osterwalder et al. Nature. .

Abstract

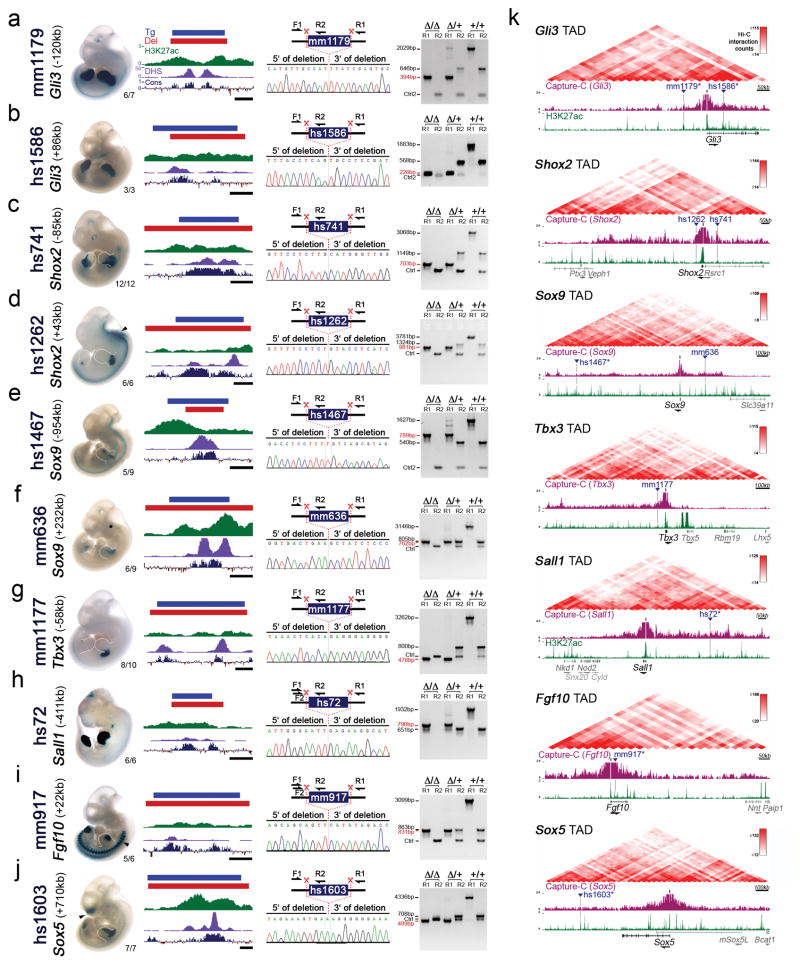
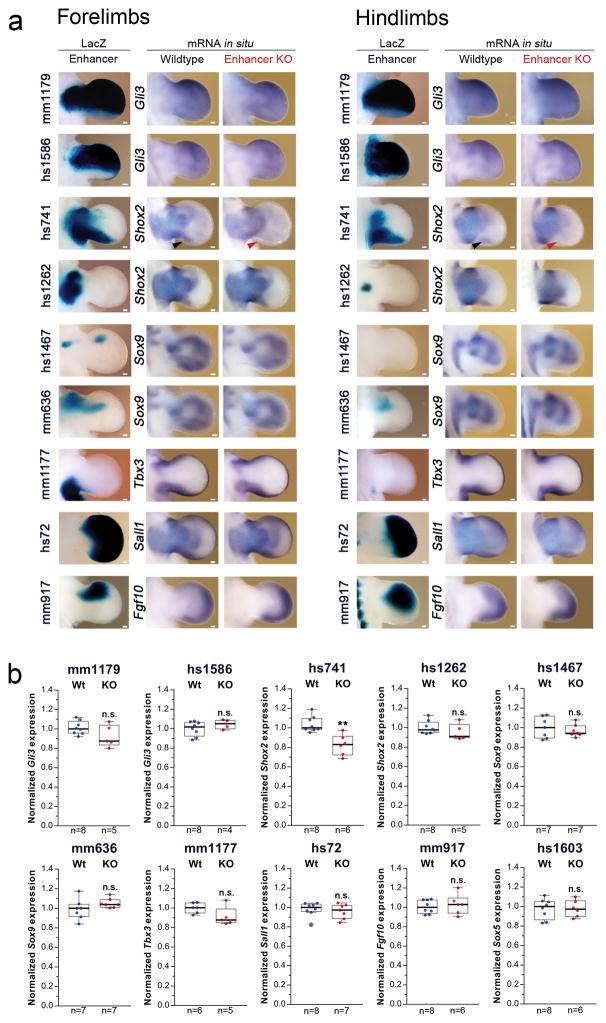
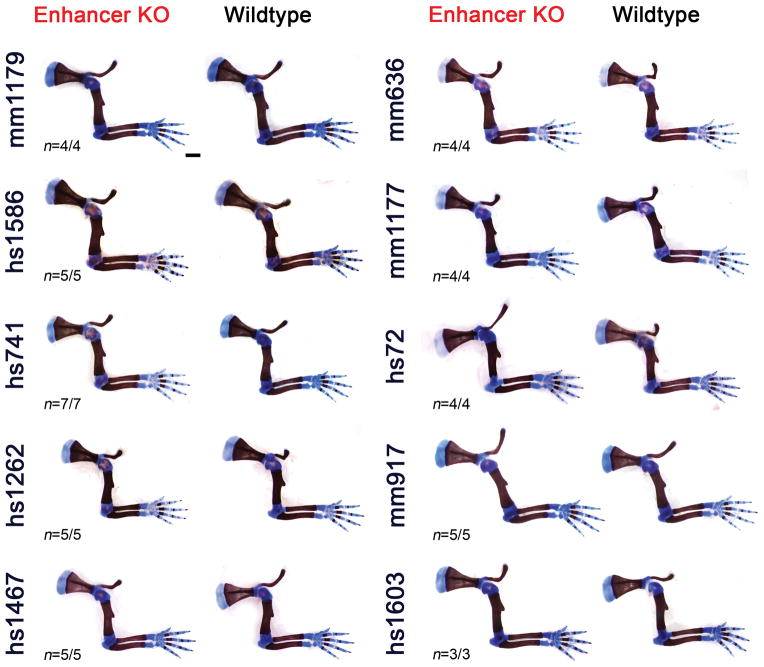
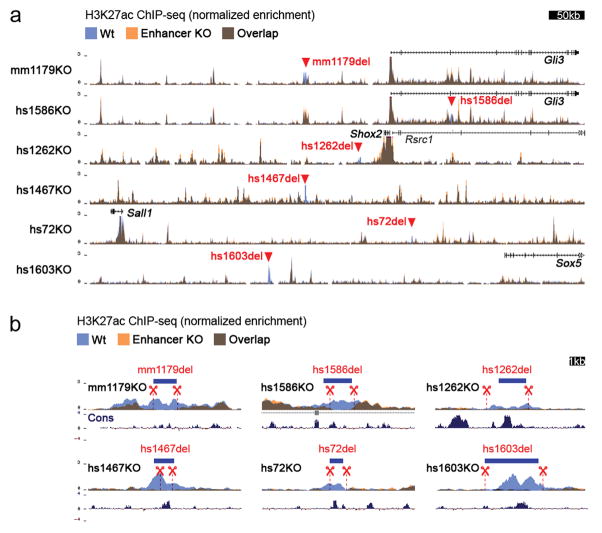
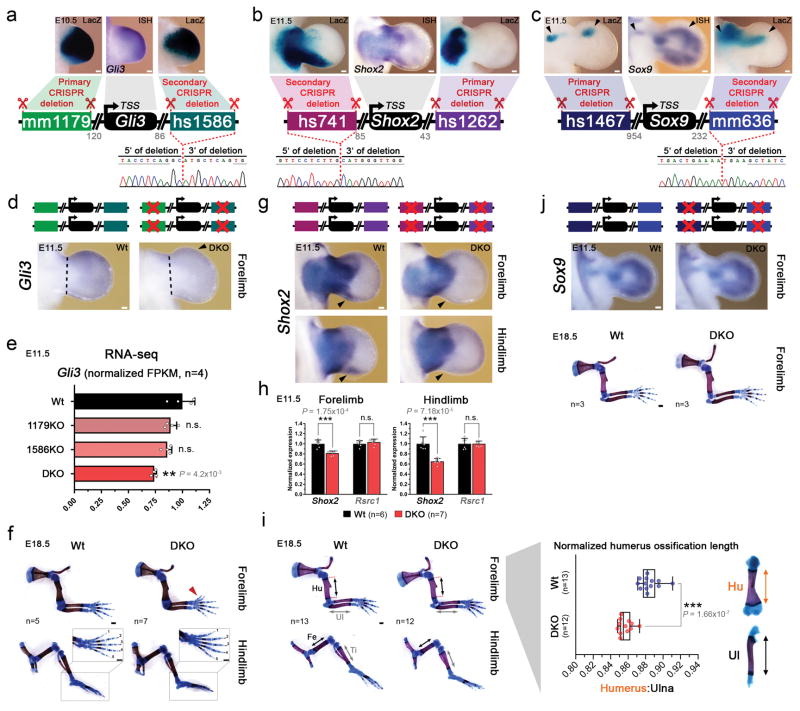
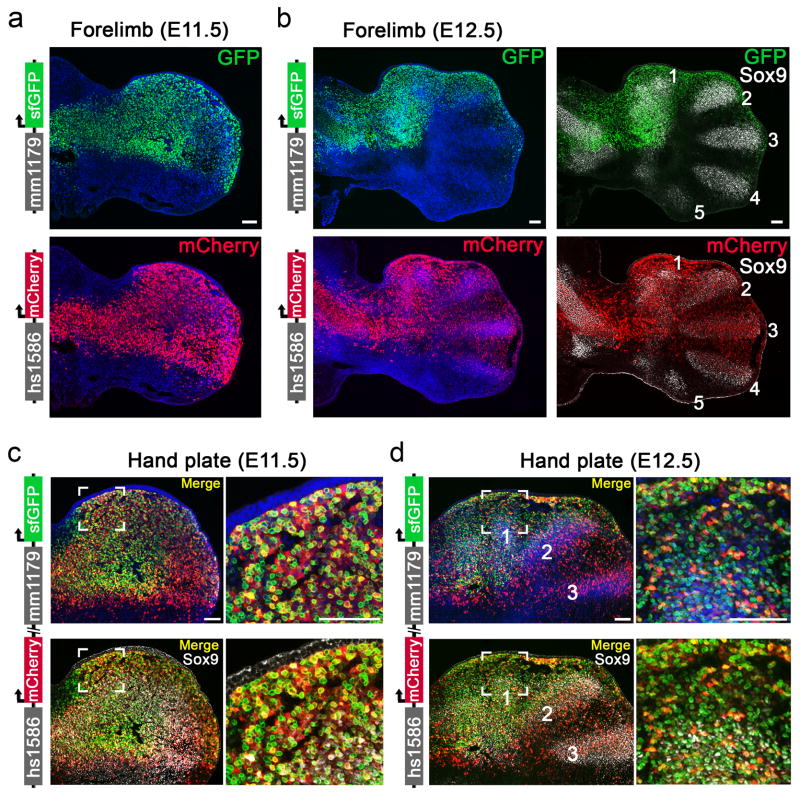
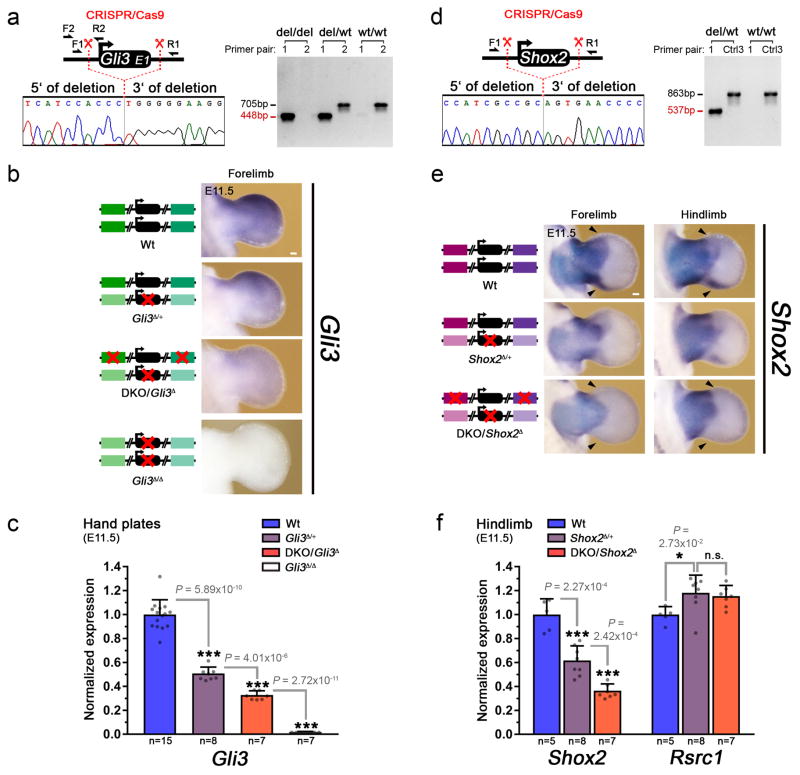
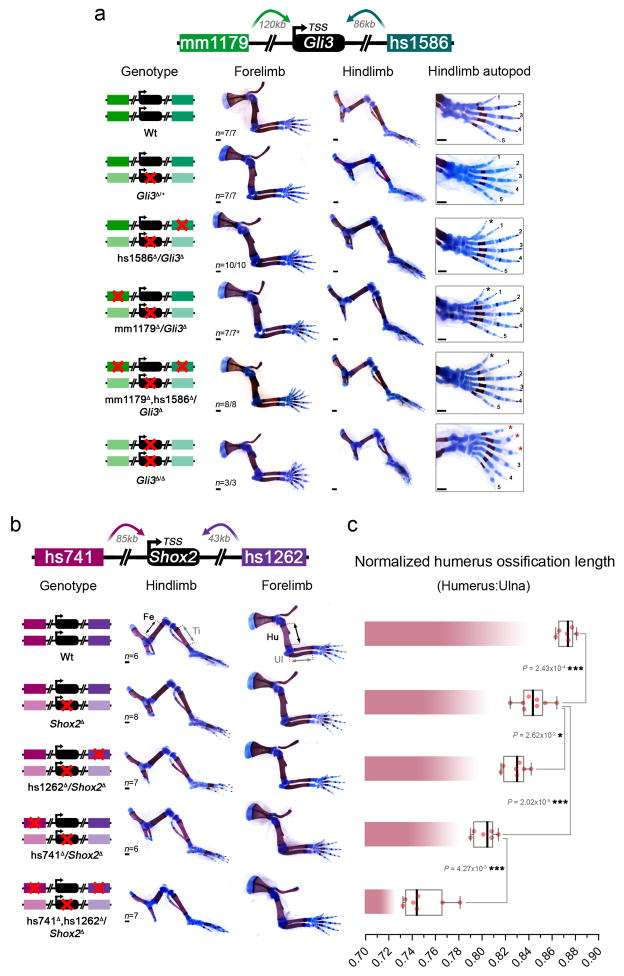
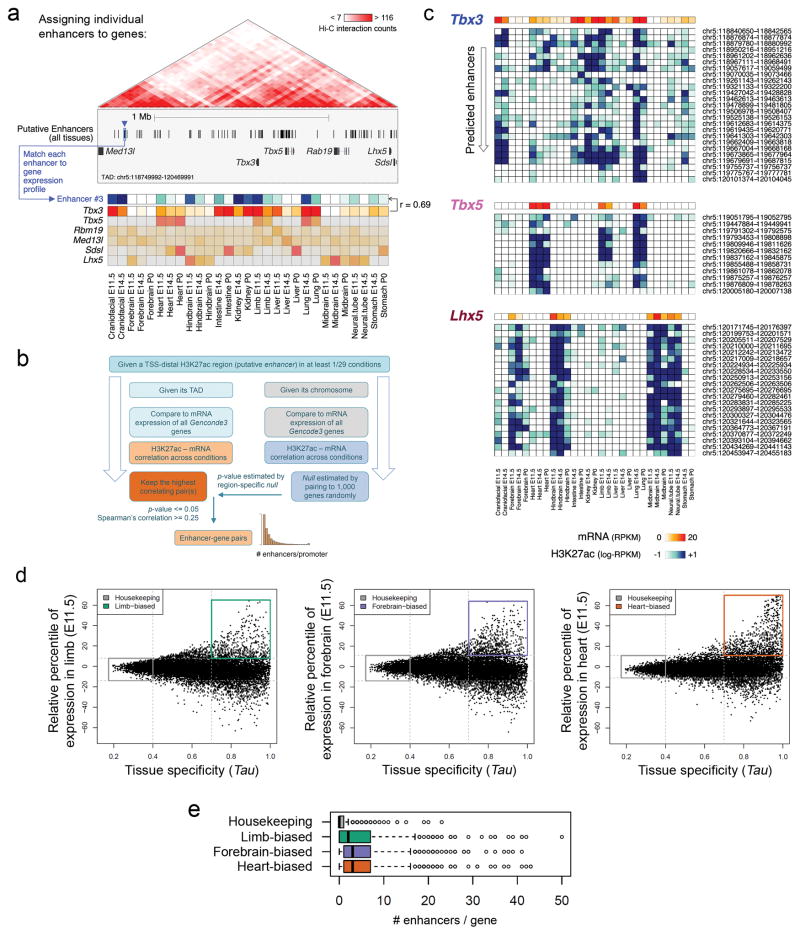
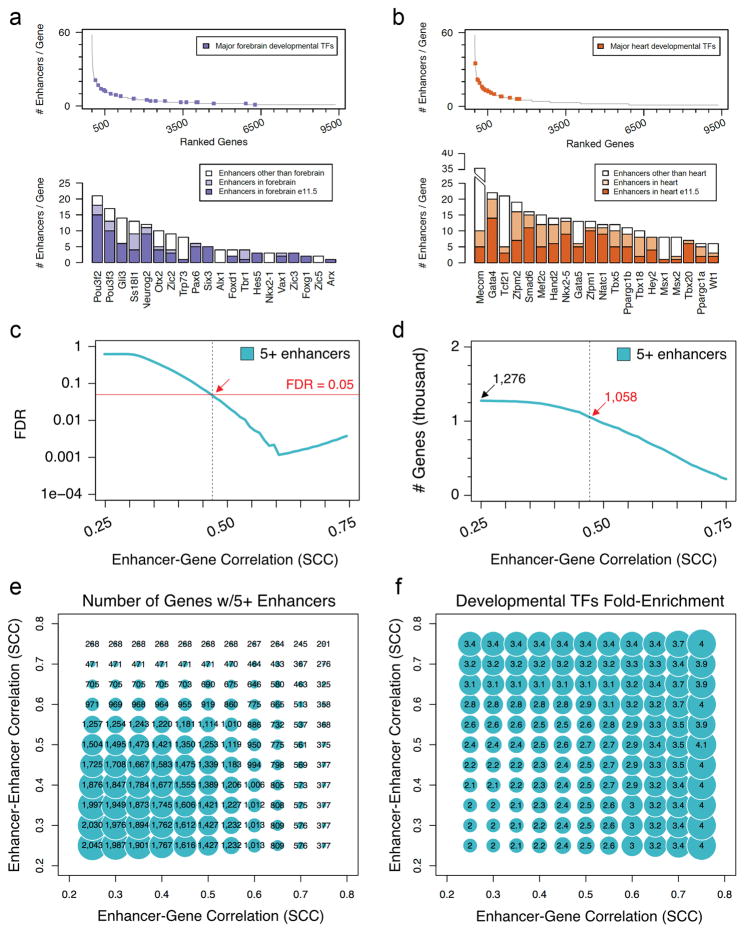
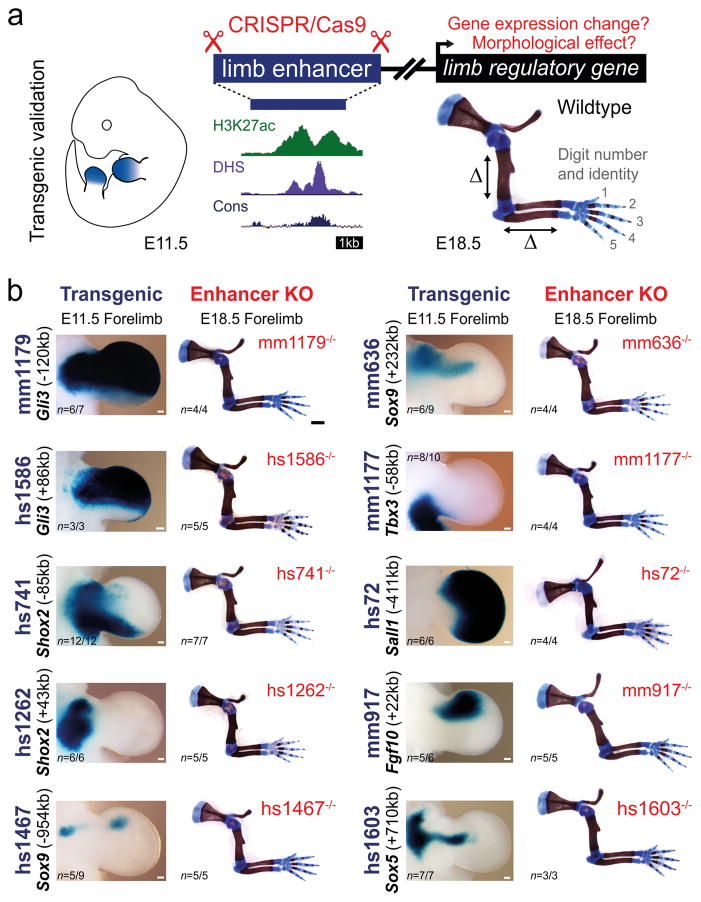
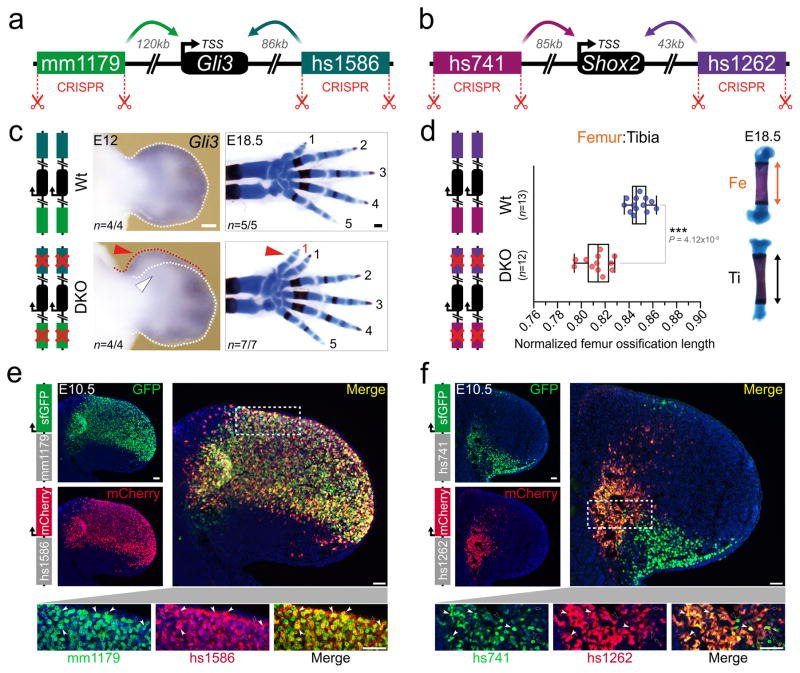
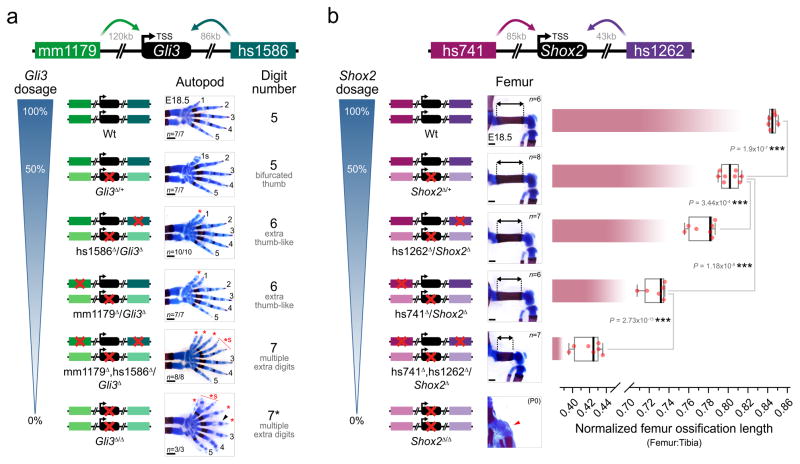
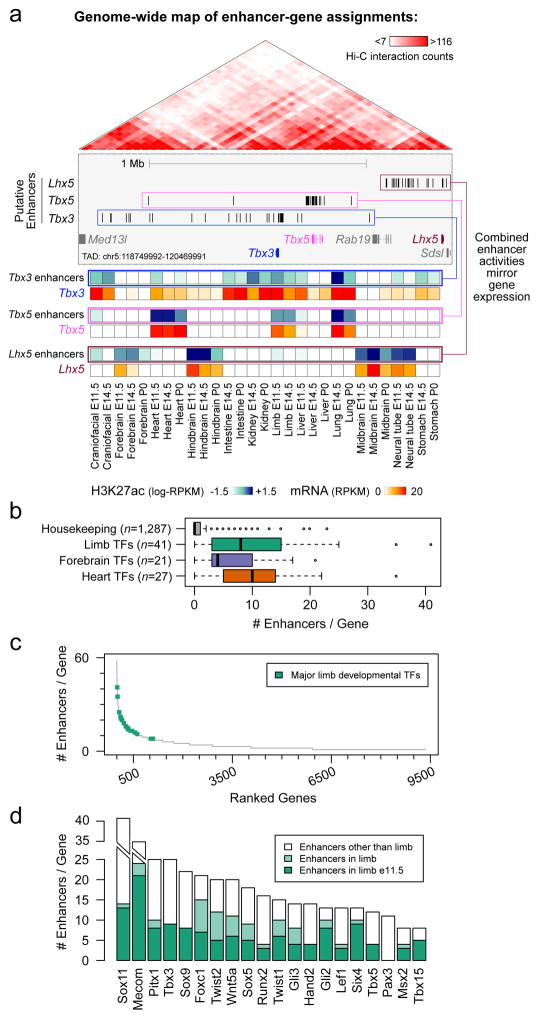
Distant-acting tissue-specific enhancers, which regulate gene expression, vastly outnumber protein-coding genes in mammalian genomes, but the functional importance of this regulatory complexity remains unclear. Here we show that the pervasive presence of multiple enhancers with similar activities near the same gene confers phenotypic robustness to loss-of-function mutations in individual enhancers. We used genome editing to create 23 mouse deletion lines and inter-crosses, including both single and combinatorial enhancer deletions at seven distinct loci required for limb development. Unexpectedly, none of the ten deletions of individual enhancers caused noticeable changes in limb morphology. By contrast, the removal of pairs of limb enhancers near the same gene resulted in discernible phenotypes, indicating that enhancers function redundantly in establishing normal morphology. In a genetic background sensitized by reduced baseline expression of the target gene, even single enhancer deletions caused limb abnormalities, suggesting that functional redundancy is conferred by additive effects of enhancers on gene expression levels. A genome-wide analysis integrating epigenomic and transcriptomic data from 29 developmental mouse tissues revealed that mammalian genes are very commonly associated with multiple enhancers that have similar spatiotemporal activity. Systematic exploration of three representative developmental structures (limb, brain and heart) uncovered more than one thousand cases in which five or more enhancers with redundant activity patterns were found near the same gene. Together, our data indicate that enhancer redundancy is a remarkably widespread feature of mammalian genomes that provides an effective regulatory buffer to prevent deleterious phenotypic consequences upon the loss of individual enhancers.


Conflict of interest statement

The authors declare no competing financial interests

Figures

Extended Data Figure 1
Extended Data Figure 1. CRISPR-deletion of ten limb enhancers and regulatory interaction landscape of associated target genes
(a–j) Left panels: Representative activity patterns of the selected enhancers in mouse embryos at E11.5 (VISTA enhancer browser) and the respective genomic enhancer region (Tg, blue bar) along with the region deleted in enhancer knockout mice (Del, red bar). Corresponding H3K27 acetylation patterns (green) in wild-type mouse embryonic forelimbs at E11.5 (this study) are depicted with open chromatin (ENCODE DHS in forelimbs at E11.5, purple) and the Placental Mammal basewise conservation track by PhyloP (Cons, blue/red). Scale bars, 500 bp. VISTA enhancer IDs (mm and hs numbers) are indicated on the left, with the distance of the enhancer from the transcriptional start site of the predicted target gene in the mouse genome. Numbers in the bottom right of each embryo indicate reproducibility of enhancer reporter assay. Arrowheads mark additional activity domains (other than limb): hs1262 (hindbrain, reproducibility: 5/6, also shown previously), mm917 (dorsal root ganglion, 7/7) and hs1603 (nose, 7/7; and branchial arch, 5/7). Asterisk indicates potential craniofacial enhancer activity for mm636, which was observed in 3/9 embryos. Right panels: PCR validation strategy and results for enhancer KO lines. Red scissors indicate CRISPR-mediated deletion breakpoints. PCR was used to detect the wild-type (+) and enhancer deletion (Δ) alleles. Below, Sanger sequencing traces show the deletion breakpoints (indicated by the dashed line) for the enhancer KO alleles. PCR genotyping results are shown with amplicon sizes indicated on the left (enhancer deletion allele in red). Primers (Ctrl or Ctrl2) amplifying an unrelated genomic region were included as a PCR positive control. See Supplementary Table 3 for all primer sequences and related PCR product sizes. (k) Top: Hi-C interaction heatmaps of topologically associated chromatin domains (mESC TADs). Bottom: Selected enhancers (blue triangles) and their predicted target genes (TSS indicated as black bar). The Capture-C UCSC browser track (purple) illustrates three-dimensional chromatin interaction profiles from E11.5 embryonic limbs (3kb window) using promoters of the predicted enhancer target genes as viewpoints. H3K27ac enrichment (green) in wildtype forelimbs at E11.5 (this study) is shown below. Six of the ten enhancers selected for deletion analysis display local Capture-C enrichment (marked by “*”), indicating physical interaction with the predicted target gene promoter at E10.5 or E11.5, based on the stringent statistical approach (95th percentile threshold) applied in the original study. Other genes present in the TAD are shown in gray.
Extended Data Figure 2
Extended Data Figure 2. No major differences in expression of predicted target genes in individual enhancer knockouts
(a) Spatial enhancer activity domains (LacZ, see also Fig. 1b) are compared to mRNA expression domains (by in situ hybridization) of the predicted target gene in embryonic fore- and hindlimbs at E11.5. No significant changes in expression patterns were observed in enhancer knockouts compared to wild-type limbs, except in limbs lacking hs741, where a small subdomain of target gene expression was lost (red arrowhead marks loss of the posterior Shox2 domain in the distal limb). Transcript distribution was reproduced in at least n=3 independent biological replicates. (b) Quantitative real-time PCR using limbs of homozygous null (KO, red dots) and wild-type (Wt, blue dots) embryos at E11.5 reveals lack of significantly downregulated transcript levels of predicted enhancer target genes in 9/10 cases. Box plots indicate median, interquartile values, range and individual biological replicates. Outliers are shown as circled data points. **, P=0.0012, unpaired, two-tailed t-test. n.s., not significant. Scale bars, 100 μm.
Extended Data Figure 3
Extended Data Figure 3. Absence of obvious morphological abnormalities in limb enhancer knockouts
Side-by-side comparison of enhancer KO limb skeletons with wild-type littermate controls at E18.5. Neither forelimbs (this figure) nor hindlimbs (data not shown) of the enhancer KO lines revealed any obvious morphological differences in comparison to wild-type littermates. Cartilage is stained blue and bone dark red. The number of embryos with normal limb phenotypes over the total number of homozygous-null embryos examined is shown in the bottom left. “n”, number of independent biological replicates with similar results. Scale bar, 1 mm.
Extended Data Figure 4
Extended Data Figure 4. Absence of compensatory enhancer signatures in limbs of enhancer KO embryos
(a) Layered ChIP-seq H3K27 acetylation (ac) profiles surrounding the deleted enhancers and from wild-type (blue, n=4 independent biological replicates) and enhancer knockout embryos (orange, at least n=2 biological replicates). For all samples, E11.5 forelimb was profiled. For display, replicates were merged using bigWigMerge (UCSC tools) and normalized. Red triangles indicate the position of individual enhancer deletions. (b) H3K27ac enrichments in targeted regions marked by red triangles in A, showing the absence of H3K27ac at the deletion site in individual enhancer knockout (orange) compared to wild-type (blue) samples. Blue bars indicate location of enhancer sequences. Dashed red lines demarcate the region deleted by CRISPR. Vertebrate basewise conservation track by PhyloP (Cons) is shown.
Extended Data Figure 5
Extended Data Figure 5. Transcriptional and phenotypic impact of dual enhancer deletions engineered by iterative CRISPR/Cas9 genome editing
(a–c) Upper panels: Enhancer pairs with overlapping limb activities (LacZ), coinciding with domains of predicted target gene expression visualized by in situ hybridization (ISH). For Sox9 enhancers, black arrowheads indicate overlapping domains. Schematics: Double enhancer deletion strategy to delete the three enhancer pairs with overlapping activity (see Methods). Gray numbers indicate enhancer distance (in kb) from the transcriptional start site (TSS). Lower panels: Sanger sequencing verification of the secondary enhancer deletion. Deletion breakpoint is marked by the dashed line. Gray horizontal bars indicate bases present in the primary deletions (single enhancer KO lines, see Extended Data Fig. 1a–j). Shox2- and Sox9- associated LacZ panels are also used in Extended Data Fig. 2. (d) Gli3 transcript distribution (ISH) in wildtype (Wt) and mm1179/hs1586 double enhancer knockout (DKO) embryos. Arrowhead points to reduced Gli3 transcript in the anterior limb mesenchyme. Dashed line indicates dissected hand plate for RNA-seq. (e) RNA-seq confirmed significantly reduced Gli3 expression in hand plates of DKO, but not individual enhancer KO embryos (compared to wildtype hand plates). (f) Unaffected hindlimb morphology in mm1179/hs1586 DKO embryos. Red arrowhead points to digit 1 duplication in forelimbs (see also Fig. 2). (g) Shox2 expression (ISH) in fore- and hindlimbs of hs741/hs1262 double enhancer knockout (DKO) embryos. The distal-posterior domain (arrowhead) is dependent on hs741 (Extended Data Fig. 2). (h) Reduced Shox2 expression in fore- and hindlimbs of hs741/hs1262 DKO embryos (qPCR). Expression of the nearby Rsrc1 gene was unchanged. (i) Left: Representative limb skeletons of wildtype and hs741/hs1262 DKO embryos. Hu, humerus; Ul, ulna; Fe, femur; Ti, Tibia. Right: Mild but significant reduction in humerus ossification length (double arrows) in hs741/hs1262 DKO limb skeletons. ***, P=1.66×10⁻⁷ (two-tailed, unpaired t-test). (j) Absence of evident Sox9 expression differences or skeletal abnormalities in embryos lacking both the hs1467 and mm636 enhancers near Sox9. For ISH, transcript distribution was reproduced in at least n=3 independent biological replicates. “n”, number of independent biological replicates with similar results. For bar graphs and boxplots, individual biological replicates are shown as data points. Bar graphs illustrate mean and standard deviation (error bars). Box plot indicates median, interquartile values and range. ***, P < 0.001; **, P < 0.01 (two-tailed, unpaired t-test). n.s., not significant. Scale bars, 100 μm (white) and 500 μm (black).
Extended Data Figure 6
Extended Data Figure 6. Cellular resolution of redundant Gli3 enhancer activities at the onset of digit formation
(a, b) Individual Gli3 enhancer activities as detected by immunofluorescence (mm1179: green, hs1586: red) in forelimbs of transgenic reporter embryos. Sox9 (gray) marks chondrogenic progenitors of the mesenchymal condensations forming digit primordia (digits 1–5, from anterior to posterior). (c, d) Co-localization of mm1179 and hs1586 enhancer activities in hand plates of double enhancer transgenic embryos. Close-ups (right panels) show that the anterior mesenchyme (Fig. 2c) harbors many cells with dual enhancer activities (yellow). A fraction of double enhancer positive cells carries the signature of Sox9 digit progenitors (white, bottom). n=3 independent embryos per genotype were analyzed, with similar results. Nuclei, detected via Hoechst, are colored blue. Scale bars, 100 μm (a, b) and 50 μm (c–f).
Extended Data Figure 7
Extended Data Figure 7. Generation of Gli3 and Shox2 knockout alleles and characterization of enhancer deletions in a sensitized background
(a, d) Top: Schematic showing CRISPR/Cas9-mediated deletions used to generate Gli3 and Shox2 loss-of-function alleles. Genotyping primers used to validate targeted deletion events are indicated. Middle: Sanger sequencing confirmation of deletion event, with grey and red dashed lines indicating breakpoints. Right: PCR genotyping examples are shown, and the size of the product specific for the deletion allele is depicted in red (primers listed in Supplementary Table 3). (b) In situ hybridization (ISH) showing the gradual decrease of anterior Gli3 transcript in forelimbs of wild-type, Gli3Δ/+ and sensitized mm1179, hs1586 double enhancer knockout (DKO/Gli3Δ) embryos. (c) Quantitative real-time PCR (qPCR) validation of Gli3 mRNA levels in forelimb hand plates from the genotypes shown in panel b. (e) Shox2 expression (ISH) in fore- and hindlimbs of wild-type, Shox2Δ/+ and sensitized hs741, hs1262 double enhancer knockout (DKO/Shox2Δ) embryos. Arrowheads point to the domains in enhancer DKO/Shox2Δ embryos where Shox2 expression is nearly abolished. (f) qPCR revealing significantly downregulated Shox2 mRNA levels in hindlimbs of DKO/Shox2Δ compared to Shox2Δ/+ embryos. “n” indicates the number of independent biological replicates with similar results. Bar plots illustrate mean and standard deviation (error bars), with individual biological replicates shown. ***, P < 0.001; *, P < 0.05 (two-tailed, unpaired t-test). n.s., not significant. For ISH, transcript distribution was reproduced in at least n=3 independent biological replicates. Scale bars, 100 μm.
Extended Data Figure 8
Extended Data Figure 8. Limb phenotypes of individual and combinatorial Gli3 and Shox2 enhancer knockouts in presence of reduced target gene dosage
(a) Skeletal phenotypes resulting from mm1179 and hs1586 enhancer deletions in combination with reduction to one copy of the Gli3 gene at E18.5. Genotypes are shown on the left with red crosses indicating elements deleted by CRISPR/Cas9. While forelimbs of Gli3Δ/+ embryos displayed bifurcated digit 1 terminal phalanges, hindlimbs showed an extra toe structure but without detectable cartilage template. Four out of seven mm1179Δ/Gli3Δ embryos displayed additional bifurcation of digit 2 of the right forelimb, which suggests that removal of mm1179 reduces Gli3 levels in the anterior forelimb more than deletion of hs1586. An almost complete anterior extra toe forms in hindlimbs of embryos with single or dual enhancer deletions in the sensitized background (black asterisks). Loss of both Gli3 copies results in anterior hindlimb polydactyly with altered digit identities (red asterisks). (b) Allelic series depicts shortening of the stylopod (humerus and femur) in limb skeletons with individual or combined hs741 and hs1262 enhancer deletions in a Shox2 sensitized condition (see also Fig. 3b). Stylopod ossification length (double arrows) appears less reduced in forelimbs (humerus, Hu) than in hindlimbs (femur, Fe) of embryos lacking the activity of both enhancers (hs741Δ, hs1262Δ/Shox2Δ). Tibia (Ti) and ulna (Ul) were normal in all genotypes examined. (c) Humerus ossification length (normalized to ulna ossification length) is significantly reduced in embryos lacking either hs741 or hs1262 in the presence of only one copy of Shox2. In embryos lacking both enhancers in the sensitized background significant shortening of the humerus ossification is observed (compared to all other genotypes). “n” indicates the number of independent biological replicates with similar results. Box plots indicate median, interquartile values, range and individual biological replicates. ***, P < 0.001; *, P < 0.05 (two-tailed, unpaired t-test). Scale bars, 500 μm.
Extended Data Figure 9
Extended Data Figure 9. A correlative framework to define enhancer-promoter associations across the mouse genome
(a) The TAD including the transcriptional regulators Tbx3, Tbx5 and Lhx5 illustrates the statistical framework to define enhancer-promoter associations genome-wide. For each predicted enhancer, correlation between its H3K27ac signal (blue arrowhead, blue-shades heat map) with the mRNA expression profiles of every gene in the TAD (red-shades heat map) across all available tissues and developmental stages was assessed. The enhancer was then assigned to the most highly correlated gene, Tbx3 in the case of Enhancer #3. (b) Schematic depicting the underlying statistical framework used to determine genome-wide enhancer-promoter interactions (see Methods for a detailed description). (c) Activity pattern for the enhancers assigned to Tbx3, Tbx5 and Lhx5 genes. Genomic coordinates are listed on the right. For each predicted enhancer-gene pairing, Spearman’s Correlation Coefficient (SCC, n = 29) and the corresponding empirically estimated p-value (from 1,000 random enhancer-gene pairings) are shown in Supplementary Table 11. (d) Identifying genes with biased expression in embryonic limb, forebrain, or heart. Expression variability across 29 RNA-seq datasets from multiple tissues and developmental time points, measures of tissue specificity (Tau, x-axis) and specific tissue-biased expression at E11.5 (y-axis) for each protein-coding gene were calculated (see Methods for additional details). Housekeeping genes were defined as displaying Tau <= 0.4 and relative expression in the limb between the 5th and 95th percentiles. Tissue-biased genes were defined as showing Tau >= 0.7 and relative expression higher than the 95th percentile. (d) Distribution of enhancer numbers assigned to each gene, for the different gene categories. Genes with tissue-biased expression profiles were associated with a significantly higher number of enhancers than housekeeping genes. P = 4e-121 (n=553), P = 7e-97 (n=626) and P = 6e-83 (n=826) for limb, forebrain and heart biased genes, respectively (two sided Mann-Whitney tests). n = 1,287 for housekeeping genes. Box plots indicate median, interquartile values and range. Outliers are shown as individual points.
Extended Data Figure 10
Extended Data Figure 10. Enhancer redundancy as a widespread feature of developmental genes and robustness to the choice of thresholds used in the correlative approach
(a–b) Top panels: Number of enhancers assigned to each gene through the correlative framework, with developmental TFs showing biased expression in forebrain (a, blue dots) or heart (b, orange dots) indicated. Classification of tissue-biased developmental TFs is described in Methods. Genes with at least one assigned enhancer are displayed and sorted according to the number of assigned enhancers (left to right). Bottom panels: Bar plot showing the total number of enhancers assigned to each of the TFs highlighted in the top panels. For each gene, a color code shows the number of predicted enhancers assigned to that gene in the relevant tissue (A: heart, B: forebrain) at E11.5 (dark color), in the relevant tissue at any other developmental stage included in the analysis (light color), or in any other tissue (white). (c) Estimated FDR (based on genome-wide permutations, see Methods) of observing a gene with 5 or more enhancers assigned to it, for increasingly larger correlation coefficients (0.25 to 0.75). The red solid line indicates an FDR of 0.05. The red arrow and the black dashed line highlight the lowest correlation coefficient (0.47, considering a step of 0.01) with an FDR <= 0.05 (FDR = 0.0495). (d) Number of genes showing 5 or more enhancers assigned to them, for increasingly larger correlation coefficients (0.25 to 0.75). The total number of genes (SCC >= 0.25) along with the number of genes identified using the threshold set in (c) (SCC >= 0.47) is indicated (1,276 and 1,058, respectively; see Supplementary Tables 11 and 12). (e) Bubble plot showing the number of genes with 5 or more enhancers assigned to them, at increasingly higher correlation between enhancer-promoter (x-axis) and between enhancers assigned to the same gene (y-axis). (f) Bubble plot displaying the fold-enrichment (linear) for developmental transcription factor (TF) genes among each set in (c).
Figure 1
Figure 1. Lack of limb morphological abnormalities in ten enhancer deletion lines
(a) All selected enhancers are active in the limb mesenchyme (blue shading) at E11.5, are marked by epigenomic H3K27 acetylation and DNase I hypersensitivity (DHS) at E11.5, and contain a conserved core sequence (Cons). Following deletion of individual enhancers (Extended Data Fig. 1a–j), target gene expression and limb morphology were assessed. (b) None on the individual enhancer deletions caused obvious defects in the structure of skeletal elements. Enhancer activities (left, E11.5) and forelimb skeletons of enhancer knockout (KO) embryos (right, E18.5) are shown (see Extended Data Fig. 3 for wild-type controls). Predicted target gene and enhancer distance (+: downstream; -: upstream) from the transcriptional start site (TSS) are indicated. “n”, independent biological replicates with similar results. Scale bars, 100 μm (white), 1 mm (black).
Figure 2
Figure 2. Morphological requirements of limb enhancers with overlapping activities
(a, b) CRISPR-deleted enhancers and their distance to the TSS of predicted target genes (Gli3, Shox2). (c) Left: RNA in situ hybridization (ISH) reveals reduced Gli3 expression in anterior hand plates of mm1179/hs1586 double enhancer knockout (DKO) embryos (white arrowhead). Red arrowhead: local expansion of anterior mesenchyme, a hallmark of Gli3 deficiencies. Right: Forelimb skeletons with digits labeled 1 to 5, from anterior to posterior. DKO embryos exhibit duplication of digit 1 (arrowhead). Scale bars, 200 μm. (d) Shortened femur ossification length in hs741/hs1262 double enhancer knockout (DKO) embryos (normalized to tibia ossification length). Box plot indicates median, interquartile values, range and individual biological replicates. ***, P < 0.001 (two-tailed, unpaired t-test). (e, f) Co-localization of Gli3 (mm1179: green, hs1586: red) and Shox2 (hs741: green, hs1262: red) enhancer activities via enhancer-reporter transgenes and immunofluorescence (IF) in forelimb buds of double transgenic embryos. White arrowheads: examples of double positive cells. Empty arrowheads or arrows: cells marked by single enhancers. Nuclei are stained blue. Scale bars, 50 μm. “n”, independent biological replicates with similar results.
Figure 3
Figure 3. Normally dispensable individual enhancers are required for limb morphology in a sensitized background
Individual and combined enhancer deletions in the presence of only one copy of the Gli3 (a) or Shox2 (b) target genes and the resulting limb morphology at E18.5. Wedges indicate inferred gene dosage. (a) Skeletal forelimb autopod phenotypes at E18.5 resulting from mm1179 and hs1586 enhancer deletions in the presence of reduced Gli3 dosage. 1–5, normal digits. Red asterisk, extra digits with unclear identity. *s, “split” digit. Black arrowhead, hypoplastic distal phalange. (b) Progressive reduction of femur ossification length (double arrows) due to hs741 and hs1262 enhancer loss in a Shox2 sensitized background. The relative length of the femur ossification, normalized to the tibia ossification length, is shown. For comparison, the bottom panel shows absence of the femur ossification in Shox2 deficient limbs at P0 (red arrowhead, reproduced with permission from authors of ref. ). “n”, number of independent biological replicates with similar results. Box plots indicate median, interquartile values, range and individual biological replicates. ***, P < 0.001 (two-tailed, unpaired t-test). Scale bars, 500 μm.
Figure 4
Figure 4. Enhancers with redundant signatures are prevalent near developmental genes
(a) Enhancer-gene assignments based on correlation of H3K27ac and mRNA profiles across a wide array of tissues (Extended Data Fig. 9a). Top: At an example locus encompassing Tbx3, Tbx5, and Lhx5, up to 25 enhancers are assigned to each of these three genes (blue, pink and brown boxes, Extended Data Fig. 9c). Genes showing fewer than five assigned enhancers are shown in gray. Bottom: heat maps showing meta-profiles of each gene’s expression profile across tissues (red shades), along with the cumulative activity profile of its assigned enhancers (blue shades). (b) Distribution of the number of enhancers assigned to developmental TFs with biased expression in limb (P = 5e-19 vs. housekeeping), forebrain (P = 8e-15), and heart (P = 3e-25) (two sided Mann-Whitney tests). Box plots show median, interquartile values, range, and outliers (individual points). (c) Complete spectrum of genes with at least one assigned enhancer, sorted by decreasing enhancer numbers. Limb-biased TFs are highlighted in green. (d) Total number of enhancers (in all tissues analyzed) assigned to each TF in (c), with the number of assigned enhancers predicted specifically in limb at E11.5 (dark green) or any other stage analyzed (light green).

Comment in

References

    1. Consortium EP. An integrated encyclopedia of DNA elements in the human genome. Nature. 2012;489:57–74. doi: 10.1038/nature11247. - DOI - PMC - PubMed
    1. Long HK, Prescott SL, Wysocka J. Ever-Changing Landscapes: Transcriptional Enhancers in Development and Evolution. Cell. 2016;167:1170–1187. doi: 10.1016/j.cell.2016.09.018. - DOI - PMC - PubMed
    1. Andrey G, Mundlos S. The three-dimensional genome: regulating gene expression during pluripotency and development. Development. 2017;144:3646–3658. doi: 10.1242/dev.148304. - DOI - PubMed
    1. Sagai T, Hosoya M, Mizushina Y, Tamura M, Shiroishi T. Elimination of a long-range cis-regulatory module causes complete loss of limb-specific Shh expression and truncation of the mouse limb. Development. 2005;132:797–803. doi: 10.1242/dev.01613. - DOI - PubMed
    1. Menke DB, Guenther C, Kingsley DM. Dual hindlimb control elements in the Tbx4 gene and region-specific control of bone size in vertebrate limbs. Development. 2008;135:2543–2553. doi: 10.1242/dev.017384. - DOI - PubMed

Publication types