. 2018 Feb 8;13(2):e0192160.
doi: 10.1371/journal.pone.0192160. eCollection 2018.

Inference of financial networks using the normalised mutual information rate

Affiliations

Inference of financial networks using the normalised mutual information rate

Yong Kheng Goh et al. PLoS One. .

Abstract

In this paper, we study data from financial markets, using the normalised Mutual Information Rate. We show how to use it to infer the underlying network structure of interrelations in the foreign currency exchange rates and stock indices of 15 currency areas. We first present the mathematical method and discuss its computational aspects, and apply it to artificial data from chaotic dynamics and to correlated normal-variates data. We then apply the method to infer the structure of the financial system from the time-series of currency exchange rates and stock indices. In particular, we study and reveal the interrelations among the various foreign currency exchange rates and stock indices in two separate networks, of which we also study their structural properties. Our results show that both inferred networks are small-world networks, sharing similar properties and having differences in terms of assortativity. Importantly, our work shows that global economies tend to connect with other economies world-wide, rather than creating small groups of local economies. Finally, the consistent interrelations depicted among the 15 currency areas are further supported by a discussion from the viewpoint of economics.


Conflict of interest statement

Competing Interests: The authors have declared that no competing interests exist.

Figures

Fig 1
Fig 1. The CMN, distribution of data points and expansion of points in Ω.
Panel (a): The CMN is composed of 16 coupled nodes as shown by its network. The dynamics in each node is given by Eqs (7) and (8). Panel (b): The distribution of points in Ω obtained from Eqs (7) and (8), plotted in a 10 × 10 grid of equally-sized cells. Panel (c): The points belong initially to a cell of the same grid and expand to a larger extend of Ω after three iterations of the dynamics, occupying more than one cells. δ is the maximum distance in the initial cell and Δ the maximum distance after the points have expanded to a larger extend of Ω.
Fig 2
Fig 2. Estimation of the threshold τ for the inference of CMN.
Panel (a) is the plot of MIR¯XY before ordering its values in ascending order, and (b) after ordering them in ascending order. Following the approach in the text, τ ≈ 0.21 plotted by the red dash line in both panels.
Fig 3
Fig 3. Results for the case of additional data for a pair of nodes with uniformly random, uncorrelated data.
Panel (a) shows the estimation of τ ≈ 0.27 based on the ordered MIR¯XY values for a network of 6 isolated nodes without the introduction of the pair of nodes with uniformly random, uncorrelated data. Panel (b) is the unsuccessfully inferred network based on panel (a). Panel (c) shows the ordered MIR¯XY values for the same network with the nodes of random data added. The black bars are the MIR¯XY values that come from the pair of additional nodes. Panel (d) shows the resulting successfully inferred network of isolated, disconnected nodes. In panels (a) and (c), we plot τ by a red dash line where τ ≈ 0.27 in (a) and τ ≈ 0.5 in (c).
Fig 4
Fig 4. Network inference in the case of two, disconnected, triplets of nodes.
Panel (a) shows the network of weakly coupled (α = 0.1) logistic maps. Nodes 1 and 3 interact indirectly through node 2, and similarly, nodes 4 and 6 through node 5. Panel (b) shows the ordered MIR¯XY and threshold τ (red dash line) when no additional nodes are introduced to the network. The red dash line corresponds to τ ≈ 0.16. Panel (c) shows the unsuccessfully inferred network when using only the data from the network in panel (a). Panel (d) shows the ordered MIR¯XY values for the same network as in (a) with the additional data from the pair of directed nodes (see text). The blue dash line represents the threshold computed for the pair of directed nodes (τ ≈ 0.69) and the red dash line corresponds to τ ≈ 0.16 from panel (b). Finally, panel (e) shows the successfully inferred network by considering as connected nodes only those with MIR¯XY bigger than the blue dash threshold.
Fig 5
Fig 5. Application of the proposed method to correlated normal-variates data.
Panel (a) shows the scatter matrix of nine data sets split into three groups (first group: x1, x2, x3, second group: x4, x5, x6 and third group: x7, x8, x9). Each group consists of three correlated normal-variates with zero correlation among the groups. Fig 5(a) shows the scatter matrix of the three groups of data (x1, …, x9). The circular pattern indicates that the two nodes are independent (or weakly correlated), whereas an elongated one shows strong correlation, either positive or negative depending on the orientation of the pattern. Panel (b) is the ordered MIR¯XY for the correlated variates. The red dash line corresponds to τ ≈ 0.06. Panel (c) shows the successfully inferred network resulting from (b).
Fig 6
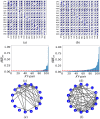
Fig 6. Scatter plots and inferred networks for the financial-markets data.
Panels (a), (c) and (e) show the scatter matrix, ordered MIR¯XY values and network of the 15 currency exchange rates. Panels (b), (d) and (f) similarly for the 15 stock indices. The red dash line in (c) corresponds to τ ≈ 0.03 and in (d) to τ ≈ 0.05. Note that in panels (e) and (f), the nodes represent the currency exchange rates and stock indices for the 15 currency areas, respectively, as in Table 1.

References

    1. Mauboussin MJ. Revisiting market efficiency: The stock market as a complex adaptive system. Journal of Applied Corporate Finance. 2002;14(4):47–55. doi: 10.1111/j.1745-6622.2002.tb00448.x - DOI
    1. Mantegna RN. Hierarchical structure in financial markets. The European Physical Journal B-Condensed Matter and Complex Systems. 1999;11(1):193–197. doi: 10.1007/s100510050929 - DOI
    1. Tumminello M, Aste T, Di Matteo T, Mantegna RN. A tool for filtering information in complex systems. Proceedings of the National Academy of Sciences of the United States of America. 2005;102(30):10421–10426. doi: 10.1073/pnas.0500298102 - DOI - PMC - PubMed
    1. Vodenska I, Becker AP, Zhou D, Kenett DY, Stanley HE, Havlin S. Community analysis of global financial markets. Risks. 2016;4(2):13 doi: 10.3390/risks4020013 - DOI
    1. Tumminello M, Coronnello C, Lillo F, Micciche S, Mantegna RN. Spanning trees and bootstrap reliability estimation in correlation-based networks. International Journal of Bifurcation and Chaos. 2007;17(7):2319–2329. doi: 10.1142/S0218127407018415 - DOI

LinkOut - more resources