Comparative Study
. 2018 Feb 8;13(2):e0192645.
doi: 10.1371/journal.pone.0192645. eCollection 2018.

A comparison of RSV and influenza in vitro kinetic parameters reveals differences in infecting time

Affiliations
Comparative Study

A comparison of RSV and influenza in vitro kinetic parameters reveals differences in infecting time

Gilberto Gonzàlez-Parra et al. PLoS One. .

Abstract

Influenza and respiratory syncytial virus (RSV) cause acute infections of the respiratory tract. Since the viruses both cause illnesses with similar symptoms, researchers often try to apply knowledge gleaned from study of one virus to the other virus. This can be an effective and efficient strategy for understanding viral dynamics or developing treatment strategies, but only if we have a full understanding of the similarities and differences between the two viruses. This study used mathematical modeling to quantitatively compare the viral kinetics of in vitro RSV and influenza virus infections. Specifically, we determined the viral kinetics parameters for RSV A2 and three strains of influenza virus, A/WSN/33 (H1N1), A/Puerto Rico/8/1934 (H1N1), and pandemic H1N1 influenza virus. We found that RSV viral titer increases at a slower rate and reaches its peak value later than influenza virus. Our analysis indicated that the slower increase of RSV viral titer is caused by slower spreading of the virus from one cell to another. These results provide estimates of dynamical differences between influenza virus and RSV and help provide insight into the virus-host interactions that cause observed differences in the time courses of the two illnesses in patients.


Conflict of interest statement

Competing Interests: FDR, DH, DR, and GI are employees of Janssen R&D Belgium. HMD received funding from Janssen R&D Belgium, and GG’s salary was paid by a grant from Janssen R&D Belgium. This does not alter our adherence to PLOS ONE policies on sharing data and materials.

Figures

Fig 1
Fig 1. Viral kinetics model.
The virus, V, attacks target cells, T, at rate β. Once infected, target cells enter the eclipse phase, E. The eclipse phase lasts an average time of τE, after which the cells become infectious cells, I. The infectious cells produce new virions at rate p, and the virus decays at rate c. The cells remain infectious for an average time of τI, after which they die.
Fig 2
Fig 2. Study data.
In vitro RSV and influenza virus infection data used in this study.
Fig 3
Fig 3. Empirical and viral kinetics model fits.
We fit both the empirical model (Eq (1)) and the viral kinetics model (Eq (2)) to each of the RSV and influenza virus viral time courses. The best fit curves are shown in Fig 3 where the red dashed line represents the best fit empirical model and the blue solid line represents the best fit viral kinetics model. The extracted parameter values are presented in Table 2 for the empirical model and in Table 3 for the viral kinetics model.
Fig 4
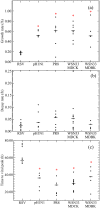
Fig 4. Comparison of empirical model parameters.
Graphs show the distributions of (a) growth rate, (b) decay rate, (c) time to peak viral titer estimated from fits of the empirical model for RSV and the different strains of influenza virus. Statistically significant differences (p < 0.05) between RSV and a particular influenza virus strain are indicated with an asterisk. The p-values for the Mann-Whitney test are given in Table 4. Median values are indicated with a solid black line.
Fig 5
Fig 5. Comparison of viral kinetics parameters.
Graphs show the distributions of (a) infecting time (tinf), (b) duration of the infectious phase (τI), (c) duration of the eclipse phase (τE), and (d) degradation rate (c) estimated from fits of the gamma model for RSV and the different strains of influenza virus. Statistically significant differences (p < 0.05) between RSV and a particular influenza virus strain are indicated with an asterisk. The p-values for the Mann-Whitney test are given in Table 4. Median values are indicated with a solid black line.
Fig 6
Fig 6. Differences in infection time course.
(a) Predicted time courses of RSV, pH1N1, PR8, WSN33 MDCK, and WSN33 MDBK using the median values (Table 3) for each of the parameters in the viral kinetics model (Eq (2)). (b) A schematic diagram of the duration of different phases (using median values) of the viral replication cycle for RSV, pH1N1, PR8, WSN33 MDCK, and WSN33 MDBK.

References

    1. Pavia AT. Viral Infections of the Lower Respiratory Tract: Old Viruses, New Viruses, and the Role of Diagnosis. Clin Infect Dis. 2011;52(S4):S284–S289. doi: 10.1093/cid/cir043 - DOI - PMC - PubMed
    1. Goka EA, Vallely PJ, Mutton KJ, Klapper PE. Single, dual and multiple respiratory virus infections and risk of hospitalization and mortality. Epidemiol Infect. 2015;143(1):37–47. doi: 10.1017/S0950268814000302 - DOI - PMC - PubMed
    1. Monto A, Sullivan K. Acute Respiratory Illness in the Community—Frequency of Illness and the Agents Involved. Epidemiol Infect. 1993;110(1):145–160. doi: 10.1017/S0950268800050779 - DOI - PMC - PubMed
    1. Caul EO, Waller DK, Clarke SKR, Corner BD. A Comparison of Influenza and Respiratory Syncytial Virus Infections among Infants Admitted to Hospital with Acute Respiratory Infections. J Hyg. 1976;77(3):383–392. doi: 10.1017/S0022172400055765 - DOI - PMC - PubMed
    1. Fleming DM, Pannell RS, Cross KW. Mortality in children from influenza and respiratory syncytial virus. J Epidemiol Community Health. 2005;59:586–590. - PMC - PubMed

Publication types

MeSH terms

LinkOut - more resources