. 2018 Jul 1;35(13):1419-1436.
doi: 10.1089/neu.2017.5399. Epub 2018 May 3.

Chronic Alterations in Systemic Immune Function after Traumatic Brain Injury

Affiliations

Chronic Alterations in Systemic Immune Function after Traumatic Brain Injury

Rodney M Ritzel et al. J Neurotrauma. .

Abstract

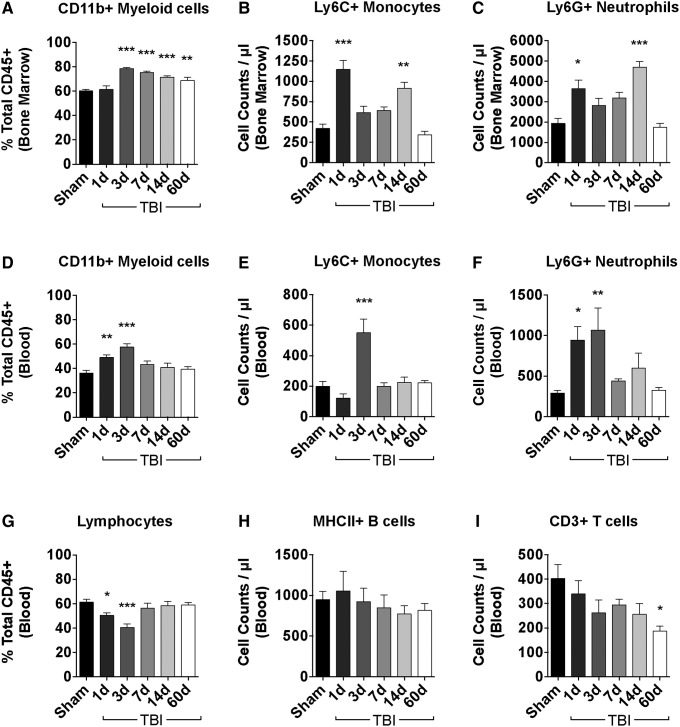
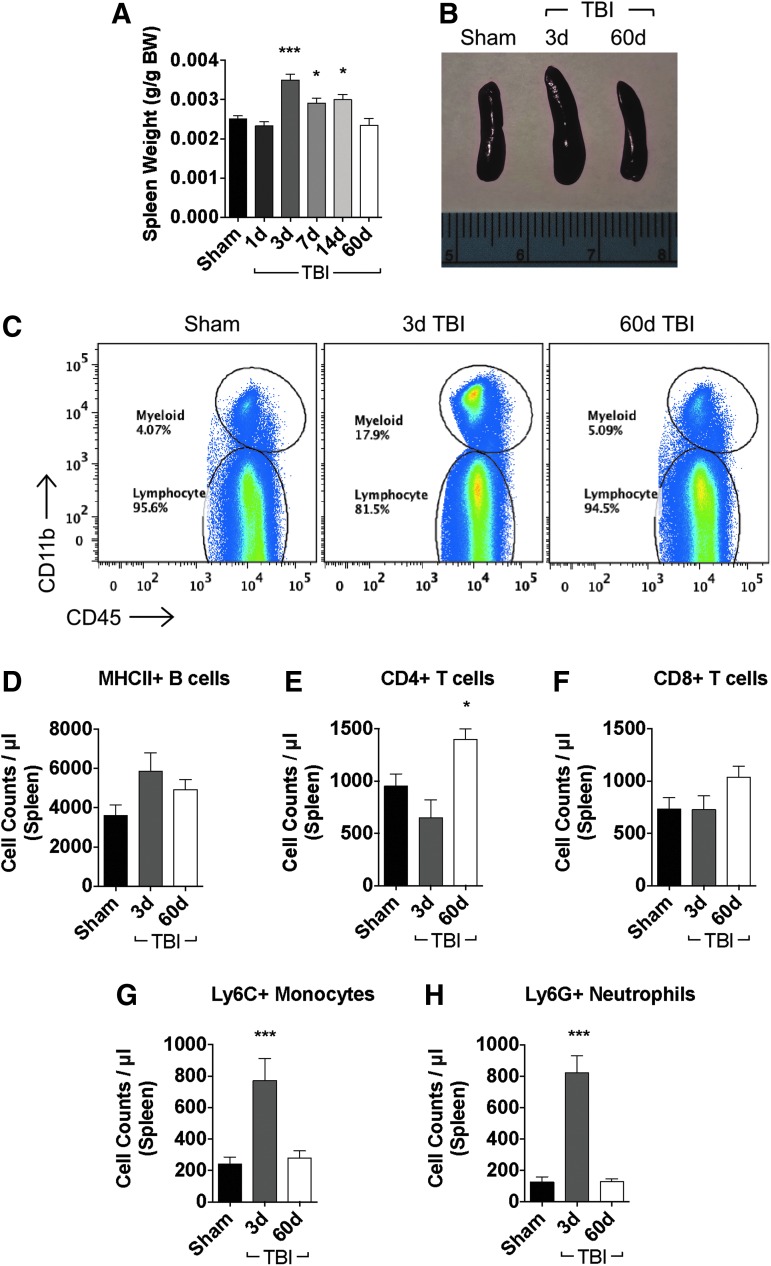
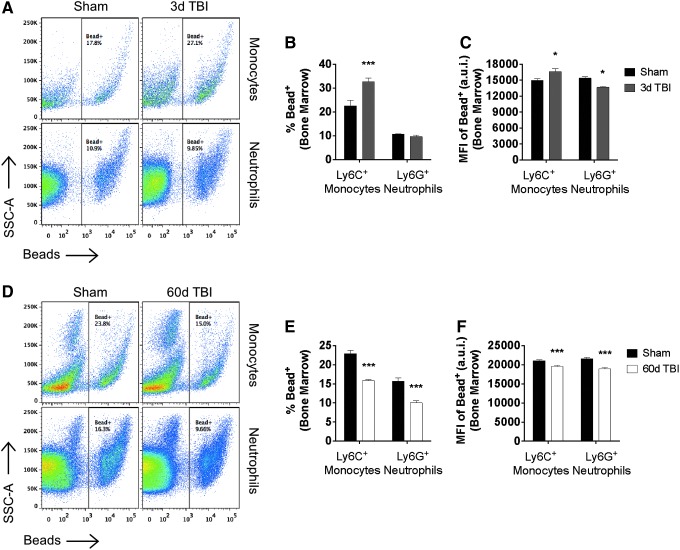
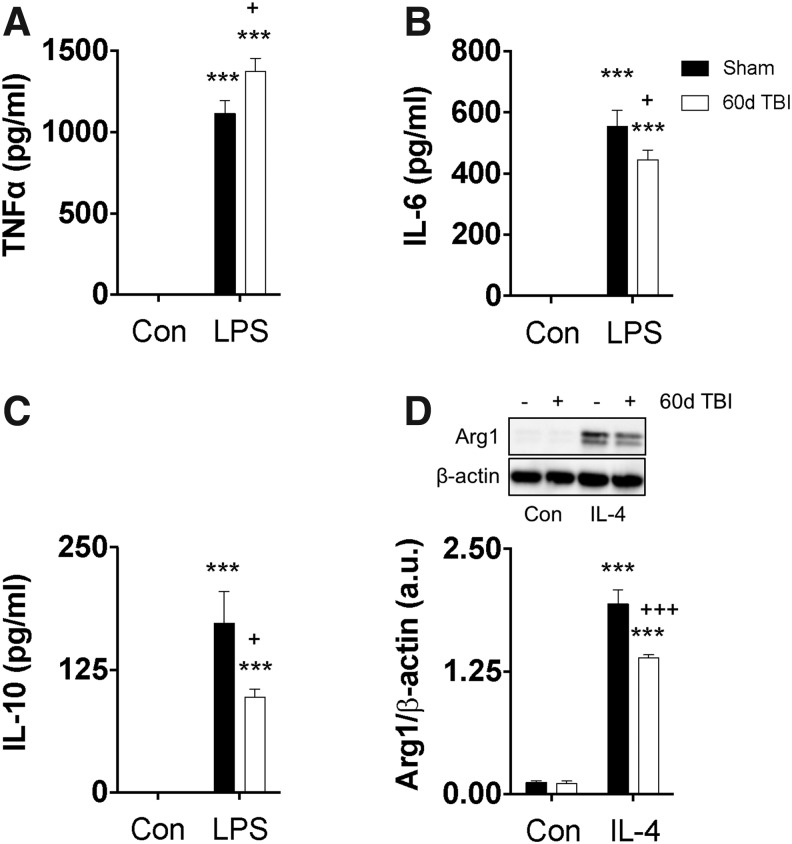
There is a compelling link between severe brain trauma and immunosuppression in patients with traumatic brain injury (TBI). Although acute changes in the systemic immune compartment have been linked to outcome severity, the long-term consequences of TBI on systemic immune function are unknown. Here, adult male C57Bl/6 mice underwent moderate-level controlled cortical impact (CCI) or sham surgery, and systemic immune function was evaluated at 1, 3, 7, 14, and 60 days post-injury. Bone marrow, blood, thymus, and spleen were examined by flow cytometry to assess changes in immune composition, reactive oxygen species (ROS) production, phagocytic activity, and cytokine production. Bone marrow derived macrophages (BMDMs) from sham and 60-day CCI mice were cultured for immune challenge studies using lipopolysaccharide (LPS) and interleukin-4 (IL-4) models. Acutely, TBI caused robust bone marrow activation and neutrophilia. Neutrophils and monocytes exhibited impairments in respiratory burst, cytokine production, and phagocytosis; in contrast, ROS levels and pro-inflammatory cytokine production were chronically elevated at 60 days post-injury. Cultures of BMDMs from chronic CCI mice demonstrated defects in LPS- and IL-4-induced polarization when compared with stimulated BMDMs from sham mice. TBI also caused thymic involution, inverted CD4:CD8 ratios, chronic T lymphopenia, greater memory conversion, increased T cell activation, impaired interferon γ induction, and chronically elevated Th1 cytokine and ROS production. Collectively, our in-depth phenotypic and functional analyses demonstrate that TBI induces widespread suppression of innate and adaptive immune responses after TBI. Moreover, at chronic time points, TBI mice exhibit hallmarks of accelerated immune aging, displaying chronic deficits in systemic immune function.

Keywords: chronic inflammation; immunosuppression; systemic immunity; traumatic brain injury.


Conflict of interest statement

No competing financial interests exist.

Figures

<b>FIG. 1.</b>
FIG. 1.
Traumatic brain injury (TBI) induces distal bone marrow activation, increased neutrophil production, and chronic T lymphopenia. The relative leukocyte composition in the bone marrow and blood were assessed at the indicated time points after TBI. The percentage of CD11b+ myeloid cells was increased in the distal femur bone marrow acutely after TBI and remained elevated for several weeks (A). The absolute number of Ly6C+ monocyte (B) and Ly6G+ neutrophil (C) subsets was significantly increased by one day post-injury, remained elevated for weeks, but eventually normalized to baseline levels by day 60. The percentage of circulating CD11b+ myeloid cells in blood was acutely augmented by day one, reached its peak increase by day three, and returned to baseline by day seven (D). Cell count approximation of circulating leukocytes demonstrated a robust increase in the number of Ly6C+ monocytes (E) and Ly6G+ neutrophils (F) during the initial days after injury. The percentage of circulating bulk lymphocyte populations in blood is shown (G). No change in the number of MHCII+ B cells was seen (H), whereas a long-term reduction in CD3+ T cell counts was evident (I). For all experiments, n = 7–22/group. Statistical comparisons relative to sham control were determined by one-way analysis of variance with the Dunnett test. Error bars show mean standard error of the mean. *p < 0.05, **p < 0.01, and ***p < 0.001.
<b>FIG. 2.</b>
FIG. 2.
Moderate traumatic brain injury (TBI) results in temporary splenomegaly because of an accumulation of myeloid cells. Spleen weights were significantly increased by day three post-injury and returned to baseline size at day 60 (A; n = 7–22/group). Representative images taken from mice at acute and chronic time points after TBI are shown to illustrate changes in spleen size (B). Representative dot plots show the relative immune cell composition in the spleen after TBI (C; n = 5–10/group). Cell count data show no change in MHCII+ B cells (D). The number of CD4+ T cells was significantly increased by day 60 after TBI (E), whereas no statistical change in CD8+ T cell counts was found (F). A significant accumulation of Ly6C+ monocytes (G) and Ly6G+ neutrophils (H) was seen in the spleen at day three. Statistical comparisons relative to sham control were determined by one-way analysis of variance with the Dunnett test. Error bars show mean standard error of the mean. BW, body weight. *p < 0.05, ***p < 0.001. Color image is available online at www.liebertpub.com/neu
<b>FIG. 3.</b>
FIG. 3.
Moderate traumatic brain injury (TBI) results in chronic thymic atrophy and defects in T cell maturation. Thymus weights were decreased dramatically by day one after TBI, displayed a modest rebound in weight over time, but remained significantly decreased at day 60 (A; n = 7–22/group). Representative images taken from mice at acute and chronic time points after TBI are shown to illustrate changes in thymus size (B). Representative dot plots illustrate the impact of TBI on T cell maturation in the thymus (C; n = 5–10/group). Cell count analyses reveal an acute decrease in the number of double-negative (CD4-CD8-) (D) and double-positive (CD4+CD8+) CD3+ T cells (E), and a modest decrease in CD4+ (F) and CD8+ (G) T cells. Statistical comparisons relative to sham control were determined by one-way analysis of variance with the Dunnett test. Error bars show mean standard error of the mean. BW, body weight. *p < 0.05, ***p < 0.001. Color image is available online at www.liebertpub.com/neu
<b>FIG. 4.</b>
FIG. 4.
Chronic elevation of oxidative stress levels in leukocytes after traumatic brain injury (TBI). Basal cellular reactive oxygen species (ROS) levels were measured using dihydrorhodamine (DHR) 123. Representative histograms reveal relative ROS production of Ly6C+ monocytes and Ly6G+ neutrophils in the bone marrow after TBI: A; Ly6C+ monocytes – sham (blue, open), Ly6C+ monocytes – TBI (blue, tinted), Ly6G+ neutrophils – sham (red, open), Ly6G+ neutrophils – TBI (red, tinted), and fluorescence minus one (FMO) control (gray). Quantification of mean fluorescence intensity (MFI) values was expressed as fold-change relative to sham control and showed increased ROS production in both cell types at day three, followed by a sharp reduction by day seven (B). A considerable increase in basal oxidative stress levels can be seen at day 60 after TBI, wherein an analysis of relative cellular ROS levels reveals this effect is driven largely by increases in Ly6C+ monocyte-derived ROS (C). Representative histograms demonstrate a similar biphasic pattern of ROS production in circulating leukocytes: D; Ly6C+ monocytes – sham (blue, open), Ly6C+ monocytes – TBI (blue, tinted), Ly6G+ neutrophils – sham (red, open), Ly6G+ neutrophils – TBI (red, tinted), CD3+ T cells – sham (green, open), CD3+ T cells – TBI (green, tinted), MHCII+ B cells – sham (orange, open), MHCII+ B cells – TBI (orange, tinted), and FMO control (tinted gray). Neutrophil ROS levels were significantly depressed at days one and seven, temporarily elevated at day three, and remained substantially higher than baseline at day 60 after TBI (E). Lymphocyte ROS levels were decreased modestly in the first week after TBI; however, dramatic increases in ROS levels were observed over time. The long-term potentiation of oxidative stress levels was more prominent in myeloid cell populations than in lymphocytes (F). For all experiments, n = 5–8/group. Statistical comparisons between time points were evaluated by two-way analysis of variance with the Dunnett (B and E) and Sidak (C and F) test. Error bars show mean standard error of the mean. a.u.i.. arbitrary units of intensity. *p < 0.05, **p < 0.01, and ***p < 0.001. Color image is available online at www.liebertpub.com/neu
<b>FIG. 5.</b>
FIG. 5.
Chronic impairment of respiratory burst activity in phagocytes after traumatic brain injury (TBI). Respiratory burst activity was measured following phorbol 12-myristate 13-acetate (PMA)/ionomycin stimulation. Representative histograms show the relative level of ROS production in bone marrow-derived myeloid subsets as determined by dihydrorhodamine (DHR) 123 staining: A; Ly6C+ monocytes – sham (blue full, open), Ly6C+ monocytes – sham + stim (blue hatched, open), Ly6C+ monocytes – TBI (blue full, tinted), Ly6C+ monocytes – TBI + stim (blue hatched, tinted), Ly6G+ neutrophils – sham (red full, open), Ly6G+ neutrophils – sham + stim (red hatched, open) Ly6G+ neutrophils – TBI (red full, tinted), Ly6G+ neutrophils – TBI + stim (red full, tinted), and fluorescence minus one (FMO) control (gray). No change in the respiratory burst potential of Ly6C+ monocytes and Ly6G+ neutrophils was observed at day three after TBI (B). Significant impairment in reactive oxygen species (ROS) generation was found in both cell types at day 60 after TBI (C). For all experiments, n = 5–8/group. Statistical comparisons between groups were determined by two-way analysis of variance with Tukey post hoc test. Error bars show mean standard error of the mean. MFI, mean fluorescence intensity; stim, stimulation; a.u.i., arbitrary units of intensity. ***p < 0.001. Color image is available online at www.liebertpub.com/neu
<b>FIG. 6.</b>
FIG. 6.
Traumatic brain injury (TBI) induces acute suppression and chronic upregulation of pro-inflammatory cytokine production in peripheral myeloid cells. Representative dot plots depict the expression pattern of tumor necrosis factor (TNF) in Ly6C+ monocytes and Ly6G+ neutrophils in bone marrow at day three post-injury (A). A lower percentage of TNF-positive myeloid cells was found in the acute period after TBI (B). The relative expression level of TNF-positive monocytes was reduced significantly as determined by two-way group analysis of variance (ANOVA) (C). Representative dot plots depict the expression pattern of interleukin (IL)-1β in Ly6C+ monocytes and Ly6G+ neutrophils in bone marrow at day three post-injury (D). Percentage of IL-1β-positive myeloid cells was equal in sham and TBI groups at three days post-injury (E); however, the relative expression level of IL-1β-positive Ly6C+ monocytes was significantly reduced after TBI (F). The long-term impact of TBI on myeloid cell IL-1β production in the spleen was also evaluated at day 60 post-injury (G). The percentage of IL-1β-positive Ly6G+ neutrophils was significantly increased (∼ doubled) at 60 days post-injury (H). For all experiments, n = 5–7/group. Statistical comparisons between groups were determined by two-way ANOVA with Sidak test. Error bars show mean standard error of the mean. FMO, fluorescence minus one; SSC-A, side scatter-area; MFI, mean fluorescence intensity; a.u.i., arbitrary units of intensity; n.s., not significant. *p < 0.05, **p < 0.01, and ***p < 0.001. Color image is available online at www.liebertpub.com/neu
<b>FIG. 7.</b>
FIG. 7.
Traumatic brain injury (TBI) causes long-term deficits in phagocytic activity of peripheral myeloid cells. Representative dot plots show the acute effect of TBI on the phagocytic function of bone marrow-derived Ly6C+ monocytes and Ly6G+ neutrophils at day three post-injury (A). TBI-induced bone marrow activation leads to a significant increase in number of bead-positive Ly6C+ monocytes compared with sham control, but no change in the percentage of bead-positive Ly6G+ neutrophils (B). The level of phagocytic activity (i.e., number of beads per bead-positive cell) was increased similarly in Ly6C+ monocytes at day three, whereas Ly6C+ neutrophils exhibited a significant reduction in the number of beads they were capable of ingesting (C). Representative dot plots depicting the phagocytic function of bone marrow-derived Ly6C+ monocytes and Ly6G+ neutrophils at day 60 post-injury (D). The percentage of bead-positive Ly6C+ monocytes and Ly6C+ neutrophils was reduced significantly at 60 days after TBI (E), as was the level of phagocytic activity for bead-positive cells in each population (F). For all experiments, n = 5–6/group. Statistical comparisons between groups were determined by two-way analysis of variance with the Sidak test. Error bars show mean standard error of the mean. SSC-A, side scatter-area; MFI, mean fluorescence intensity; a.u.i., arbitrary units of intensity. *p < 0.05 and ***p < 0.001. Color image is available online at www.liebertpub.com/neu
<b>FIG. 8.</b>
FIG. 8.
Traumatic brain injury (TBI) causes chronic impairment in stimulus-induced phagocytic activity. Representative histograms demonstrate chronic impairments in phagocytic function stimulation with phorbol 12-myristate 13-acetate (PMA)/ionomycin in myeloid cells in the spleen at day 60 post-injury: A: Ly6C+ monocytes (blue), Ly6G+ neutrophils (red), Sham groups (open), TBI groups (tinted), vehicle (solid), stimulation (dashed), and fluorescence minus one (FMO) control (tinted gray). The percentage of bead-positive Ly6G+ neutrophils decreased significantly after stimulation compared with control, which showed an increase in bead uptake (B). The number of beads ingested by each phagocyte was impaired similarly after stimulation in myeloid cells harvested 60 days after TBI (C; n = 6/group). Statistical comparisons between time points were evaluated by two-way analysis of variance with the Sidak test (B and C). Error bars show mean standard error of the mean. MFI, mean fluorescence intensity. **p < 0.01 and ***p < 0.001. Color image is available online at www.liebertpub.com/neu
<b>FIG. 9.</b>
FIG. 9.
Traumatic brain injury (TBI) induces acute suppression and chronic upregulation of Th1 cytokine production in T lymphocytes. Representative histograms illustrate the relative production levels of interferon (IFN)γ (A) and tumor necrosis factor (TNF) (C) in CD4+ and CD8+ T cell subsets in the spleen at day three post-injury (CD4+ – sham (blue full, open), CD4+ – TBI (blue full, tinted), CD4+ – sham + stim (blue hatched, open), CD4+ – TBI + stim (blue hatched, tinted), CD8+ – sham (red full, open), CD8+ – TBI (red full, tinted), CD8+ – sham + stim (red hatched, open), CD8+ – TBI + stim (red full, tinted), and FMO control (gray); vertical fiducial line included for reference). The MFI of IFNγ-positive (C) and TNF-positive (D) T cells for all groups is shown. Following stimulation with phorbol 12-myristate 13-acetate (PMA)/ionomycin, IFNγ expression levels were significantly reduced in CD4+ and CD8+ T cells, whereas TNF expression was only significantly reduced in CD4+ T cells. Representative histograms illustrate the relative production levels of IFNγ (E) and TNF (F) in CD4+ and CD8+ T cell subsets at day 60 post-injury (CD4+ – sham (blue full, open), CD4+ – TBI (blue full, tinted), CD4+ – sham + stim (blue hatched, open), CD4+ – TBI + stim (blue hatched, tinted), CD8+ – sham (red full, open), CD8+ – TBI (red full, tinted), CD8+ – sham + stim (red hatched, open), CD8+ – TBI + stim (red full, tinted), and fluorescence minus one (FMO) control (gray); vertical fiducial line included for reference). The percentage of IFNγ-positive (G) and TNF-positive (H) T cells for all groups is shown. After PMA/ionomycin stimulation, IFNγ expression levels in the 60-day TBI group was significantly increased in CD8+ T cells only. There was a significant increase in the percentage of TNF-positive CD4+ and CD8+ T cells in the 60-day TBI group that was increased further after stimulation. For all experiments, n = 7/group. Statistical comparisons between stimulation groups were performed using two-way analysis of variance with the Sidak test. Error bars show mean standard error of the mean. MFI, mean fluorescence intensity; a.u.i., arbitrary units of intensity. *p < 0.05, **p < 0.01, and ***p < 0.001. Color image is available online at www.liebertpub.com/neu
<b>FIG. 10.</b>
FIG. 10.
Long-term changes in T cell memory phenotype, T cell antigen receptors (TCR) activation state, and CD4:CD8 ratios after TBI. Chronic alterations in the circulating T cell compartment were assessed after TBI. Representative dot plots depict the relative proportion of naïve (CD44-CD62L+), central memory (CD44+CD62L+), and effector memory (CD44+CD62L-) populations in CD4+ T cell subsets (A). The percentage of naïve, central memory, and effector memory CD4+ (B) T cells was quantified (n = 9–15/group). The mean fluorescence intensity (MFI) of CD44+ T cells were quantified (C). A representative dot plot shows CD69 expression on T cell subsets at day 60 after TBI (D). The percentage of CD69-positive CD4+ T cells was significantly increased after TBI (E; n = 5/group). The CD4:CD8 ratio in the blood was significantly inverted at day 60 after TBI (F). Statistical comparisons between stimulation groups were performed using two-way analysis of variance with the Sidak test. Error bars show mean standard error of the mean. SSC-A, side scatter-area. *p < 0.05, **p < 0.01, and ***p < 0.001. Color image is available online at www.liebertpub.com/neu
<b>FIG. 11.</b>
FIG. 11.
Traumatic brain injury (TBI)-induced chronic bone marrow dysfunction persists in the absence of brain injury or environmental cues. Bone marrow-derived macrophages were harvested from age-matched sham and TBI mice at day 60 and cultured in vitro to assess polarization dynamics after either lipopolysaccharide (LPS) or interleukin (IL)-4 stimulation. Supernatants were examined by enzyme-linked immunosorbent assay, and secreted protein concentrations for tumor necrosis factor (TNF) (A), IL-6 (B), and IL-10 (C) were quantified under control and LPS-stimulated conditions. Representative images of Western blots and subsequent densitometry quantification showing relative protein expression of Arg1/β-actin (D) in whole cell lysate under control and IL-4–stimulated conditions. For all experiments, n = 5/group. Statistical comparisons between stimulation groups were performed using two-way analysis of variance with the Sidak test. Error bars show mean standard error of the mean. a.u. arbitrary unit. *p < 0.05 and ***p < 0.001.

References

    1. Hyder A.A., Wunderlich C.A., Puvanachandra P., Gururaj G., and Kobusingye O.C. (2007). The impact of traumatic brain injuries: a global perspective. NeuroRehabilitation 22, 341–353 - PubMed
    1. Langlois J.A., Rutland-Brown W., and Wald M.M. (2006). The epidemiology and impact of traumatic brain injury: a brief overview. J. Head Trauma Rehabil. 21, 375–378 - PubMed
    1. Hazeldine J., Lord J.M., and Belli A. (2015). Traumatic brain injury and peripheral immune suppression: primer and prospectus. Front. Neurol. 6, 235. - PMC - PubMed
    1. Alharfi I.M., Charyk Stewart T., Al Helali I., Daoud H., and Fraser D.D. (2014). Infection rates, fevers, and associated factors in pediatric severe traumatic brain injury. J. Neurotrauma 31, 452–458 - PubMed
    1. Scott B.N., Roberts D.J., Robertson H.L., Kramer A.H., Laupland K.B., Ousman S.S., Kubes P., and Zygun D.A. (2013). Incidence, prevalence, and occurrence rate of infection among adults hospitalized after traumatic brain injury: study protocol for a systematic review and meta-analysis. Syst. Rev. 2, 68. - PMC - PubMed

Publication types