. 2018 Feb 8;15(1):36.
doi: 10.1186/s12974-018-1082-z.

Hyperammonemia alters membrane expression of GluA1 and GluA2 subunits of AMPA receptors in hippocampus by enhancing activation of the IL-1 receptor: underlying mechanisms

Affiliations

Hyperammonemia alters membrane expression of GluA1 and GluA2 subunits of AMPA receptors in hippocampus by enhancing activation of the IL-1 receptor: underlying mechanisms

Lucas Taoro-Gonzalez et al. J Neuroinflammation. .

Abstract

Background: Hyperammonemic rats reproduce the cognitive alterations of patients with hepatic encephalopathy, including altered spatial memory, attributed to altered membrane expression of AMPA receptor subunits in hippocampus. Neuroinflammation mediates these cognitive alterations. We hypothesized that hyperammonemia-induced increase in IL-1β in hippocampus would be responsible for the altered GluA1 and GluA2 membrane expression. The aims of this work were to (1) assess if increased IL-1β levels and activation of its receptor are responsible for the changes in GluA1 and/or GluA2 membrane expression in hyperammonemia and (2) identify the mechanisms by which activation of IL-1 receptor leads to altered membrane expression of GluA1 and GluA2.

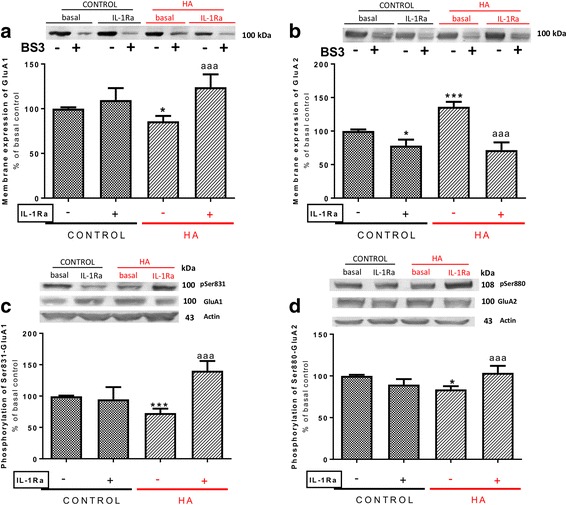
Methods: We analyzed in hippocampal slices from control and hyperammonemic rat membrane expression of AMPA receptors using the BS3 cross-linker and phosphorylation of the GluA1 and GluA2 subunits using phosphor-specific antibodies. The IL-1 receptor was blocked with IL-Ra, and the signal transduction pathways involved in modulation of membrane expression of GluA1 and GluA2 were analyzed using inhibitors of key steps.

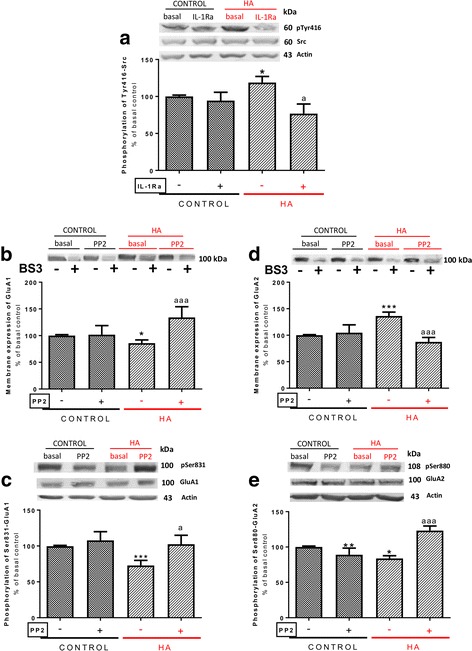
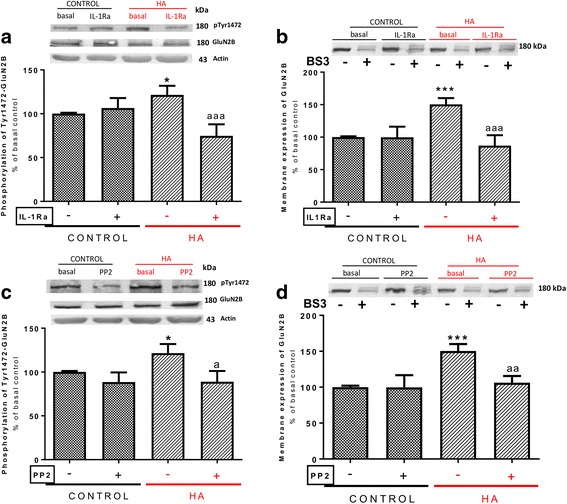
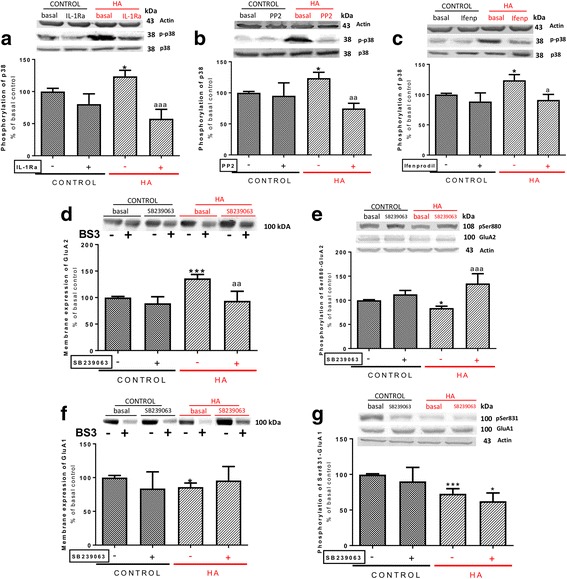
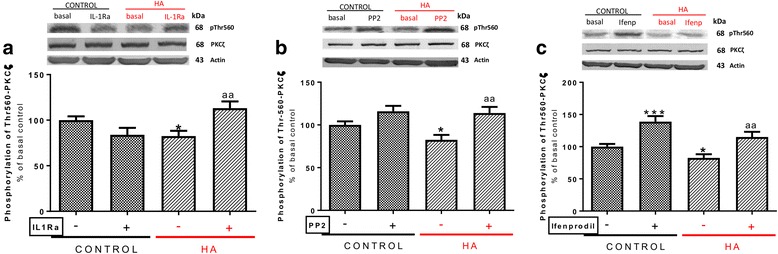
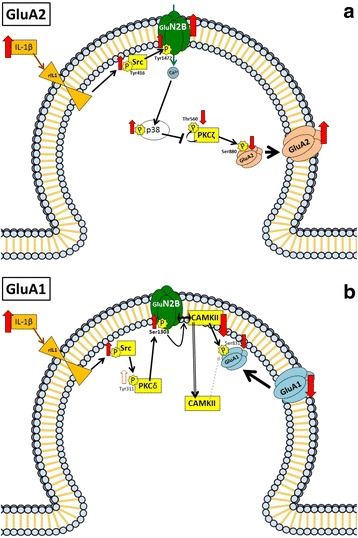
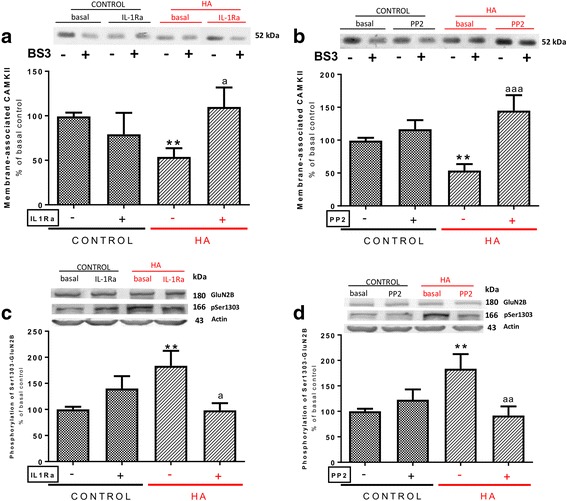
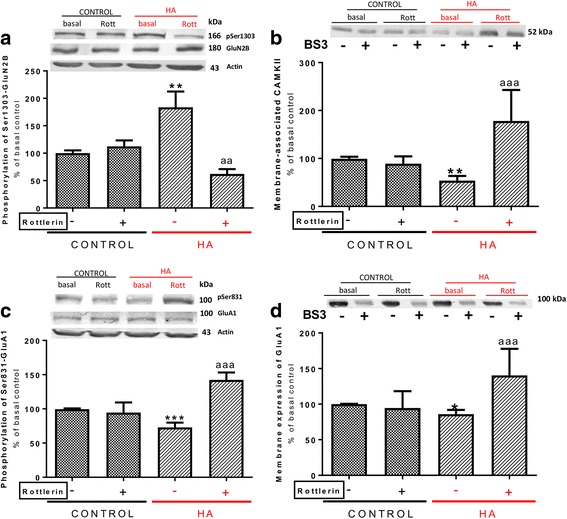
Results: Hyperammonemia reduces GluA1 and increases GluA2 membrane expression and reduces phosphorylation of GluA1 at Ser831 and of GluA2 at Ser880. Hyperammonemia increases IL-1β, enhancing activation of IL-1 receptor. This leads to activation of Src. The changes in membrane expression of GluA1 and GluA2 are reversed by blocking the IL-1 receptor with IL-1Ra or by inhibiting Src with PP2. After Src activation, the pathways for GluA2 and GluA1 diverge. Src increases phosphorylation of GluN2B at Tyr14721 and membrane expression of GluN2B in hyperammonemic rats, leading to activation of MAP kinase p38, which binds to and reduces phosphorylation at Thr560 and activity of PKCζ, resulting in reduced phosphorylation at Ser880 and enhanced membrane expression of GluA2. Increased Src activity in hyperammonemic rats also activates PKCδ which enhances phosphorylation of GluN2B at Ser1303, reducing membrane expression of CaMKII and phosphorylation at Ser831 and membrane expression of GluA1.

Conclusions: This work identifies two pathways by which neuroinflammation alters glutamatergic neurotransmission in hippocampus. The steps of the pathways identified could be targets to normalize neurotransmission in hyperammonemia and other pathologies associated with increased IL-1β by acting, for example, on p38 or PKCδ. IL-1β alters membrane expression of GluA1 and GluA2 AMPA receptor subunits by two difrerent mechanisms in the hippocampus of hyperammonemic rats.

Keywords: AMPA receptors; GluA1; GluA2; Hepatic encephalopathy; Hyperammonemia; IL-1 receptor; IL-1β; Membrane expression; Neuroinflammation; Neurotransmission.


Conflict of interest statement

Ethics approval and consent to participate

The experiments were approved by the Comite de Etica y Bienestar en Experimentacion Animal, Prince Felipe Research Center-Consellería de Agricultura, Generalitat Valenciana, and carried out in accordance with the European Communities Council Directive (86/609/EEC).

Consent for publication

Not applicable

Competing interests

The authors declare that they have no competing interests.

Publisher’s Note

Springer Nature remains neutral with regard to jurisdictional claims in published maps and institutional affiliations.

Figures

Fig. 1
Fig. 1
Blocking IL-1 receptor with IL-1Ra normalizes both phosphorylation and membrane expression of the GluA1 and GluA2 subunits in hyperammonemic rats. IL-1Ra, an antagonist of IL-1 receptor, was added to hippocampal slices. Membrane expression of GluA1 (a) and GluA2 (b) subunits and phosphorylation of GluA1 at Ser831 (c) and of GluA2 at Ser880 (d) were analyzed as described in the “Methods” section. Values are expressed as percentage of basal levels in control rats and are the mean ± SEM of 24, 34, 31, and 18 rats per group in a, b, c, and d respectively. Data were analyzed by two-way ANOVA. In a, F (1, 92) = 0.004596 for effect of HA, p = 0.9461; F (1, 92) = 11.77 for effect of IL1Ra, p = 0.0009; and F (1, 92) = 0.0368 for interaction, p = 0.0368. In b, F (1, 132) = 4.893 for effect of HA, p = 0.0287; F (1, 132) = 41.17 for effect of IL1Ra, p < 0.0001; and F (1, 132) = 9.953 for interaction, p = 0.0020. In c, F (1, 118) = 1.122 for effect of HA, p = 0.2915; F (1, 118) = 11.24 for effect of IL1Ra, p < 0.0001; and F (1, 118) = 15.73 for interaction, p = 0.0001. In d, F (1, 68) = 1.028 for effect of HA, p = 0.3142; F (1, 68) = 4.783 for effect of IL1Ra, p = 0.0322; and F (1, 68) = 22.11 for interaction, p < 0.0001. Values significantly different from control rats are indicated by asterisk and from hyperammonemic rats are indicated by “a”. Bonferroni post-test: *p < 0.05, ***p < 0.001, aaap < 0.001
Fig. 2
Fig. 2
IL-1 receptor-mediated activation of Src leads to the alterations in membrane expression and phosphorylation of GluA1 and GluA2 subunit in hyperammonemic rats. IL-1Ra or PP2, an inhibitor of Src kinase, were added to hippocampal slices. Phosphorylation of Src at Tyr416 (a), of GluA1 at Ser831 (c), of GluA2 at Ser880 (e), and membrane expression of GluA1 (b) and GluA2 (d) were analyzed as described in the “Methods” section. Values are expressed as percentage of basal levels in control rats and are the mean ± SEM of 24, 22, 33, 32, and 18 rats per group in a, b, c, d, and e respectively. Data were analyzed by two-way ANOVA. In a, F (1, 92) = 0.005730 for effect of HA, p = 0.9398; F (1, 92) = 5.434 for effect of IL1Ra, p = 0.0219; and F (1, 92) = 3.058 for interaction, p = 0.0837. In b, F (1, 83) = 1.361 for effect of HA, p = 0.2466; F (1, 83) = 9.148 for effect of PP2, p = 0.0033; and F (1, 83) = 8.418 for interaction, p = 0.0048. In c, F (1, 127) = 4.230 for effect of HA, p = 0.0418; F (1, 127) = 5.912 for effect of PP2, p = 0.0164; and F (1, 127) = 2.146 for interaction, p = 0.1454. In d, F (1, 123) = 1.545 for effect of HA, p = 0.2162; F (1, 123) = 8.038 for effect of PP2, p = 0.0054; and F (1, 123) = 11.17 for interaction, p = 0.0011. In e, F (1, 68) = 7.756 for effect of HA, p = 0.0069; F (1, 68) = 7.864 for effect of PP2, p = 0.0066; and F (1, 68) = 44.50 for interaction, p < 0.0001. Values significantly different from control rats are indicated by asterisk and from hyperammonemic rats are indicated by “a”. Bonferroni post-test: *p < 0.05, **p < 0.01, ***p < 0.001, ap < 0.05, aaap < 0.001
Fig. 3
Fig. 3
IL-1 receptor and Src activation lead to increased phosphorylation at Tyr1472 and membrane expression of the GluN2B subunit in hyperammonemic rats. IL-1Ra or PP2, an inhibitor of Src kinase, were added to hippocampal slices. Phosphorylation of GluN2B at Tyr1472 (a, c) and membrane expression of GluN2B (b, d) were analyzed as described in the “Methods” section. Values are expressed as percentage of basal levels in control rats and are the mean ± SEM of 27, 37, 28, and 37 rats per group in a, b, c, and d respectively. Data were analyzed by two-way ANOVA. In a, F (1, 104) = 0.3170 for effect of HA, p = 0.5746; F (1, 104) = 5.592 for effect of IL-1Ra, p = 0.0199; and F (1, 104) = 9.208 for interaction, p = 0.0030. In b, F (1, 143) = 3.642 for effect of HA, p = 0.0583; F (1, 143) = 10.33 for effect of IL-1Ra, p = 0.0016; and F (1, 143) = 9.704 for interaction, p = 0.0022. In c, F (1, 106) = 1.727 for effect of HA, p = 0.1917; F (1, 106) = 6.991 for effect of PP2, p = 0.0094; and F (1, 106) = 1.457 for interaction, p = 0.2302. In d, F (1, 143) = 8.814 for effect of HA, p = 0.0035; F (1, 143) = 5.432 for effect of PP2, p = 0.0212; and F (1, 143) = 4.963 for interaction, p = 0.0275. Values significantly different from control rats are indicated by asterisk and from hyperammonemic rats are indicated by “a”. Bonferroni post-test: *p < 0.05, ***p < 0.001, ap < 0.05, aap < 0.01, aaap < 0.001
Fig. 4
Fig. 4
IL-1 receptor, Src, and GluN2B-mediated activation of p38 leads to the alterations in membrane expression and phosphorylation of the GluA2 but not of the GluA1 subunit in hyperammonemic rats. IL-1Ra, PP2, SB239063, an inhibitor of p38 MAP-kinase, or ifenprodil, an antagonist of GluN2B-containing NMDA receptors, were added to hippocampal slices. Phosphorylation of p38 (a, b, c), GluA1 at Ser831 (g), and GluA2 at Ser880 (e) and membrane expression of GluA1 (f) and GluA2 (d) subunits were analyzed as described in the “Methods” section. Values are expressed as percentage of basal levels in control rats and are the mean ± SEM of 18, 16, 20, 30, 17, 22, and 29 rats per group in a, b, c, d, e, f, and g respectively. Data were analyzed by two-way ANOVA. In a, F (1, 66) = 0.004793 for effect of HA, p = 0.9450; F (1, 66) = 23.42 for effect of IL-1Ra, p < 0.0001; and F (1, 66) = 6.695 for interaction, p = 0.0119. In b, F (1, 59) = 0.02867 for effect of HA, p = 0.8661; F (1, 59) = 6.959 for effect of PP2, p = 0.0106; and F (1, 59) = 4.611 for interaction, p = 0.0359. In c, F (1, 76) = 2.894 for effect of HA, p = 0.0930; F (1, 76) = 7.961 for effect of ifenprodil, p = 0.0061; and F (1, 76) = 1.682 for interaction, p = 0.1985. In d, F (1, 116) = 4.486 for effect of HA, p = 0.0363; F (1, 116) = 7.577 for effect of SB239063, p = 0.0069; and F (1, 116) = 2.616 for interaction, p = 0.1085. In e, F (1, 64) = 0.2959 for effect of HA, p = 0.5883; F (1, 64) = 26.34 for effect of SB239063, p < 0.0001; and F (1, 64) = 10.08 for interaction, p = 0.0023. In f, F (1, 83) = 0.006480 for effect of HA, p = 0.9360; F (1, 83) = 0.1665 for effect of SB239063, p = 0.6843; and F (1, 83) = 2.228 for interaction, p = 0.1393. In g, F (1, 110) = 6.864 for effect of HA, p = 0.0100; F (1, 110) = 0.9431 for effect of SB239063, p = 0.3336; and F (1, 110) = 0.001793 for interaction, p = 0.9663. Values significantly different from control rats are indicated by asterisk and from hyperammonemic rats are indicated by “a”. Bonferroni post-test: *p < 0.05, ***p < 0.001, ap < 0.05, aap < 0.01, aaap < 0.001
Fig. 5
Fig. 5
Enhanced activation of IL-1 receptor, Src, and GluN2B-containing NMDA receptors leads to reduced phosphorylation of PKCζ at Thr560 in hyperammonemic rats. IL-1Ra, PP2, or ifenprodil were added to hippocampal slices. Phosphorylation of PKCζ at Thr560 was analyzed as described in the “Methods” section. Values are expressed as percentage of basal levels in control rats and are the mean ± SEM of 15 rats per group in a, b, and c. Data were analyzed by two-way ANOVA. In a, F (1, 55) = 1.077 for effect of HA, p = 0.3039; F (1, 55) = 1.220 for effect of IL-1Ra, p = 0.2742; and F (1, 55) = 14.93 for interaction, p = 0.0003. In b, F (1, 56) = 2.647 for effect of HA, p = 0.1093; F (1, 56) = 15.57 for effect of PP2, p = 0.0002; and F (1, 56) = 1.630 for interaction, p = 0.2069. In c, F (1, 55) = 10.21 for effect of HA, p = 0.0023; F (1, 55) = 30.59 for effect of ifenprodil, p < 0.0001; and F (1, 55) = 0.2520 for interaction, p = 0.6177. Values significantly different from control rats are indicated by asterisk and from hyperammonemic rats are indicated by “a”. Bonferroni post-test: *p < 0.05, ***p < 0.001, aap < 0.01
Fig. 6
Fig. 6
Scheme showing the proposed mechanisms for the IL-1β-induced alterations in membrane expression of GluA2 and GluA1 subunits of AMPA receptor in hippocampus of hyperammonemic rats. Hyperammonemia increases IL-1β, enhancing activation of IL-1 receptor. This leads to activation of Src, reflected in increased phosphorylation of Tyr416. a Src in turn enhances phosphorylation at Tyr1472 and membrane expression of GluN2B, which leads to activation of p38. Activated p38 binds to and reduces phosphorylation at Thr560 and activity of PKCζ, thus resulting in reduced phosphorylation at Ser880 and enhanced membrane expression of GluA2. b Src also activates PKCδ which enhances phosphorylation of GluN2B at Ser1303, reducing membrane expression of CaMKII and phosphorylation at Ser831 and membrane expression of GluA1
Fig. 7
Fig. 7
Enhanced activation of IL-1 receptor and Src leads to increased phosphorylation of GluN2B subunit at Ser1303 and reduced membrane-associated CaMKII in hyperammonemic rats. IL-1Ra or PP2 were added to hippocampal slices. CaMKII membrane association (a, b) and phosphorylation of GluN2B subunit at Ser1303 (c, d) were analyzed as described in the “Methods” section. Values are expressed as percentage of basal levels in control rats and are the mean ± SEM of 12, 15, 17, and 17 rats per group in a, b, c, and d respectively. Data were analyzed by two-way ANOVA. In a, F (1, 45) = 0.2872 for effect of HA, p = 0.5947; F (1, 45) = 1.742 for effect of IL-1Ra, p = 0.1936; and F (1, 45) = 7.909 for interaction, p = 0.0073. In b, F (1, 54) = 0.4278 for effect of HA, p = 0.5159; F (1, 54) = 18.16 for effect of PP2, p < 0.0001; and F (1, 54) = 8.633 for interaction, p = 0.0048. In c, F (1, 63) = 1.059 for effect of HA, p = 0.3073; F (1, 63) = 1.244 for effect of IL-1Ra, p = 0.2689; and F (1, 63) = 9.532 for interaction, p = 0.0030. In d, F (1, 63) = 1.701 for effect of HA, p = 0.1969; F (1, 63) = 2.920 for effect of PP2, p = 0.0924; and F (1, 63) = 7.765 for interaction, p = 0.0070. Values significantly different from control rats are indicated by asterisk and from hyperammonemic rats are indicated by “a”. Bonferroni post-test: **p < 0.01, ap < 0.05, aap < 0.01, aaap < 0.001
Fig. 8
Fig. 8
Enhanced activity of PKCδ mediates the increase in GluN2B phosphorylation at Ser1303, the reduced association to membrane of CaMKII, and the reduced phosphorylation at Ser831 and membrane expression of GluA1 in hyperammonemic rats. Rottlerin, an inhibitor for PKCδ, was added to hippocampal slices. Phosphorylation of GluN2B subunit at Ser1303 (a) and GluA1 at Ser831 (c) and membrane expression of CaMKII (b) and GluA1 (d) were analyzed as described in the “Methods” section. Values are expressed as percentage of basal levels in control rats and are the mean ± SEM of 15, 10, 29, and 21 rats per group in a, b, c, and d respectively. Data were analyzed by two-way ANOVA. In a, F (1, 55) = 0.5387 for effect of HA, p = 0.4661; F (1, 55) = 5.649 for effect of rottlerin, p = 0.0210; and F (1, 55) = 8.403 for interaction, p = 0.0054. In b, F (1, 36) = 1.445 for effect of HA, p = 0.2372; F (1, 36) = 9.889 for effect of rottlerin, p = 0.0033; and F (1, 36) = 13.77 for interaction, p = 0.0007. In c, F (1, 113) = 1.353 for effect of HA, p = 0.2471; F (1, 113) = 11.81 for effect of rottlerin, p = 0.0008; and F (1, 113) = 16.36 for interaction, p < 0.0001. In d, F (1, 80) = 2.696 for effect of HA, p = 0.1045; F (1, 80) = 6.059 for effect of rottlerin, p = 0.0160; and F (1, 80) = 9.431 for interaction, p = 0.0029. Values significantly different from control rats are indicated by asterisk and from hyperammonemic rats are indicated by “a”. Bonferroni post-test: *p < 0.05, **p < 0.01, ***p < 0.01 aap < 0.01, aaap < 0.001

Similar articles

Cited by

References

    1. Weissenborn K, Heidenreich S, Ennen J, Rückert N, Hecker H. Attention deficits in minimal hepatic encephalopathy. Metab Brain Dis. 2001;16:13–19. doi: 10.1023/A:1011654210096. - DOI - PubMed
    1. Felipo V, Ordoño JF, Urios A, El Mlili N, Giménez-Garzó C, Aguado C, González-López O, Giner-Duran R, Serra MA, Abdallah W, Rodrigo JM, Salazar J, Montoliu C. Patients with minimal hepatic encephalopathy show impaired mismatch negativity correlating with reduced performance in attention tests. Hepatology. 2012;5:530–539. doi: 10.1002/hep.24704. - DOI - PubMed
    1. Liao LM, Zhou LX, Le HB, Yin JJ, Ma SH. Spatial working memory dysfunction in minimal hepatic encephalopathy: an ethology and BOLD-fMRI study. Brain Res. 2012;1445:62–72. doi: 10.1016/j.brainres.2012.01.036. - DOI - PubMed
    1. Felipo V. Hepatic encephalopathy: effects of liver failure on brain function. Nat Rev Neurosci. 2013;14:851–858. doi: 10.1038/nrn3587. - DOI - PubMed
    1. Montoliu C, Piedrafita B, Serra MA, del Olmo JA, Urios A, Rodrigo JM, Felipo V. IL-6 and IL-18 in blood may discriminate cirrhotic patients with and without minimal hepatic encephalopathy. J Clin Gastroenterol. 2009;43:272–279. doi: 10.1097/MCG.0b013e31815e7f58. - DOI - PubMed

MeSH terms

LinkOut - more resources