

Individualized growth assessment: conceptual framework and practical implementation for the evaluation of fetal growth and neonatal growth outcome
- PMID: 29422206
- PMCID: PMC5882201
- DOI: 10.1016/j.ajog.2017.12.210
Individualized growth assessment: conceptual framework and practical implementation for the evaluation of fetal growth and neonatal growth outcome
Abstract
Fetal growth abnormalities can pose significant consequences on perinatal morbidity and mortality of nonanomalous fetuses. The most widely accepted definition of fetal growth restriction is an estimated fetal weight less than the 10th percentile for gestational age according to population-based criteria. However, these criteria do not account for the growth potential of an individual fetus, nor do they effectively separate constitutionally small fetuses from ones that are malnourished. Furthermore, conventional approaches typically evaluate estimated fetal weight at a single time point, rather than using serial scans, to evaluate growth. This article provides a conceptual framework for the individualized growth assessment of a fetus/neonate based on measuring second-trimester growth velocity of fetal size parameters to estimate growth potential. These estimates specify size models that generate individualized third-trimester size trajectories and predict birth characteristics. Comparisons of measured and predicted values are used to separate normally growing fetuses from those with growth abnormalities. This can be accomplished with individual anatomical parameters or sets of parameters. A practical and freely available software (Individualized Growth Assessment Program) has been developed to allow implementation of this approach for clinical and research purposes.
Keywords: Individualized Growth Assessment Program; Rossavik growth model; customized fetal growth; individualized growth assessment; second trimester; third trimester; ultrasound.
Copyright © 2017 Elsevier Inc. All rights reserved.
Figures


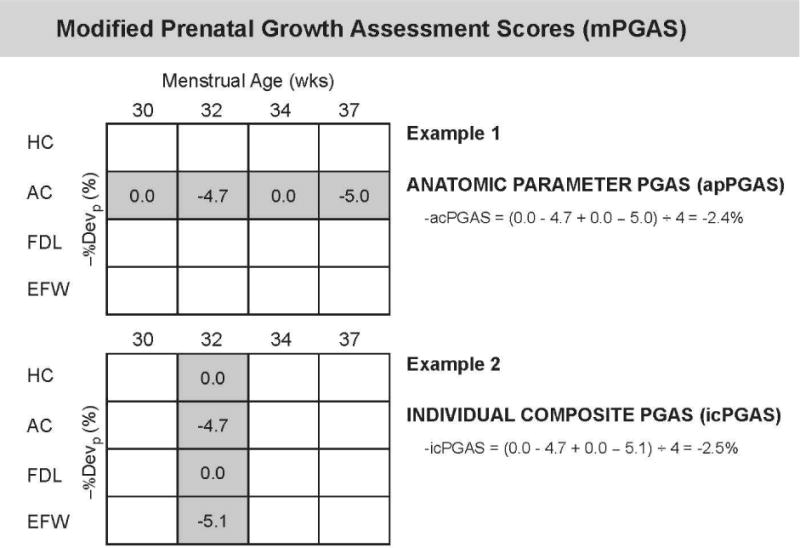

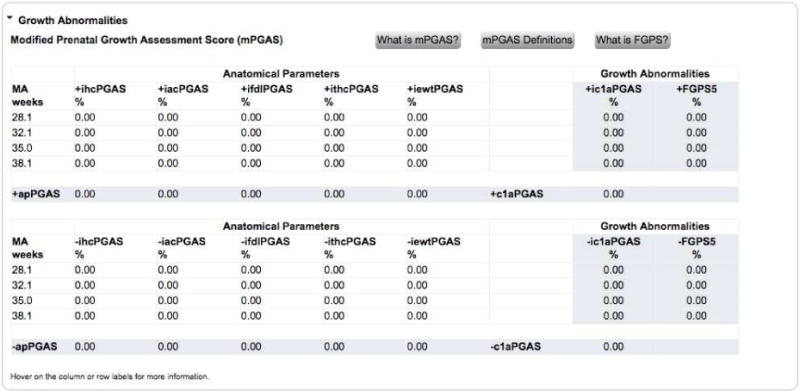
All −%Devp values available at 30 weeks (At1, all
A natomical parameters att ime point1 included) (gray shaded area) were averaged to give the Fetal Growth Pathology Score 1, which was 0% (interpreted as normal growth ).This process was repeated at 32 weeks (At2), which included all measurements available (gray shaded area, at both 30 and 32 weeks). The values were averaged to give the Fetal Growth Pathology Score 1 value of −1.23%.
This signifies that growth restriction has occurred .This process was repeated at 34 weeks (At3), which included all measurements available (gray shaded area, at 30, 32, and 34 weeks). The values were averaged to give the Fetal Growth Pathology Score 1 value of −0.85%.
This signifies that growth has improved .This process was repeated at 37 weeks (At4), which included all measurements available (gray shaded area, at 30, 32, 34, and 37 weeks). The values were averaged to give the Fetal Growth Pathology Score 1 value of −1.53%.
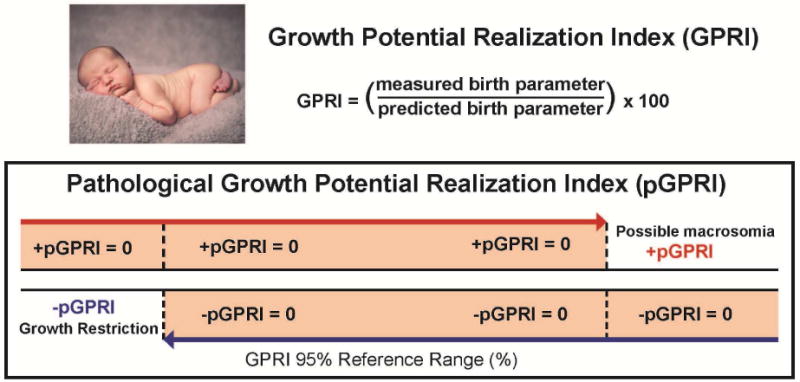
This signifies that growth restriction has worsened .All negative pathological percent deviations represent growth pathology (blue font).

All −%Devp values available at 30 weeks (At1, all
A natomical parameters att ime point1 included) (gray shaded area) were averaged to give the Fetal Growth Pathology Score 1, which was 0% (interpreted as normal growth ).This process was repeated at 32 weeks (At2), which included all measurements available (gray shaded area, at both 30 and 32 weeks). The values were averaged to give the Fetal Growth Pathology Score 1 value of −1.23%.
This signifies that growth restriction has occurred .This process was repeated at 34 weeks (At3), which included all measurements available (gray shaded area, at 30, 32, and 34 weeks). The values were averaged to give the Fetal Growth Pathology Score 1 value of −0.85%.
This signifies that growth has improved .This process was repeated at 37 weeks (At4), which included all measurements available (gray shaded area, at 30, 32, 34, and 37 weeks). The values were averaged to give the Fetal Growth Pathology Score 1 value of −1.53%.
This signifies that growth restriction has worsened .All negative pathological percent deviations represent growth pathology (blue font).

Pattern 1: There is a constant decline in the Fetal Growth Pathology Score 1 with advancing menstrual age. This pattern was observed in 37% (27/73) of small for gestational age fetuses.Pattern 2: This fetus had several Fetal Growth Pathology Score 1 values of zero, indicating that the fetus was following its own expected growth trajectory. However, fetal growth restriction developed at the last examination (36 weeks). This pattern was observed in 27% (20/73) of small for gestational age fetuses.Pattern 3: There was an initially very low Fetal Growth Pathology Score 1 that leveled off and remained approximately constant in subsequent third trimester examinations. This pattern was observed in 12% (9/73) of small for gestational age fetuses.Pattern 4: After an initial low Fetal Growth Pathology Score 1, there was evidence of recovery followed by subsequent worsening of the growth restriction process. This pattern was observed in 11% (8/73) of small for gestational age fetuses.Pattern 5: The initial low Fetal Growth Pathology Score 1 was followed by a continuous regression towards normal during the latter part of the third trimester. This pattern was observed in 8% (6/73) of small for gestational age fetuses.


References
-
- Steckel RH. Birth weights and stillbirths in historical perspective. Eur J Clin Nutr. 1998;52(Suppl 1):S16–20. - PubMed
-
- Altman DG, Hytten FE. Intrauterine growth retardation: let’s be clear about it. Br J Obstet Gynaecol. 1989;96:1127–32. - PubMed
-
- Battaglia FC, Lubchenco LO. A practical classification of newborn infants by weight and gestational age. J Pediatr. 1967;71:159–63. - PubMed
-
- ACOG Practice bulletin no. 134: fetal growth restriction. Obstet Gynecol. 2013;121:1122–33. - PubMed
-
- Gynecologists RCoOa. Small-for-Gestational-Age Fetus, Investigation and Management (Green-top Guideline No. 31) Royal College of Obstetricians and Gynecologists; London, UK: 2014.
Publication types
MeSH terms
Grants and funding
LinkOut - more resources
Full Text Sources
Other Literature Sources
Medical
