Clinical Trial
. 2018 May-Jun;11(3):607-617.
doi: 10.1016/j.brs.2018.01.028. Epub 2018 Jan 31.

Pallidal deep brain stimulation modulates excessive cortical high β phase amplitude coupling in Parkinson disease

Affiliations
Clinical Trial

Pallidal deep brain stimulation modulates excessive cortical high β phase amplitude coupling in Parkinson disease

Mahsa Malekmohammadi et al. Brain Stimul. 2018 May-Jun.

Abstract

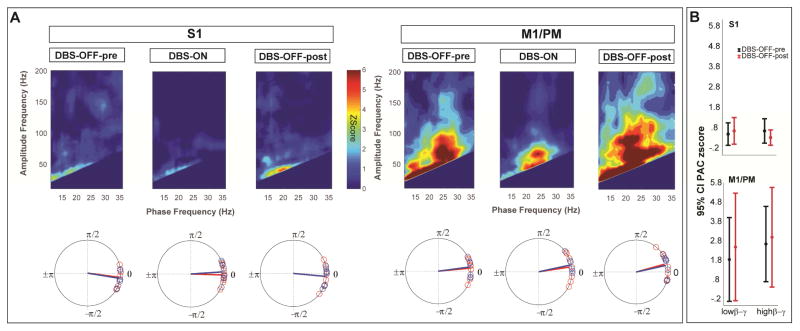
Objective: Deep brain stimulation (DBS) of the subthalamic nucleus (STN) and globus pallidus internus (GPi) are equally efficacious in the management of Parkinson disease (PD). Studies of STN-DBS have revealed a therapeutic reduction in excessive cortical β-γ phase-amplitude coupling (PAC). It is unclear whether this is specific to STN-DBS and potentially mediated by modulation of the hyperdirect pathway or if it is a generalizable mechanism seen with DBS of other targets. Moreover, it remains unclear how cortical signals are differentially modulated by movement versus therapy. To clarify, the effects of GPi-DBS and movement on cortical β power and β-γ PAC were examined.

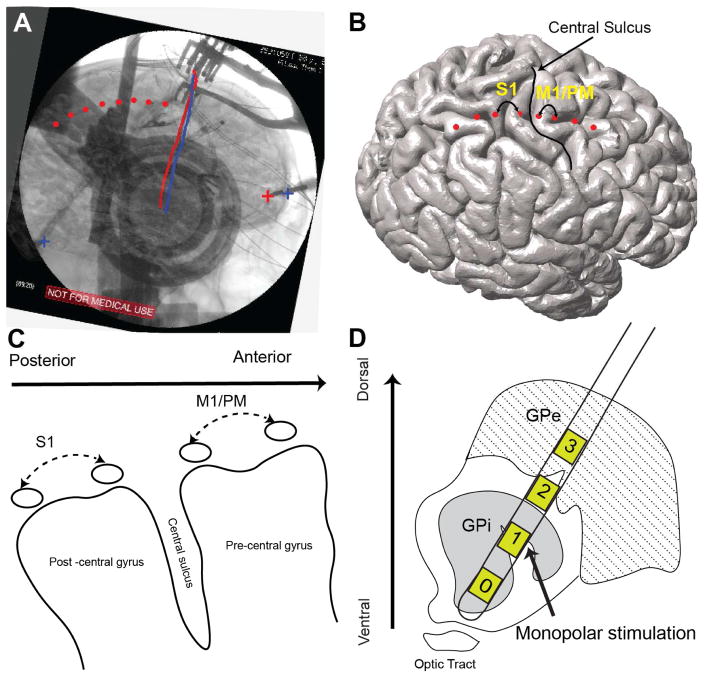
Methods: Right sensorimotor electrocorticographic signals were recorded in 10 PD patients undergoing GPi-DBS implantation surgery. We evaluated cortical β power and β-γ PAC during blocks of rest and contralateral hand movement (finger tapping) with GPi-DBS off and on.

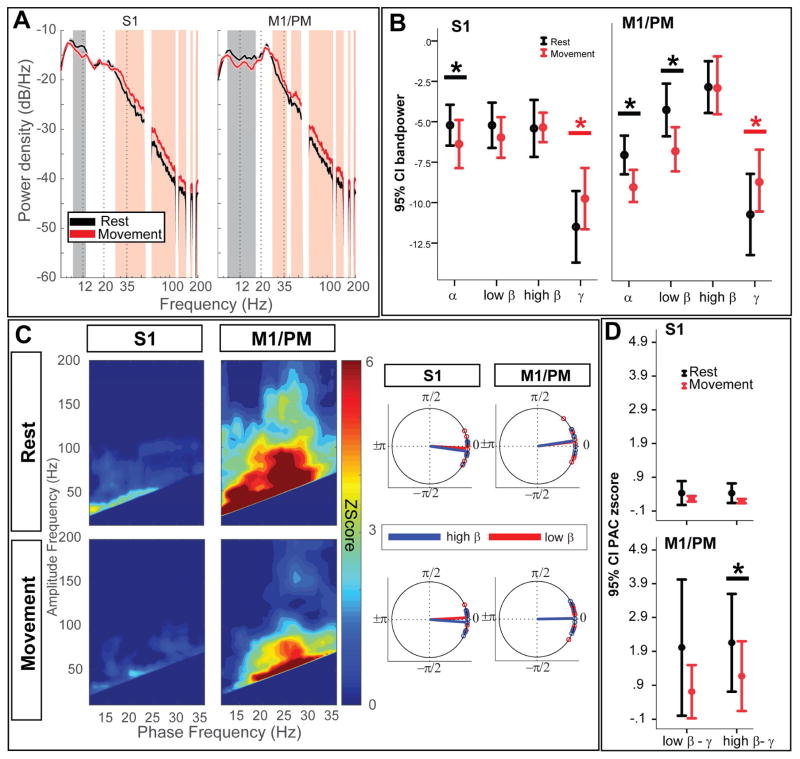
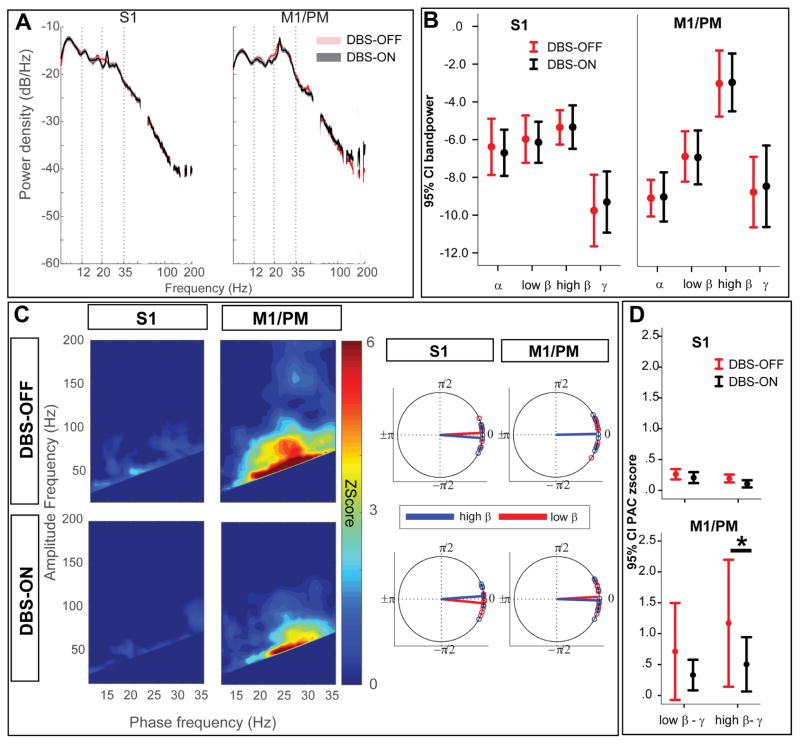
Results: Movement suppressed cortical low β power (P = 0.008) and high β-γ PAC (P = 0.028). Linear mixed effect modeling (LMEM) showed that power in low and high β bands are differentially modulated by movement (P = 0.022). GPi-DBS also results in a significant suppression of high β-γ PAC but without power modulation in either β sub-band (P = 0.008). Cortical high β-γ PAC is significantly correlated with severity of bradykinesia (Rho = 0.59, P = 0.045) and changes proportionally with therapeutic improvement (Rho = 0.61, P = 0.04).

Conclusions: Similar to STN-DBS, GPi-DBS reduces motor cortical β-γ PAC, like that also reported with dopaminergic mediations, suggesting it is a generalizable symptom biomarker in PD, independent of therapeutic target or proximity to the hyperdirect pathway.

Keywords: Deep brain stimulation; Globus pallidus internus; Motor cortex; Parkinson disease; Phase amplitude coupling.


Figures

Figure 1
Figure 1
Localization of cortical ECoG strip and cortical signals used for analysis (A) registration of pre-operative structural high resolution T1 weighted MRI and CT to co-localize cortical brain surface and skull. Tips of stereotactic frame and DBS leads (marked by + signs and straight red and blue lines on the image, respectively) are used as landmark to complete 2D–3D fusion of fluoroscopic image and cortical surface. One the fusion is complete cortical contacts (visible on the fluoroscopic image) are marked manually on the fused images. (B) Marked ECoG contacts are illustrated on the cortical surface and relative to central sulcus. (C) Two cortical bipolar signals spanning post to pre central gyri (S1 and M1/PM) are marked and used for all of the analyses. (D) DBS lead (Medtronic model 3387) penetrating through pallidum. Monopolar channel 1 or 2 was used to deliver high frequency stimulation. (For more detailed description of the registration method please refer to the online supplementary material)
Figure 2
Figure 2
Comparison of spectral power and PAC between S1 and M1/PM (A) Group average PSDs are plotted for S1 (green trace) and M1/PM (red trace). Vertical shade represents statistically significant difference observed by two-group test of spectrum. Frequency axis is plotted in log format to magnify changes in β band. (B) Average band power values are also compared between S1 (green) and M1/PM (red). Asterisk (*) sign indicates statistically significant difference (P<0.05, tested by non-parametric Wilcoxon signed-rank test, corrected for multiple comparisons using Bonferroni). Each bar shows the mean (across the cohort) and 95% confidence interval of the mean. (C) On the left hand side, average z-score maps for the cohort are represented, white dotted rectangles show the pairs of phase and amplitude frequencies used to derive average low β-broad band γ (left box) and high β-broad band γ (right box) for each subject. On the right hand side, average preferred phase of coupling for low β-broad band γ (red) and high β-broad band γ (blue). (D) Comparing average PAC between S1 and M1/PM signals indicates statistically significant difference in high β-broadband γ PAC. Asterisk (*) indicates statistical significance at P<0.05 (Wilcoxon signed rank test, Bonferroni correction). Each bar shows the mean (across the cohort) and 95% confidence interval of the mean.
Figure 3
Figure 3
Movement changes cortical power in low β and cortical PAC in high β frequencies (A) Group average PSDs are plotted for S1 (left) and M1/PM (right), in the DBS-OFF condition, during rest (black trace) and contralateral hand movement (red trace). Vertical shade represents statistically significant difference observed by two-group test of spectrum. Frequency axis is plotted in log format to magnify changes in β band. (B) Average band power values are also compared between rest (black) and contralateral hand movement (red). Asterisk (*) sign indicates statistically significant difference (P<0.05, tested by non-parametric Wilcoxon signed-rank test, corrected for multiple comparisons using Bonferroni). Each bar shows the mean (across the cohort) and 95% confidence interval of the mean. (C) On the left hand side, average z-score maps for the cohort are represented, during DBS-OFF recordings for rest (top row) and contralateral hand movement (bottom row). On the right hand side, average preferred phase of coupling for low β-broadband γ (red) and high β-broad band γ (blue) are represented. (D) Comparing average PAC between rest and movement indicates statistically significant suppression of high β-broadband γ PAC at M1/PM. Asterisk (*) indicates statistical significance at P<0.05 (Wilcoxon signed rank test, Bonferroni correction). Each bar shows the mean (across the cohort) and 95% confidence interval of the mean.
Figure 4
Figure 4
During rest, GPi-DBS only modulates motor cortical PAC in high β frequencies without causing a significant power change (A) Group average PSDs are plotted for S1 (left) and M1/PM (right), in the DBS-OFF condition, during rest at DBS-OFF (black trace) and DBS-ON (blue trace). Gray shade represents statistically significant difference observed by two-group test of spectrum. No significant difference was found after correction for multiple comparisons. (B) Average band power values during resting conditon (DBS-OFF (black), DBS-ON (blue)) are also compared. Asterisk (*) sign indicates statistically significant difference (P<0.05, tested by non-parametric Wilcoxon signed-rank test, corrected for multiple comparisons using Bonferroni). Each bar shows the mean (across the cohort) and 95% confidence interval of the mean. (C) On the left hand side, average z-score maps for the cohort are represented, during resting condition for DBS-OFF (top row) and DBS-ON (bottom row). On the right hand side, average preferred phase of coupling for low β-broadband γ (red) and high β-broad band γ (blue) are represented. (D) Comparing average PAC between DBS-OFF and DBS-ON indicates statistically significant suppression of high β-broadband γ PAC at M1/PM. Asterisk (*) indicates statistical significance at P<0.05 (Wilcoxon signed rank test, Bonferroni correction). Each bar shows the mean (across the cohort) and 95% confidence interval of the mean.
Figure 5
Figure 5
During movement, GPi-DBS only modulates motor cortical PAC in high β frequencies without causing a significant power change (A) Group average PSDs are plotted for S1 (left) and M1/PM (right), in the DBS-OFF condition, during movement at DBS-OFF (red trace) and DBS-ON (green trace). Gray shade represents statistical significant difference observed by two-group test of spectrum. No significant difference was found after correction for multiple comparisons. (B) Average band power values during contralateral hand movement (DBS-OFF (red), DBS-ON (green)) are also compared. Asterisk (*) indicates statistically significant difference (P<0.05, tested by non-parametric Wilcoxon signed-rank test, corrected for multiple comparisons using Bonferroni). Each bar shows the mean (across the cohort) and 95% confidence interval of the mean. (C) On the left hand side, average z-score maps for the cohort are represented, during contralateral hand movement for DBS-OFF (top row) and DBS-ON (bottom row). On the right hand side, average preferred phase of coupling for low β-broadband γ (red) and high β-broad band γ (blue) are represented. (D) Comparing average PAC between DBS-OFF and DBS-ON indicates statistically significant suppression of high β-broadband γ PAC at M1/PM. Asterisk (*) indicates statistical significance at P<0.05 (Wilcoxon signed rank test, Bonferroni correction). Each bar shows the mean (across the cohort) and 95% confidence interval of the mean.
Figure 6
Figure 6
Resting state cortical PAC is restored after termination of high frequency GPi-DBS (A) Average zscore maps for subgroup (N=8) of subjects with resting state recordings during DBS-OFF before high frequency stimulation (DBS-OFF-pre), high frequency stimulation (DBS-ON) and DBS-OFF after the high frequency stimulation (DBS-OFF-post), indicating the reversal of untreated state PAC in the sensorimotor cortex. Bottom row shows the average preferred phase of coupling for low β-broadband γ (red) and high β-broad band γ (blue). (B) Comparing average PAC between DBS-OFF-pre and DBS-OFF-post conditions indicated no statistically significant difference in the coupling strength between the conditions (P>0.1, Wilcoxon signed-rank test).
Figure 7
Figure 7
Motor cortical high β-broadband γ PAC is related to disease severity (ie bradykinesia) and changes in proportion to improvement in disease symptoms once GPi-DBS is applied. (A) Scatter plots showing significant correlation between high β-broadband γ PAC at rest and in the DBS-OFF (i.e. untreated state) and bradykinesia scores. (B) Scatter plots showing significant correlation between changes in high β-broadband γ PAC at rest with GPi-DBS (i.e. treatment related changes) and improvement in bradykinesia scores.

Similar articles

Cited by

References

    1. Levy R, Ashby P, Hutchison WD, Lang AE, Lozano AM, Dostrovsky JO. Dependence of subthalamic nucleus oscillations on movement and dopamine in Parkinson’s disease. Brain. 2002;125:1196–209. - PubMed
    1. Stoffers D, Bosboom JLW, Wolters ECEc, Stam CJ, Berendse HW. Dopaminergic modulation of cortico-cortical functional connectivity in Parkinson’s disease: an MEG study. Exp Neurol. 2008;213:191–5. doi: 10.1016/j.expneurol.2008.05.021. - DOI - PubMed
    1. Chen CC, Hsu YT, Chan HL, Chiou SM, Tu PH, Lee ST, et al. Complexity of subthalamic 13–35 Hz oscillatory activity directly correlates with clinical impairment in patients with Parkinson’s disease. Exp Neurol. 2010;224:234–40. doi: 10.1016/j.expneurol.2010.03.015. - DOI - PubMed
    1. Eusebio a, Thevathasan W, Doyle Gaynor L, Pogosyan a, Bye E, Foltynie T, et al. Deep brain stimulation can suppress pathological synchronisation in parkinsonian patients. J Neurol Neurosurg Psychiatry. 2011:82. doi: 10.1136/jnnp.2010.217489. - DOI - PMC - PubMed
    1. Crowell AL, Ryapolova-Webb ES, Ostrem JL, Galifianakis NB, Shimamoto S, Lim DA, et al. Oscillations in sensorimotor cortex in movement disorders: an electrocorticography study. Brain. 2012;135:615–30. doi: 10.1093/brain/awr332. - DOI - PMC - PubMed

Publication types