. 2018 Feb 8;9(1):582.
doi: 10.1038/s41467-018-02834-8.

The tumour microenvironment creates a niche for the self-renewal of tumour-promoting macrophages in colon adenoma

Affiliations

The tumour microenvironment creates a niche for the self-renewal of tumour-promoting macrophages in colon adenoma

Irene Soncin et al. Nat Commun. .

Abstract

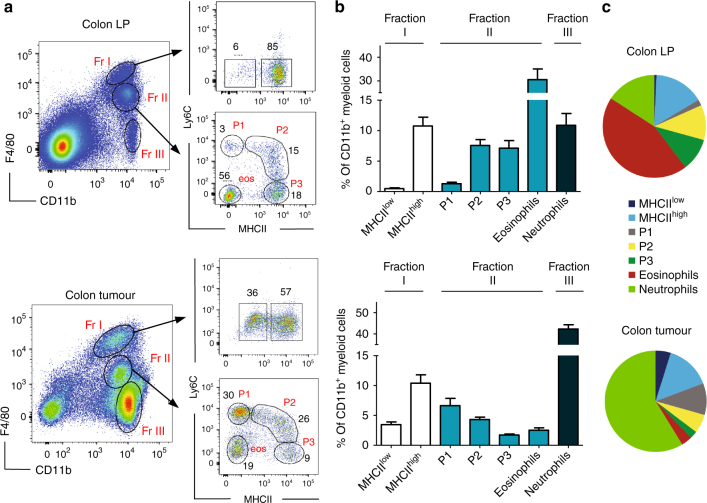
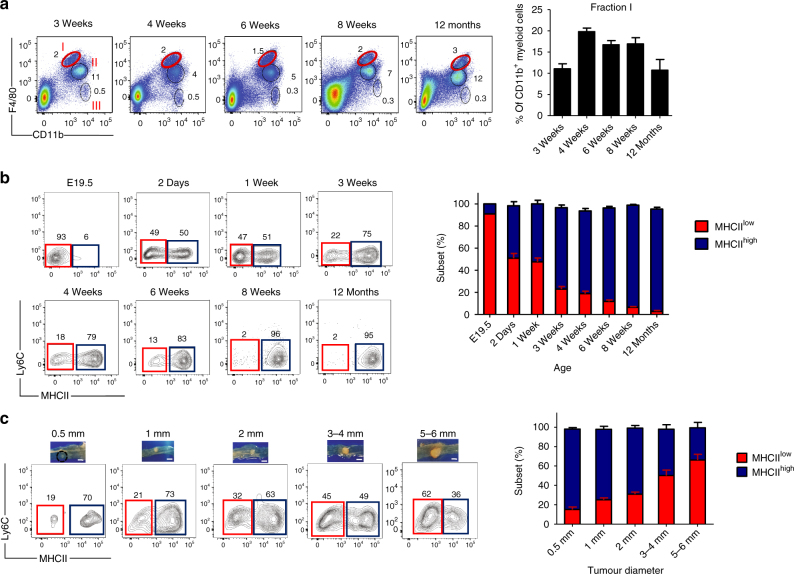
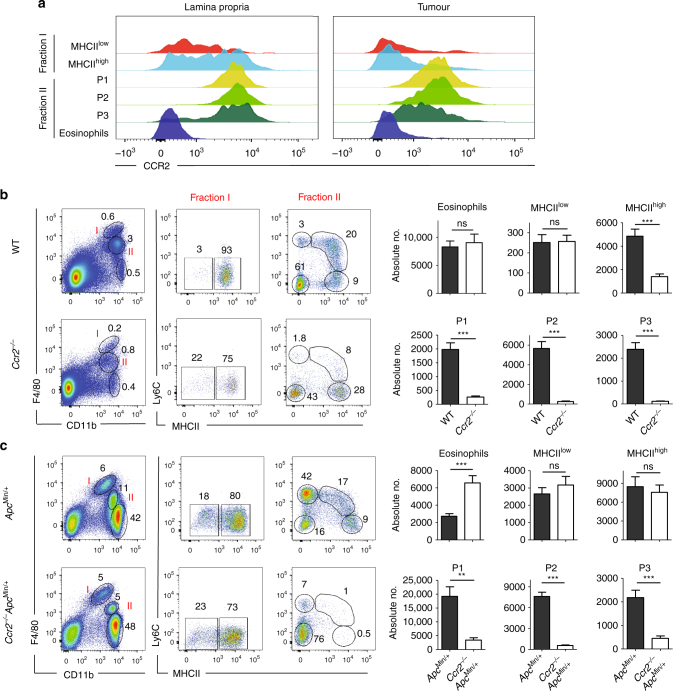
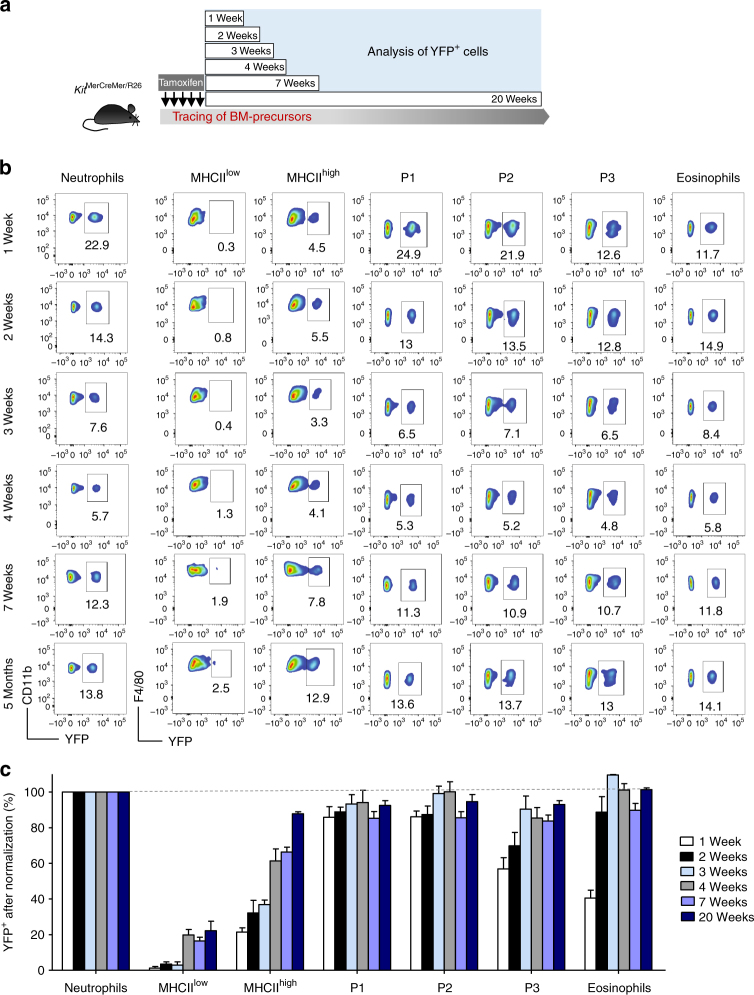
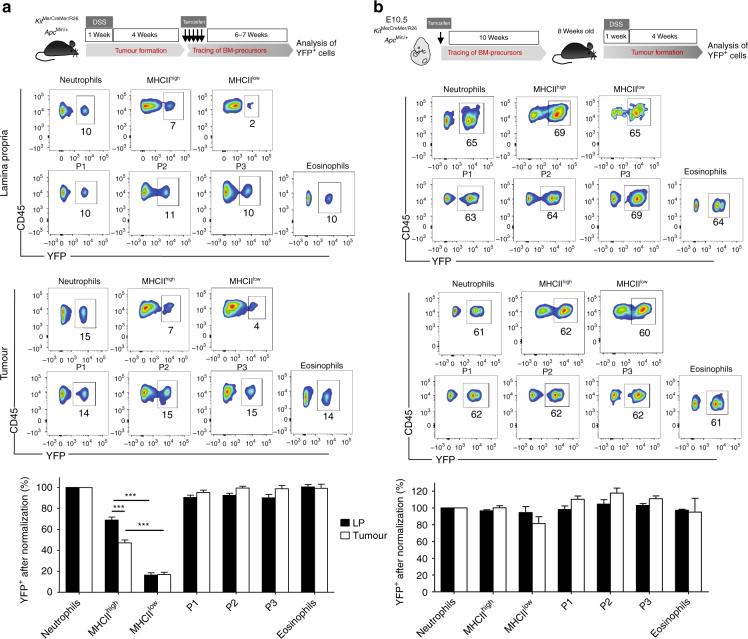
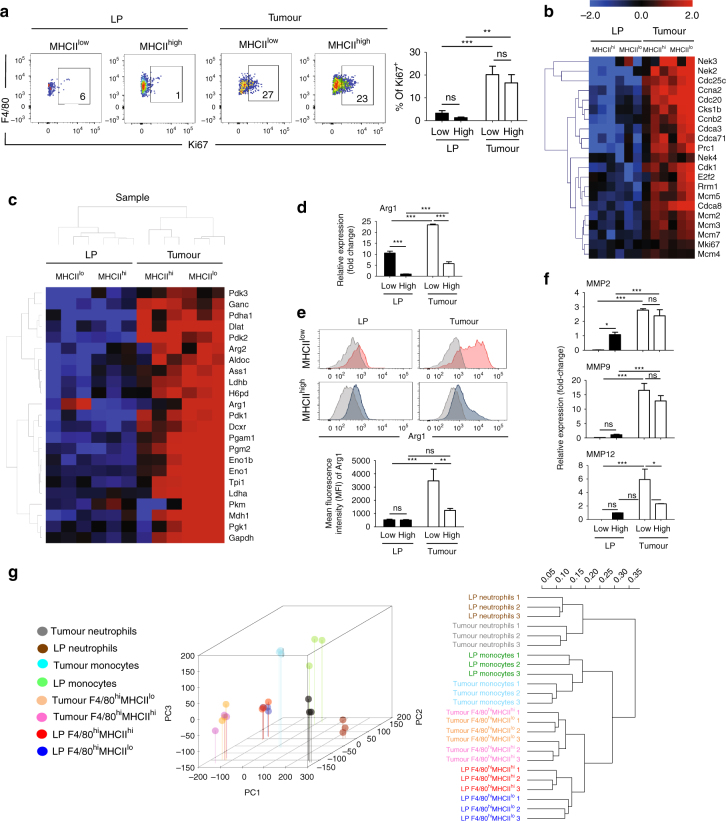
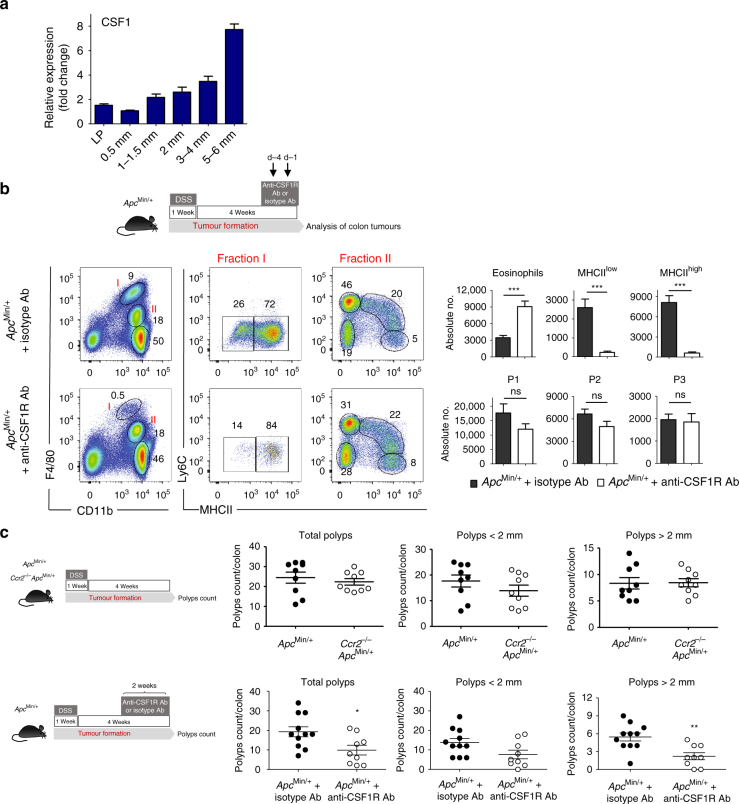
Circulating CCR2+ monocytes are crucial for maintaining the adult tissue-resident F4/80hiMHCIIhi macrophage pool in the intestinal lamina propria. Here we show that a subpopulation of CCR2-independent F4/80hiMHCIIlow macrophages, which are the most abundant F4/80hi cells in neonates, gradually decline in number in adulthood; these macrophages likely represent the fetal contribution to F4/80hi cells. In colon adenomas of ApcMin/+ mice, F4/80hiMHCIIlow macrophages are not only preserved, but become the dominant subpopulation among tumour-resident macrophages during tumour progression. Furthermore, these pro-tumoural F4/80hiMHCIIlow and F4/80hiMHCIIhi macrophages can self-renew in the tumour and maintain their numbers mostly independent from bone marrow contribution. Analyses of colon adenomas indicate that CSF1 may be a key facilitator of macrophage self-renewal. In summary, the tumour microenvironment creates an isolated niche for tissue-resident macrophages that favours macrophage survival and self-renewal.


Conflict of interest statement

The authors declare no competing financial interests.

Figures

Fig. 1
Fig. 1
Myeloid cell heterogeneity in colon lamina propria and colon tumours. WT C57BL/6J and ApcMin/+ mice aged 6 weeks old were administered drinking water supplemented with dextran sodium sulphate for 7 days, and analysed 4 weeks later. a Flow cytometry representative dot plots of colon lamina propria (LP) (upper panel) and tumour cell subpopulations (lower panel). Three different myeloid fractions (I–III) are defined by the differential expression of F4/80. Fraction I represents F4/80hi tissue-resident macrophages, which can be further subdivided into MHCIIhi and MHCIIlow. Fraction II contains monocytes (P1), two monocyte-derived macrophage subpopulations (P2 and P3) and eosinophils (eos), based on differential expression of MHCII and Ly6C. Fr III consists of neutrophils. Gating strategy is shown in Supplementary Fig. 4. b Bar charts of the distinct myeloid cell subpopulations obtained from the colon LP (n = 8) (upper bar chart) and 2–3 mm colon tumours (n = 20) (lower bar chart). White bars: fraction I; light blue bars: fraction II and black bars: fraction III. Error bars represent the s.e.m. c Pie charts show the proportions of F4/80hi tissue-resident macrophages (MHCIIhi and MHCIIlow), monocytes (P1), monocyte-derived macrophages (P2–P3), neutrophils and eosinophils across colon LP and tumours
Fig. 2
Fig. 2
Ageing and tumour progression influence the ratio between F4/80hiMHCIIhi and F4/80hiMHCIIlow subpopulations. a F4/80hi tissue-resident macrophages persist in the colon LP after birth into adulthood, as shown by the representative flow cytometry dot plots and bar chart. Error bars represent the s.e.m. b The frequency of colon F4/80hiMHCIIlow cells rapidly declines after birth. Representative dot plots of F4/80hiMHCIIhi and F4/80hiMHCIIlow subpopulations obtained from fetal colon (E19.5) and from colons of mice aged 2 days, 1, 3, 4, 6 and 8 weeks and 12 months. The bar chart represents the age-dependent ratio between F4/80hiMHCIIhi (blue) and F4/80hiMHCIIlow (red) subpopulations in the colon LP. E19.5: n = 1 (pool of 15 embryos obtained from 3 different pregnant mice); day 2: n = 2 (each group pool of 5 mice); 1 week: n = 2 (each group pool of 5 mice); 3 weeks: n = 6 mice; 4 weeks: n = 5 mice; 6 weeks: n = 4; 8 weeks: n = 7 and 12 months: n = 4 mice. Error bars represent the s.e.m. c Representative flow cytometry analysis (left panel) and mean percentage of F4/80hiMHCIIhi and F4/80hiMHCIIlow subpopulations (right panel) in tumours of different sizes (0.5–6.0 mm in diameter) obtained from ApcMin/+ mice. 0.5 mm: n = 3; 1 mm: n = 3; 2 mm: n = 4; 3–4 mm: n = 3; 5–6 mm: n = 4. Error bars represent the s.e.m. Scale bars: 2.5 mm. Gating strategy is shown in Supplementary Fig. 4
Fig. 3
Fig. 3
Lamina propria and intratumoural colon F4/80hiCD11b+ macrophage subsets show differential CCR2-driven monocyte dependence. a Fluorescence-activated cell sorting histograms showing CCR2 expression profiles on distinct colon LP and intratumoural myeloid cell subpopulations: fraction I consists of MHCIIlow and MHCIIhi cells, and fraction II consists of monocytes (P1) and monocyte-derived macrophages (P2 and P3). b Myeloid cell profiling in WT and Ccr2/ colon LP. Representative flow cytometry analysis with F4/80 and CD11b-expressing myeloid subpopulations, obtained from the colon LP of WT and Ccr2/ mice. Fractions I and II were further dissected for MHCII and Ly6C expression (left panel). The absolute numbers of eosinophils, F4/80hiMHCIIhi and F4/80hiMHCIIlow tissue-resident macrophages and P1–P3 subpopulations are shown (right panel). The bar chart represents the mean number of mice in each group and the error bars represent the s.e.m. (WT; n = 7 and Ccr2/; n = 14). c Myeloid cell profiling in WT and Ccr2/ colon tumours as described above for LP cells. Bar charts show the mean±s.e.m. of absolute numbers of eosinophils, F4/80hiMHCIIhi and F4/80hiMHCIIlow tissue-resident macrophages and P1–P3 subpopulations obtained from ApcMin/+ (n = 8) and ApcMin/+Ccr2−/− (n = 9) mice. Statistical significance was determined using an unpaired Student's t-test. **P<0.001; ***P < 0.0001; ns, not significant. Gating strategy is shown in Supplementary Fig. 4
Fig. 4
Fig. 4
Intestinal tissue-resident macrophages exhibit a slower, gradual replacement by bone marrow-derived cells compared to other gut myeloid cells. a Schematic representation of the adult fate mapping protocol using KitMerCreMer/R26 mice. Mice aged 6 weeks were injected with tamoxifen five times and groups of 4–8 animals were sacrificed 1, 2, 3, 4, 7 and 20 weeks later. b Representative flow cytometry analysis indicating the labelling efficiency of distinct colon myeloid cell populations as defined in Fig. 1: MHCIIlow-expressing and MHCIIhi-expressing tissue-resident macrophages, monocytes and monocytes-derived macrophages (P1–P3), eosinophils and neutrophils. Neutrophils acted as internal controls for labelling efficiency and the tracings are from the same mouse. Gating strategy is shown in Supplementary Fig. 4. c The bar chart represents the mean percentage of yellow florescence protein-positive (YFP+) cells after normalization to the percentage of YFP+ neutrophils. The error bars represent the s.e.m.
Fig. 5
Fig. 5
Identification of self-renewing colon macrophage subsets in healthy and tumour tissue. a Dextran sodium sulphate (DSS)-induced intestinal adenoma formation was combined with adult fate mapping using the KitMerCreMer/R26 and KitMerCreMer/R26ApcMin/+ mice (schematic representation shown in upper panel). Representative flow cytometry analysis illustrates the colon myeloid cell subset labelling efficiency. Gating strategy is shown in Supplementary Fig. 4. The bar chart represents the mean percentage of yellow fluorescence protein-positive (YFP+) cells after normalization to the percentage of YFP+ neutrophils±s.e.m. A total of 15 KitMerCreMer/R26ApcMin/+ and 20 KitMerCreMer/R26 6–8-week-old mice were subjected to DSS treatment. Statistical significance was determined by two-way ANOVA followed by Bonferroni test; ***P < 0.001. For reasons of clarity, the non-significant differences between groups were not indicated. b Embryonic fate mapping confirms the prenatal origins of intestinal LP and tumoural tissue-resident F4/80hiMHCIIhi and F4/80hiMHCIIlow macrophages. Pregnant KitMerCreMer/R26 and KitMerCreMer/R26ApcMin/+ mice (E10.5) were administered tamoxifen by intraperitoneal injection, as schematically illustrated in the upper panel. The offspring were then subjected to DSS treatment at 8 weeks old and sacrificed 4 weeks later for tissue and cell isolation. Representative flow cytometry analysis shows the labelling efficiency of each myeloid cell subset analyzed. Gating strategy is shown in Supplementary Fig. 4. The bar chart represents the mean percentage of YFP+ cells after normalization to the percentage of YFP+ neutrophils. The error bars represent the s.e.m. A total of 4 KitMerCreMer/R26ApcMin/+ and 6 KitMerCreMer/R26 mice were analysed. E, embryonic day; P1, monocytes; P2 and P3, monocyte-derived macrophages. Statistical significance was determined by two-way ANOVA followed by Bonferroni test. For reasons of clarity, the non-significant differences between groups were not indicated
Fig. 6
Fig. 6
Tissue-resident macrophages in polyps expand by self-renewal and undergo metabolic reprogramming. a Proliferative activity of the LP and tumoural tissue-resident macrophage subpopulations. Intracellular expression levels of Ki-67 in adult F4/80hiMHCIIhi and F4/80hiMHCIIlow cells, obtained from the colon LP of wild-type mice and colon tumours from dextran sodium sulphate-treated ApcMin/+ mice. Representative dot plot and bar chart representing data obtain for colon LP (n = 5 mice) and tumours (n = 10 mice). Error bars represent the s.e.m. Statistical significance was determined by two-way ANOVA followed by Bonferroni test; **P < 0.01; ***P < 0.001; ns, not significant. b, c Myeloid subpopulations were sorted from pooled colon LP and tumours of 13-15 mice in three independent experiments in an RNA-seq study: Ly6ChiMHCII monocytes, Ly6GhiF4/80CD11b+ neutrophils, F4/80hiMHCIIhi and F4/80hiMHCIIlow tissue-resident macrophage subpopulations. Gating strategy is shown in Supplementary Fig. 4. b Heat map and clustering of cell cycle-associated transcripts enriched in intratumoural F4/80hiMHCIIhi and F4/80hiMHCIIlow subsets. The heat map was generated with log2 transformed RPKM values and with the row/gene median subtracted. c Heat map and clustering of glycolysis- and urea cycle-associated transcripts enriched in intratumoural F4/80hiMHCIIhi and F4/80hiMHCIIlow subsets. The heat map was generated with log2 transformed FPKM values and with the row/gene median subtracted. d Quantitative PCR of Arg-1 expression levels in the LP and intratumoural F4/80hiMHCIIhi and F4/80hiMHCIIlow subpopulations. The qPCR results shown are representative of sorted macrophage subpopulations obtained from pooled LP and tumours of 13-15 mice. Error bars represent the s.e.m. Statistical significance was determined by two-way ANOVA followed by Bonferroni test; ***P<0.001 e Representative flow cytometry histograms (upper panels) and bar charts (lower panel) showing the intracellular mean of fluorescence intensity (MFI) of ARG1 expression in colon LP and intratumoural F4/80hiMHCIIhi and F4/80hiMHCIIlow cells. Error bars represent the s.e.m. Statistical significance was determined by two-way ANOVA followed by Bonferroni test; **P<0.01; ***P < 0.001; ns, not significant. f Differential expression of distinct metalloproteinases (Mmp2, Mmp9 and Mmp12) in LP and intratumoural F4/80hiMHCIIhi and F4/80hiMHCIIlow subsets measured by qPCR. Error bars represent the s.e.m. Statistical significance was determined by two-way ANOVA followed by Bonferroni test; *P<0.05; ***P < 0.001; ns, not significant. g Transcriptome analysis of distinct colon LP and tumoural myeloid cell populations. Hierarchical clustering of the LP and intratumoural monocytes (P1), neutrophils and tissue-resident macrophage (F4/80hiMHCIIhi and MHCIIlow) subsets
Fig. 7
Fig. 7
Pro-tumoural F4/80hi resident macrophages depend on CSF1. a Intra-tumoural CSF1 levels gradually increase with tumour progression. Colon LP and polyps of different sizes (ranging from 0.5 mm to 6 mm in diameter) were processed for quantitative PCR analysis of Csf1 expression. Data were normalized to β-actin and are expressed as fold change in Csf1 expression from 0.5 mm tumours. b Anti-CSF1 receptor (CSF1R) antibody depletes intratumoural F4/80hiMHCIIlow and F4/80hiMHCIIhi macrophages. The 12-week-old dextran sodium sulphate (DSS)-treated ApcMin/+ mice were injected intraperitoneally with rat IGg2a or anti-CSF1R blocking antibody (400 μg/mouse) at days −4 and −1 before collection of the colons, as shown in the schematic representation (upper panel). Polyps were processed and cells were analysed by flow cytometry for the presence of different myeloid cell populations defined in Fig. 1. Gating strategy is shown in Supplementary Fig. 4. The bar charts show the means±s.e.m. of absolute numbers of F4/80hiMHCIIhi and F4/80hiMHCIIlow tissue-resident macrophage subpopulations, monocytes (P1), monocyte-derived macrophages (P2–P3) and eosinophils (control mice: n = 6 and anti-CSF1R Ab injected mice: n = 5). Statistical significance was determined using an unpaired Student’s t-test. ***P < 0.0001; ns, not significant. c CSF1R blockade but not CCR2 deficiency reduces tumour burden in ApcMin/+ mice. Polyp counts in the colon of ApcMin/+ (n = 9) and Ccr2−/−ApcMin/+ mice (n = 9) (upper panel) and anti-rat IgG2a injected ApcMin/+ (n = 11) and anti-CSF1R Ab injected ApcMin/+ mice (n = 9) (lower panel). Statistical significance was determined using an unpaired Student’s t-test. *P < 0.05 and **P < 0.001

Similar articles

Cited by

References

    1. Varol C, Mildner A, Jung S. Macrophages: development and tissue specialization. Annu. Rev. Immunol. 2015;33:643–675. doi: 10.1146/annurev-immunol-032414-112220. - DOI - PubMed
    1. Gross M, Salame TM, Jung S. Guardians of the gut - murine intestinal macrophages and dendritic cells. Front. Immunol. 2015;6:254. doi: 10.3389/fimmu.2015.00254. - DOI - PMC - PubMed
    1. Ginhoux F, Guilliams M. Tissue-resident macrophage ontogeny and homeostasis. Immunity. 2016;44:439–449. doi: 10.1016/j.immuni.2016.02.024. - DOI - PubMed
    1. Perdiguero EG, Geissmann F. The development and maintenance of resident macrophages. Nat. Immunol. 2016;17:2–8. doi: 10.1038/ni.3341. - DOI - PMC - PubMed
    1. Sheng J, Ruedl C, Karjalainen K. Most tissue-resident macrophages except microglia are derived from fetal hematopoietic stem cells. Immunity. 2015;43:382–393. doi: 10.1016/j.immuni.2015.07.016. - DOI - PubMed

Publication types

MeSH terms

Substances