. 2018 Feb 8;8(1):2668.
doi: 10.1038/s41598-018-20763-w.

TGFβ1 reinforces arterial aging in the vascular smooth muscle cell through a long-range regulation of the cytoskeletal stiffness

Affiliations

TGFβ1 reinforces arterial aging in the vascular smooth muscle cell through a long-range regulation of the cytoskeletal stiffness

Wanqu Zhu et al. Sci Rep. .

Abstract

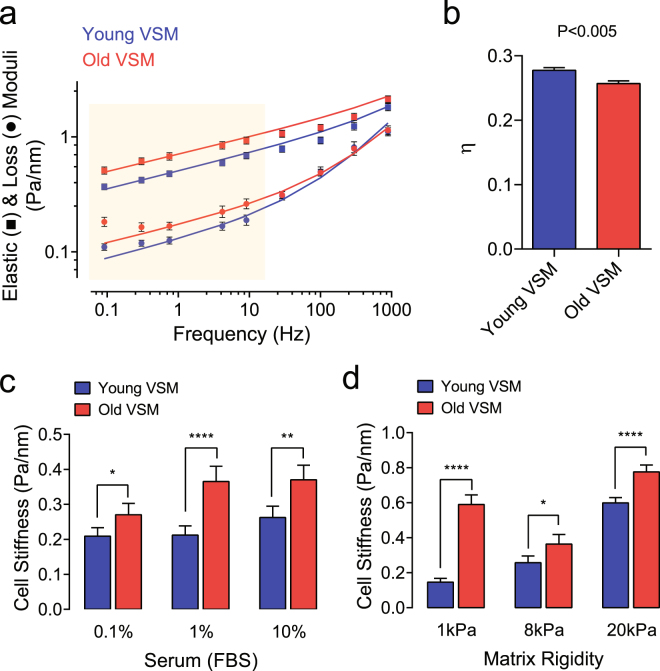
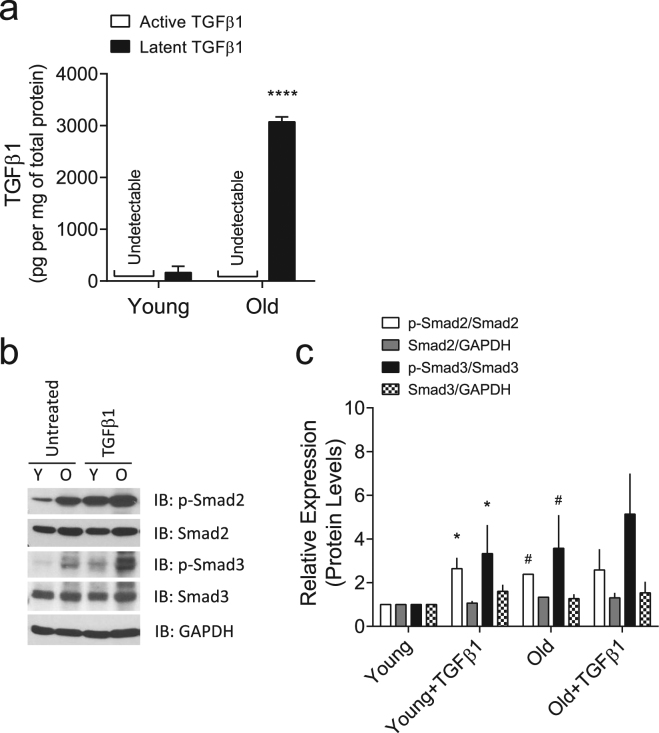
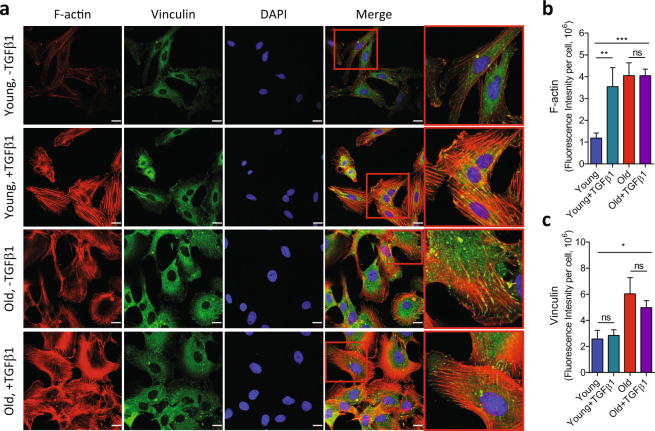
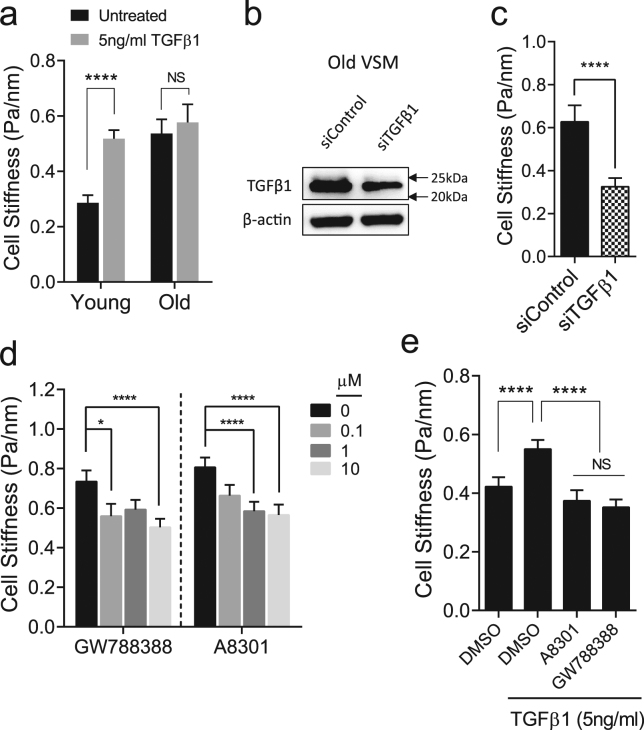
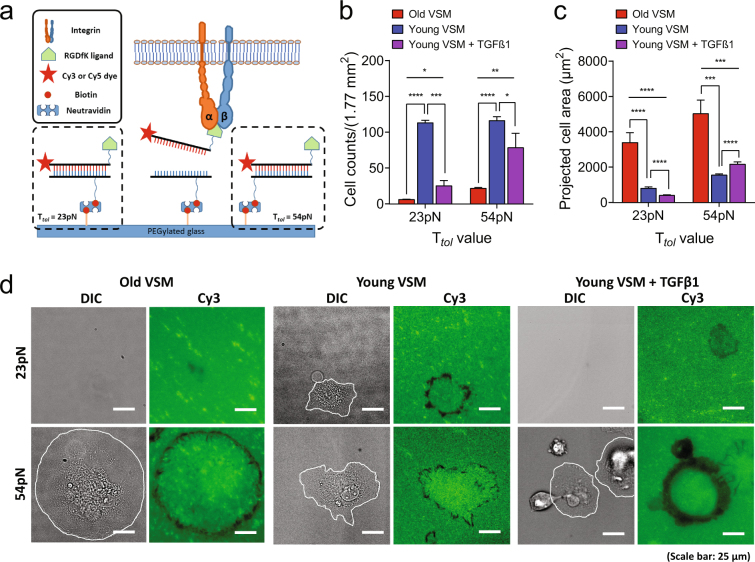
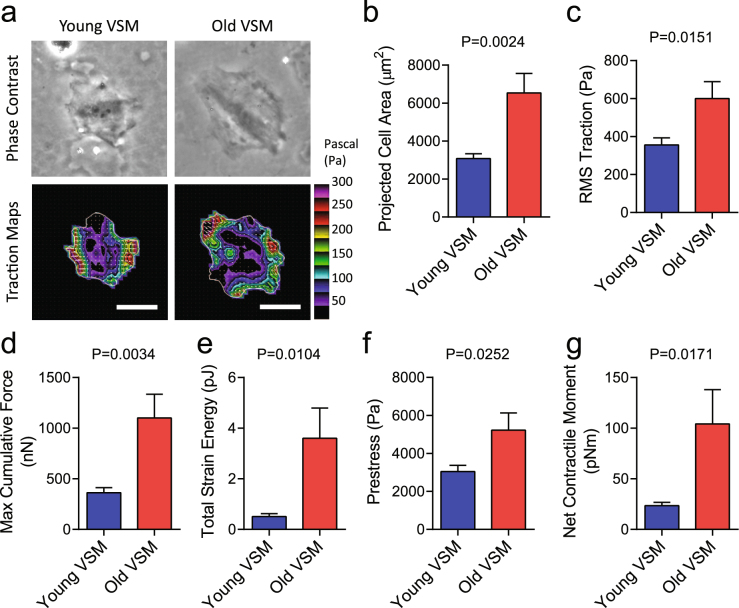
Here we report exquisitely distinct material properties of primary vascular smooth muscle (VSM) cells isolated from the thoracic aorta of adult (8 months) vs. aged (30 months) F344XBN rats. Individual VSM cells derived from the aged animals showed a tense internal network of the actin cytoskeleton (CSK), exhibiting increased stiffness (elastic) and frictional (loss) moduli than those derived from the adult animals over a wide frequency range of the imposed oscillatory deformation. This discrete mechanical response was long-lived in culture and persistent across a physiological range of matrix rigidity. Strikingly, the pro-fibrotic transforming growth factor β1 (TGFβ1) emerged as a specific modifier of age-associated VSM stiffening in vitro. TGFβ1 reinforced the mechanical phenotype of arterial aging in VSM cells on multiple time and length scales through clustering of mechanosensitive α5β1 and αvβ3 integrins. Taken together, these studies identify a novel nodal point for the long-range regulation of VSM stiffness and serve as a proof-of-concept that the broad-based inhibition of TGFβ1 expression, or TGFβ1 signal transduction in VSM, may be a useful therapeutic approach to mitigate the pathologic progression of central arterial wall stiffening associated with aging.


Conflict of interest statement

The authors declare no competing interests.

Figures

Figure 1
Figure 1
Material properties of young vs. old VSM cells as measured by MTC. (a) Using MTC, we measured cell stiffness (g’, storage modulus) and internal friction (g”, loss modulus) over 5 decades of probing frequency. Data are presented as Geometric Mean ± SE (young VSM, n = 466 cells; old VSM, n = 298 cells). The solid lines are the fit of experimental data to the structural damping equation with addition of a Newtonian viscous term as previously described. A shaded box indicates statistical differences between young vs. old VSM cells. (b) Corresponding hysteresivity η (the ratio of g” to g’) detected at 0.75 Hz. Data are presented as Mean ± SE. (c) Stiffness of VSM cells adhered on collagen-coated plastic wells cultured in media containing a varying FBS concentration (0.1–10%). Data are presented as Geometric Mean ± SE (n = 113–195 individual cell measurements for each condition). (d) Stiffness of VSM cells (1% FBS) cultured on collagen-coated elastic gels with varying rigidity (1–20 kPa with Poisson’s ratio of 0.48). Data are presented as Geometric Mean ± SE (1 kPa, n = 175–370 individual cell measurements; 8 kPa, n = 68–119 individual cell measurements; 20 kPa, n = 401–520 individual cell measurements). *P < 0.05; **P < 0.01; ****P < 0.0001. Herein, we report cell stiffness measured at 0.75 Hz. For measured stiffness and friction over 5 decades of probing frequency, please see Supplementary Figure 3.
Figure 2
Figure 2
TGFβ1 expression and signaling in VSM cells. (a) Production of TGFβ1 by young vs. old VSM cells as detected by sandwich enzyme-linked immunosorbent assay. Data are presented as Mean ± SD (n = 3). (b,c) VSM cells (young and old) were treated for 24 h with or without 5 ng/ml TGFβ1. (b) Phosphorylation levels of Smad2/3 were detected by western blot (Full gel/blot is shown in the Supplementary Figure 5). (c) Quantitation of the protein levels. Data are expressed as Mean ± SD (n = 3). *P < 0.05 (untreated vs. TGFβ1 treated); #P < 0.05 (young vs. old).
Figure 3
Figure 3
Immunofluorescent detection of actin cytoskeletal structures in VSM cells. VSM cells (young and old) were treated for 24 h with or without 5 ng/ml TGFβ1, and the internal cytoskeletal structures were visualized with actin cytoskeleton/focal adhesion staining kit as described in the Methods (a). Scale bar is 20 µm. Average fluorescent intensities of (b) phalloidin and (c) vinculin per cell from multiple images are presented as Mean ± SE (Young: n = 7; Young + TGFβ1: n = 5; Old: n = 7; Old + TGFβ1: n = 6). *P < 0.05; **P < 0.01; ***P < 0.001.
Figure 4
Figure 4
Functional changes in the cytoskeletal stiffness by TGFβ1. (a) VSM cells (young and old) were treated for 24 h with or without 5 ng/ml TGFβ1, and changes in cell stiffness were measured by MTC. Data are presented as Geometric Mean ± SE (n = 175–410 individual cell measurements). (b) Old VSM cells were transfected with 25 nM small interference RNA (siRNA) against TGFβ1. After 48 h of transfection, TGFβ1 protein level was determined by western blot (Full gel/blot is shown in the Supplementary Figure 6). (c) Stiffness of old VSM cells transfected with control or siRNA against TGFβ. Data are presented as Geometric Mean ± SE (n = 112–162 individual cell measurements). (d) Stiffness of old VSM cells treated for 24 h with TGFβ1 receptor inhibitors, A8301 and GW788388 (0–10 μM). Data are presented as Geometric Mean ± SE (n = 184–338 individual cell measurements). (e) TGFβ1-induced cell stiffness in young VSM cells treated for 24 h with or without the inhibitors (10 μM A8301 and 10 μM GW788388). DMSO (0.1%) was used as control. Data are presented as Geometric Mean ± SE (n = 439–477 individual cell measurements). *P < 0.05; ****P < 0.0001.
Figure 5
Figure 5
Cell adhesion and spreading on TGT surfaces (incubation time, t = 2 h). (a) A schematic of TGT assay. (b) Total number of adherent VSM cells on 23 and 54 pN TGT surfaces. The number of adherent cells after 2 h incubation was counted. The TGT assay in each condition was repeated at least three times. Data are presented as Mean ± SE (n = 3 or 4). (c) Measured projected area of each adherent cell on 23 and 54 pN TGT surfaces. Data are presented as Mean ± SE. On 23 pN TGT surface: n = 19, old VSM; n = 37, young VSM; n = 61, young VSM with TGFβ1. On 54 pN TGT surface: n = 25, old VSM; n = 171, young VSM; n = 348, young VSM with TGFβ1. (d) TGT rupture patterns marked by an individual VSM cell. Cell boundary is drawn in white line. dsDNA tethers rupture (fluorescence signal loss in the Cy3 channel) when a stronger molecular tension above a tension tolerance (Ttol) is applied on a receptor-ligand bond. Scale bar is 25 µm. *P < 0.05; **P < 0.01; ***P < 0.001; ****P < 0.0001.
Figure 6
Figure 6
Traction stress maps of isolated VSM cells. (a) Representative phase contrast and traction field images of young vs. old VSM cells adhered to an elastic gel coated with type I collagen (Young’s modulus of 8 kPa with a Poisson’s ratio of 0.48). The white lines show the cell boundary, colors show the magnitude of the tractions in Pascal (Pa) indexed to the color bar at the right, and arrows show the direction and relative magnitude of the tractions. Scale bar is 50 μm. As described,, for each individual adherent cell, we computed (b) projected area; (c) root mean square (RMS) traction; (d) maximum cumulative force; (e) total strain energy; (f) prestress; and, (g) net contractile moments. Data are presented as Mean ± SE (n = 8–10 individual cells per group).

Similar articles

Cited by

References

    1. Mattace-Raso FU, et al. Arterial stiffness and risk of coronary heart disease and stroke: the Rotterdam Study. Circulation. 2006;113:657–663. doi: 10.1161/CIRCULATIONAHA.105.555235. - DOI - PubMed
    1. Mattison JA, et al. Resveratrol prevents high fat/sucrose diet-induced central arterial wall inflammation and stiffening in nonhuman primates. Cell Metab. 2014;20:183–190. doi: 10.1016/j.cmet.2014.04.018. - DOI - PMC - PubMed
    1. Mitchell GF, et al. Arterial stiffness and cardiovascular events: the Framingham Heart Study. Circulation. 2010;121:505–511. doi: 10.1161/CIRCULATIONAHA.109.886655. - DOI - PMC - PubMed
    1. Lakatta EG. Cardiovascular regulatory mechanisms in advanced age. Physiol. Rev. 1993;73:413–467. doi: 10.1152/physrev.1993.73.2.413. - DOI - PubMed
    1. Scuteri A, et al. Longitudinal perspective on the conundrum of central arterial stiffness, blood pressure, and aging. Hypertension. 2014;64:1219–1227. doi: 10.1161/HYPERTENSIONAHA.114.04127. - DOI - PMC - PubMed

Publication types

LinkOut - more resources