. 2018 Feb 8;9(1):579.
doi: 10.1038/s41467-018-03033-1.

Regulation of mutant TERT by BRAF V600E/MAP kinase pathway through FOS/GABP in human cancer

Affiliations

Regulation of mutant TERT by BRAF V600E/MAP kinase pathway through FOS/GABP in human cancer

Rengyun Liu et al. Nat Commun. .

Abstract

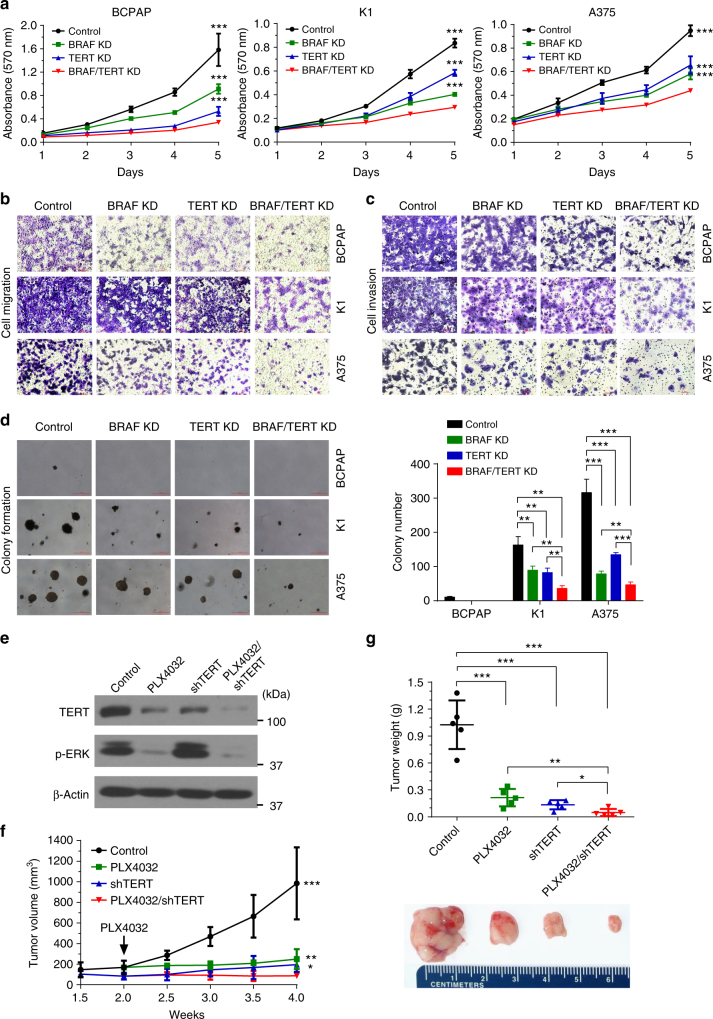
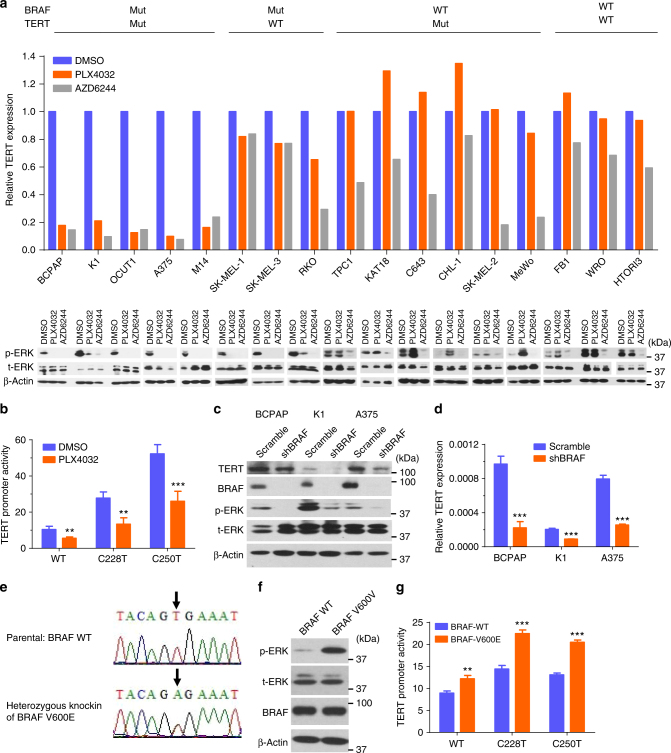
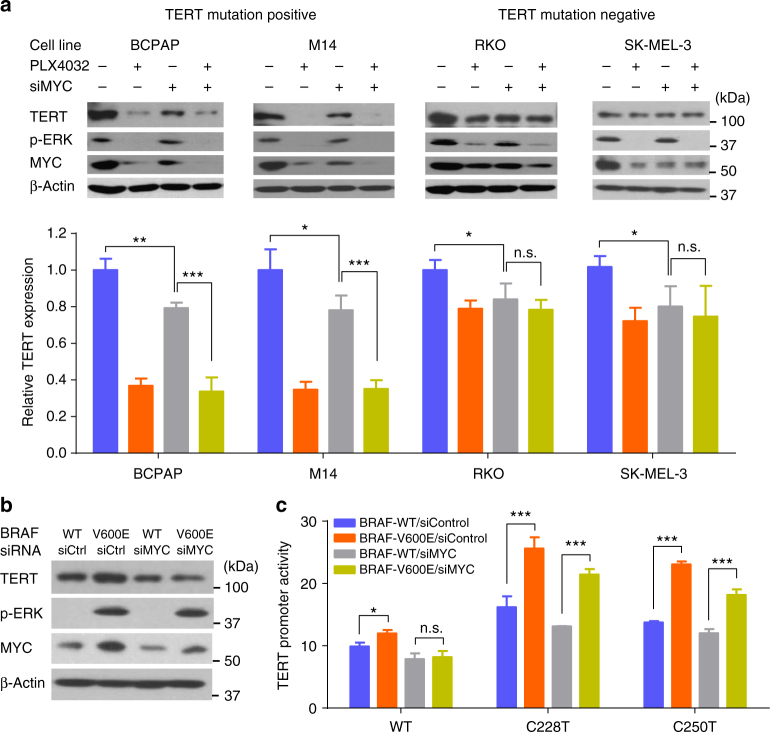
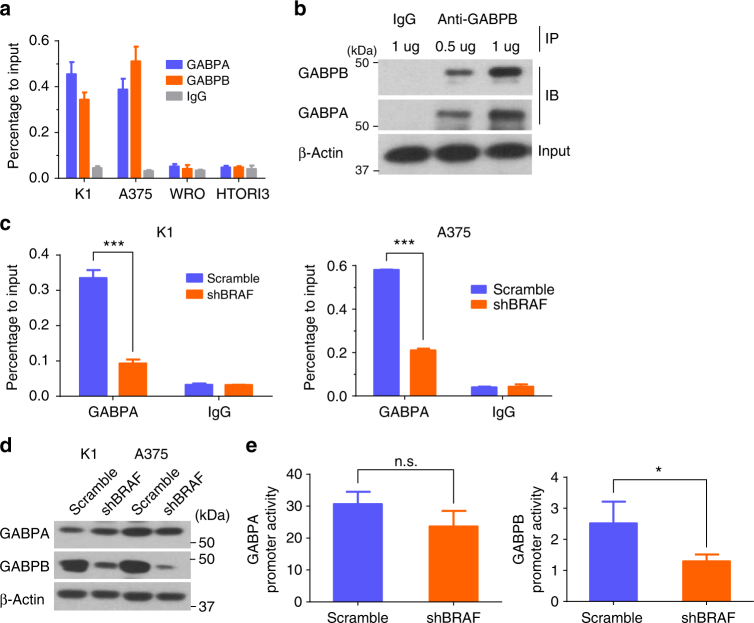
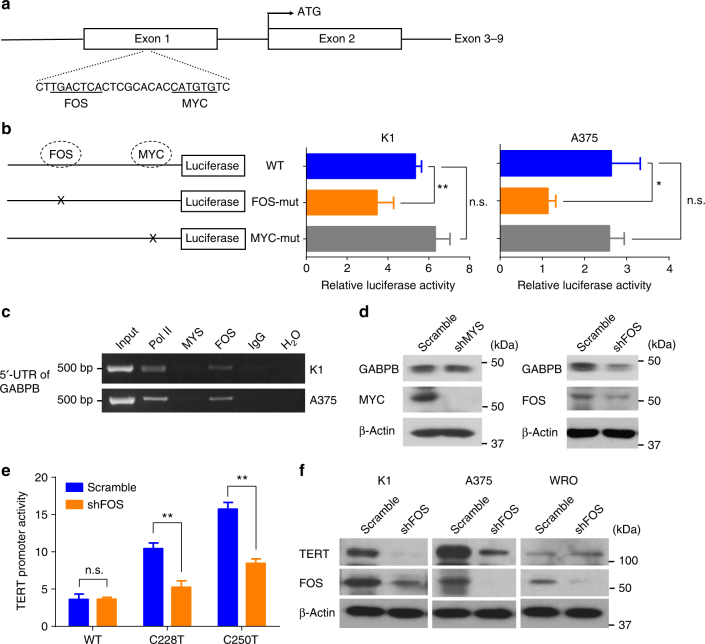
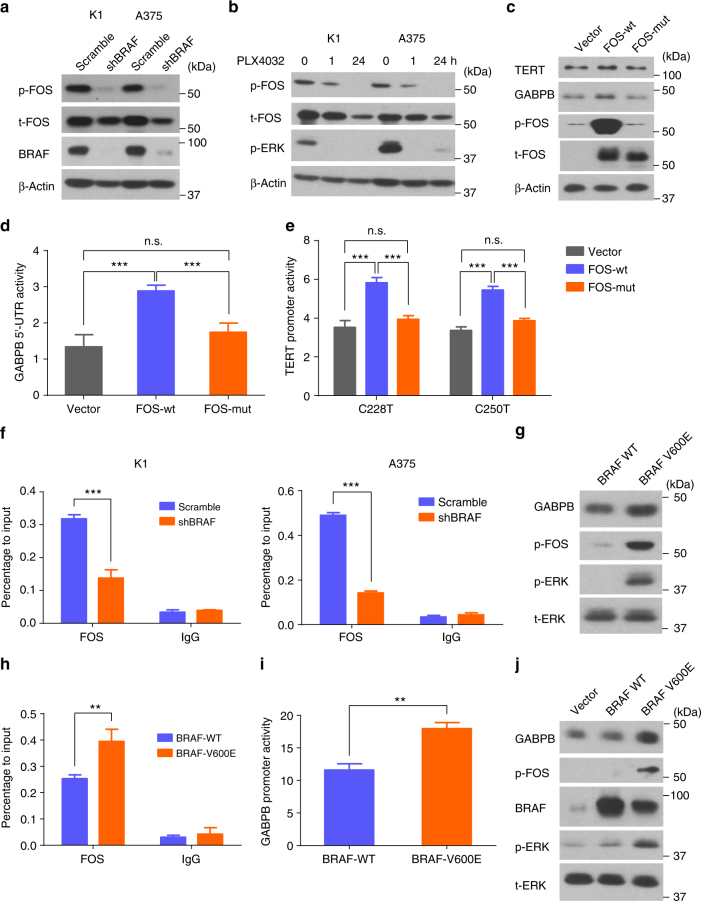
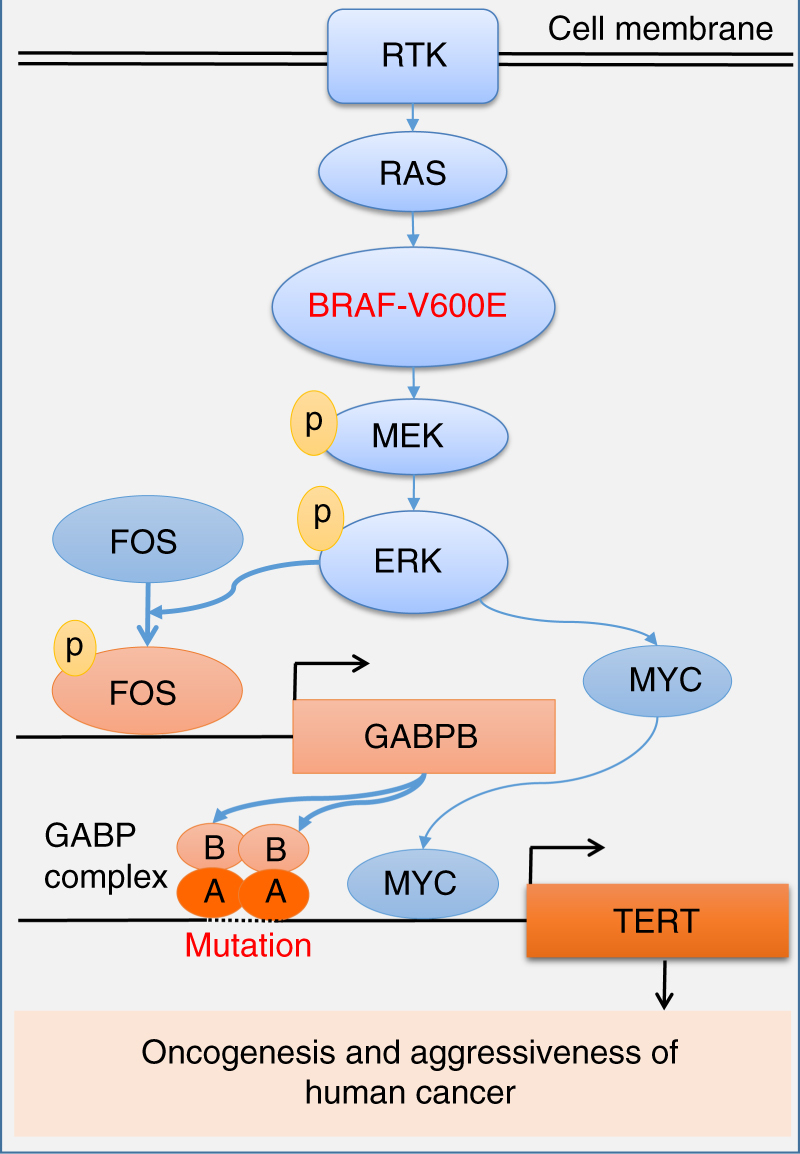
The unique oncogene duet of coexisting BRAF V600E and TERT promoter mutations are widely found to be a robust genetic background promoting human cancer aggressiveness, but the mechanism is unclear. Here, we demonstrate that the BRAF V600E/MAP kinase pathway phosphorylates and activates FOS, which in turn acts as a transcription factor to bind and activate the GABPB promoter, increasing GABPB expression and driving formation of GABPA-GABPB complex; the latter selectively binds and activates mutant TERT promoter, upregulating TERT expression. Elevated TERT functions as a strong oncoprotein, robustly promoting aggressive behaviors of cancer cells and tumor development. We thus identify a molecular mechanism for the activation of mutant TERT by the BRAF V600E/MAP kinase pathway, in which FOS as a transcriptional factor of GABPB promoter plays a key role in functionally bridging the two oncogenes in cooperatively promoting oncogenesis, providing important cancer biological and clinical implications.


Conflict of interest statement

The authors declare no competing financial interests.

Figures

Fig.1
Fig.1
Cooperative role of BRAF V600E and TERT in the oncogenic behavior and tumor growth of cancer cells. Specific shRNA against BRAF and siRNA against TERT were used to knock down BRAF and TERT in the indicated cancer cells, respectively, followed by performance of assays of MTT of cell proliferation (a), transwell cell migration (b), cell invasion (c), and colony formation in soft agar (d) (with representative images shown in the left panel and the average colony numbers in the right panel). Western blotting analysis of TERT and phosphorylation of ERK (p-ERK) was performed for K1 cells (e), from which xenograft tumors were derived to test the role of TERT and BRAF V600E in tumor development and growth (f, g). Panel f shows the time course of tumor growth and panel g shows the weights of tumors surgically excised. The “Control” in ad represented the combination of scramble shRNA and Control siRNA. The “Control” in eg represented the combination of scramble shRNA and DMSO. The horizontal bar in panels b and c represents 100 μm. The red horizontal bar on the left of panel d represents 100 μm; colonies larger than this size were counted and colony numbers are shown on the right of the panel. Little vertical bars in a, d, f, and g represent standard deviation (SD). *P < 0.05, **P < 0.01, ***P < 0.001, by two-tailed Student’s t test. In panel a, the P values are for the comparison of the indicated condition with “BRAF/TERT knockdown (KD)” (red line). In panel f, the P values are for the comparison of the indicated condition with “PLX4032/shTERT” (red line)
Fig. 2
Fig. 2
BRAF V600E/MAPK pathway regulated TERT expression. TERT expression was analyzed by qRT-PCR in cells treated with 0.5 μm PLX4032 or 0.2 μm AZD6244 for 24 h (upper panel). The corresponding levels of phosphorylated ERK (p-ERK), total ERK (t-ERK), and beta-actin were detected by western blotting (lower panel). The relative TERT mRNA expression levels were normalized to the DMSO control group. b Luciferase reporting assay of TERT promoter activities in K1 cells treated with DMSO or PLX4032 (0.5 μm). c, d Specific shRNA against BRAF were used to knock down BRAF in thyroid cancer cell lines BCPAP and K1 and melanoma cell line A375. Scramble shRNA was used as control. Cells were then subjected to western blotting (c) and qRT-PCR (d). e Sequencing of the BRAF exon-15 in the parental and heterozygous BRAF-V600E knock-in SW48 cells. BRAF V600E was knocked in on one allele of BRAF by rAAV technology through homologous recombination and Cre recombinase of the Neo cassette. f Western blotting analyses of phosphorylation of ERK (p-ERK), total ERK (t-ERK), BRAF, and beta-actin in the parental and BRAF-V600E knock-in SW48 cells. g TERT promoter luciferase reporter assay in SW48 cells with/without BRAF V600E knock-in. **P < 0.01, ***P < 0.001, by two-tailed Student’s t test. P values are for the comparison of the indicated condition with DMSO (panel b), scramble (panel d), or BRAF-WT groups (panel g). All the values represent the average ± standard deviation (SD) of triplicate samples from a typical experiment. All the experiments were performed three times with similar results
Fig. 3
Fig. 3
MYC-regulated TERT expression in a TERT promoter mutation-independent manner. a The four indicated cancer cell lines harboring BRAF V600E mutation were treated with 0.5 μm PLX4032 and/or 10 nm MYC-specific siRNA (siMYC) for 24 h, which were then subjected to western blotting (upper panel) and qRT-PCR (lower panel). The relative TERT mRNA expression was normalized to the control group. b, c Parental and BRAF V600E knock-in SW48 cells were treated with control siRNA (siControl) or MYC-specific siRNA (siMYC, 10 nm) for 48 h, followed by western blotting (b) and luciferase reporter assays (c). *P < 0.05, **P < 0.01, ***P < 0.001, by two-tailed Student’s t test. n.s. not significant. All the values represent the average ± standard deviation (SD) of triplicate samples from a typical experiment. Similar results were obtained in two additional independent experiments
Fig. 4
Fig. 4
BRAF V600E promoted GABP binding to mutant TERT promoter by upregulating GABPB. a Chromatin-immunoprecipitation (ChIP) assay for GABPA and GABPB occupancy at TERT promoter in K1 and A375 cells with TERT promoter mutation and in WRO and HTORI3 cells without promoter mutation. IgG was used as negative control. b Co-immunoprecipitation (Co-IP) analysis of the interaction of GABPA with GABPB in K1 cells. c ChIP assay for GABPA occupancy at TERT promoter in K1 and A375 cells with or without stable BRAF knockdown. d Western blotting analyses of GABPA, GABPB, and beta-actin in K1 and A375 cells with/without stable BRAF knockdown. e Luciferase reporter assays for GABPA and GABPB promoters in A375 cells with or without stable BRAF knockdown. Scramble shRNA was used as control. *P < 0.05, ***P < 0.001, by two-tailed Student’s t test. n.s. not significant. All the values represent the average ± standard deviation (SD) of triplicate samples and similar results were obtained in at least two independent experiments
Fig. 5
Fig. 5
FOS bound to 5′-UTR of GABPB and upregulated mutant TERT expression. a Diagrammatic illustration of the putative FOS- and MYC-binding sites in the 5′-UTR of GABPB identified by bioinformatics analyses. The predicted palindromic FOS consensus binding site (5′-TGACTCA-3′) and the canonical MYC binding site (5′-CATGTG-3′) located at +222 to +228 and +238 to +243, downstream of the transcriptional start site, respectively. GABPB 5′-UTR region-luciferase-reporter assays for the wild-type and artificially-induced mutated putative FOS- and MYC-binding sites. c ChIP assay for FOS and MYC occupancy at the 5′-UTR of GABPB in K1 and A375 cells. Pol II and IgG were used for positive and negative controls, respectively. d Western blotting analyses of GABPB, MYC, FOS, and beta-actin in K1 cells with stable FOS or MYC knockdown. TERT promoter-luciferase reporter assays in K1 cells with stable FOS knockdown. f Western blotting analyses for TERT, FOS, and beta-actin in K1, A375 and WRO cells with or without stable FOS knockdown. *P < 0.05, **P < 0.01, by two-tailed Student’s t test. n.s. not significant. All values represent the average ± standard deviation (SD) of triplicate samples, and similar results were obtained in three independent experiments
Fig. 6
Fig. 6
BRAF V600E promoted FOS binding to GABPB by upregulating FOS phosphorylation. a Western blotting analyses for phosphorylated-FOS (p-FOS), total FOS (t-FOS), BRAF, and beta-actin in K1 and A375 cells with or without stable BRAF knockdown. b Western blotting analyses of p-FOS, t-FOS, p-ERK, and beta-actin in K1 and A375 cells treated with 0.5 μm PLX4032 for 0, 1, and 24 h. c, d, e Effects of FOS phosphorylation on GABPB and TERT activation. c KAT18 cells were serum-starved for 24 h and transiently transfected with FOS wild-type (FOS-wt) or mutant (FOS-mut) bearing none of the potential ERK-targeted phosphorylation sites, followed by western blotting analysis for TERT, GABPB, p-FOS, t-FOS, and beta-actin. d KAT18 cells were transfected with FOS-wt or FOS-mut along with GABPB 5′-UTR luciferase reporter and Renilla luciferase (pRL-TK) plasmids in the absence of serum for 24 h, and the luciferase activities were then measured. e KAT18 cells were transiently transfected with FOS-wt or FOS-mut, together with TERT promoter luciferase reporters harboring the C228T or C250T mutation, and pRL-TK for 24 h, followed by luciferase assays. f ChIP assay for FOS binding to the 5′-UTR of GABPB in K1 and A375 cells. g Western blotting analyses for GABPB, p-FOS, p-ERK, and t-ERK in the parental and BRAF-V600E knock-in SW48 cells. h ChIP assay for FOS binding to the 5′-UTR of GABPB in SW48 cells. GABPB 5′-UTR region-luciferase reporter assays in SW48 cells. j Wild-type (WT) BRAF and BRAF V600E were stably introduced to express in WRO cells, followed by western blotting analyses of the expression of GABPB, p-FOS, BRAF, p-ERK, and t-ERK after serum starving overnight. **P < 0.01, ***P < 0.001, by two-tailed Student’s t test. n.s. not significant. All values represent the average ± standard deviation (SD) of triplicate samples and similar results were obtained in two additional independent experiments
Fig. 7
Fig. 7
Oncogenic cooperation of BRAF V600E and TERT promoter mutations. This model illustrates a mechanism for the synergistic oncogenicity between BRAF V600E and TERT promoter mutations in promoting human cancer progression and aggressiveness. This involves promoting TERT expression through the BRAF V600E → MAPK pathway → FOS → GABPB → GABP complex axis for mutant TERT promoter activation; the TERT promoter mutation-independent MYC component promoted by the BRAF V600E/MAPK pathway moderately stimulating TERT expression is also shown

References

    1. Low KC, Tergaonkar V. Telomerase: central regulator of all of the hallmarks of cancer. Trends Biochem. Sci. 2013;38:426–434. doi: 10.1016/j.tibs.2013.07.001. - DOI - PubMed
    1. Horn S, et al. TERT promoter mutations in familial and sporadic melanoma. Science. 2013;339:959–961. doi: 10.1126/science.1230062. - DOI - PubMed
    1. Huang FW, et al. Highly recurrent TERT promoter mutations in human melanoma. Science. 2013;339:957–959. doi: 10.1126/science.1229259. - DOI - PMC - PubMed
    1. Killela PJ, et al. TERT promoter mutations occur frequently in gliomas and a subset of tumors derived from cells with low rates of self-renewal. Proc. Natl. Acad. Sci. USA. 2013;110:6021–6026. doi: 10.1073/pnas.1303607110. - DOI - PMC - PubMed
    1. Liu R, Xing M. TERT promoter mutations in thyroid cancer. Endocr. Relat. Cancer. 2016;23:R143–R155. doi: 10.1530/ERC-15-0472. - DOI - PMC - PubMed

Publication types

MeSH terms