. 2018 Feb 8;9(1):585.
doi: 10.1038/s41467-018-02922-9.

Influences of organic carbon speciation on hyporheic corridor biogeochemistry and microbial ecology

Affiliations

Influences of organic carbon speciation on hyporheic corridor biogeochemistry and microbial ecology

James C Stegen et al. Nat Commun. .

Erratum in

Abstract

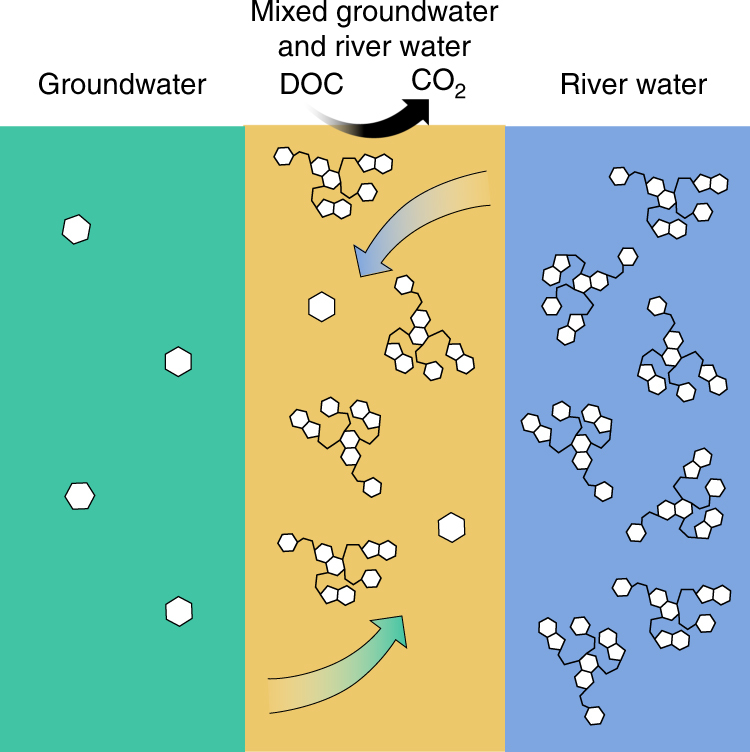
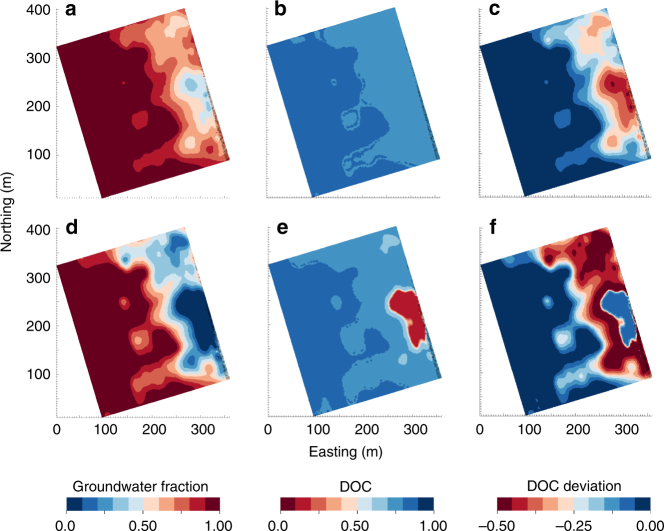
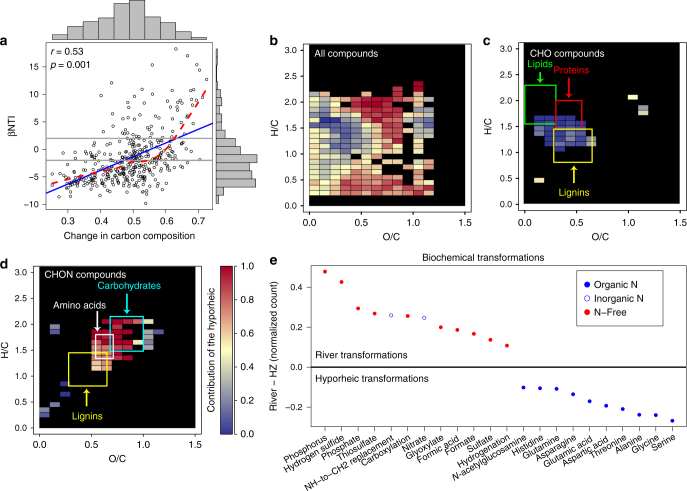
The hyporheic corridor (HC) encompasses the river-groundwater continuum, where the mixing of groundwater (GW) with river water (RW) in the HC can stimulate biogeochemical activity. Here we propose a novel thermodynamic mechanism underlying this phenomenon and reveal broader impacts on dissolved organic carbon (DOC) and microbial ecology. We show that thermodynamically favorable DOC accumulates in GW despite lower DOC concentration, and that RW contains thermodynamically less-favorable DOC, but at higher concentrations. This indicates that GW DOC is protected from microbial oxidation by low total energy within the DOC pool, whereas RW DOC is protected by lower thermodynamic favorability of carbon species. We propose that GW-RW mixing overcomes these protections and stimulates respiration. Mixing models coupled with geophysical and molecular analyses further reveal tipping points in spatiotemporal dynamics of DOC and indicate important hydrology-biochemistry-microbial feedbacks. Previously unrecognized thermodynamic mechanisms regulated by GW-RW mixing may therefore strongly influence biogeochemical and microbial dynamics in riverine ecosystems.


Conflict of interest statement

The authors declare no competing financial interests.

Figures

Fig. 1
Fig. 1
Hypothesized mechanism underlying the stimulation of respiration by mixing of groundwater with river water: low concentration of DOC protects thermodynamically favorable C (represented as monomeric C) by imposing an energetic limitation in terms of low total energy across the DOC pool, allowing favorable DOC to accumulate in GW. The thermodynamically unfavorable state of DOC (represented as polymeric C) in RW protects it from microbial oxidation, allowing it to accumulate in RW despite the DOC of RW being at a higher concentration. GW–RW mixing increases DOC concentration, relative to GW (removing the energetic protection), and improves DOC thermodynamic favorability (removing thermodynamic protection). Simultaneously removing these protection mechanisms stimulates aerobic respiration (DOC to CO2)
Fig. 2
Fig. 2
Spatial and temporal sampling design. a The location of the Hanford site within Washington State and the location of the Hanford 300 Area field site, reproduced from Stegen et al.. b The Columbia River elevation near the field site throughout 2013; vertical red lines indicate sampling times. Sampling times targeted the most dynamic parts of the hydrograph and are not, therefore, evenly spaced. c Sampling locations within the field site where colors indicate different types of sampling locations; red indicates where water was sampled from the river water column, yellow indicates where nearshore hyporheic zone water was sampled from a piezometer placed 1 m below the riverbed, blue indicates where water was sampled from wells accessing the top of the groundwater aquifer, and small black circles indicate locations of geophysical electrodes; map was made using ArcMap 10.4
Fig. 3
Fig. 3
Reactive solutes and groundwater fraction and mixing model deviations. ac Reactive solutes as functions of groundwater (GW) fraction inferred using Cl as a conservative tracer. Linear mixing model expectations are indicated by dashed lines; gray lines are spline fits. River water (RW) concentrations of reactive solutes varied through time. Concentrations at each point in time were thus normalized to the associated RW concentrations; RW samples (blue circles) are always at 1 on the vertical axes. Cl concentrations varied across GW wells (open circles) such that a threshold concentration was selected to indicate pure GW; non-river samples with Cl concentration below this threshold were considered mixed (red circles). DOC, dissovled organic carbon; DIC, dissolved inorganic carbon. d, e Deviations from the DOC and DIC mixing models as functions of GW fraction. The purple rectangles on both panels indicate the range of conditions across which DOC deviations become increasingly negative. f DIC and DOC mixing model deviations within the purple rectangles are regressed on each other, revealing a significant negative relationship; the solid line is the regression model and statistics are provided on the panel
Fig. 4
Fig. 4
Patterns of within sample median Gibbs free energy of the organic carbon oxidation half reaction (ΔGCox0). a Median ΔGCox0 derived from FTICR–MS shows a significant negative relationship with the groundwater (GW) fraction, determined using Cl as a conservative tracer; thermodynamic favorability decreases with increases in ΔGCox0. Regression statistics are provided. b Boxplots summarizing the distributions of median ΔGCox0, which show a significant shift across a DOC concentration threshold of 0.4 mg l−1; t-test statistics are provided. These two results indicate accumulation of thermodynamically favorable DOC in GW despite decreased DOC concentration along a gradient from river water to GW (Fig. 3a), thereby contradicting the classic paradigm of decreasing DOC quality along subsurface flowpaths
Fig. 5
Fig. 5
Spatial projections based on combining ERT estimates of groundwater fraction with aqueous chemistry. Spatial projections were generated across most of the domain that was sampled using groundwater (GW) wells (Fig. 2 and Supplementary Figs. 2,3). Due to changes in river stage, the HC experienced a broad range of GW–river water mixing conditions during the sampling period. Two temporal snapshots were selected that differed in the degree of mixing. ac Projections during a point in time with modest river intrusion and higher GW fraction. df Projections during a point in time with increased river intrusion and lower GW fraction. a, d Projections of GW fraction where pure GW is indicated by 1 and pure river water (RW) is indicated by 0. b, e Projections of dissolved organic carbon (DOC) concentrations generated by combining a and d with the empirical relationship shown by the gray line in Fig. 3a; DOC is presented as a fraction of RW DOC concentration, as in Fig. 3a. Between b and e there is a relatively small decrease in the GW fraction (i.e., a small increase in the RW fraction, as shown by comparing a with d). Due to nonlinearity in the relationship between GW fraction and DOC (Fig. 3a), this small decrease in GW fraction led to a large increase in DOC concentrations within the hyporheic corridor (HC). c, f Projections of the DOC mixing model deviations. The projections were generated by combining the spatial projection of GW fraction (a, d) with the empirical relationship shown by the gray line in Fig. 3d. The panels show that a large fraction of river-derived DOC was not transported into the broader HC, but that a small decrease in the GW fraction (increase in RW fraction) resulted in significant quantities of river-derived DOC being transported into the HC
Fig. 6
Fig. 6
Microbial and organic carbon shifts between the river and HZ. a Ecological-null model outputs (βNTI) from comparisons between river and nearshore HZ microbiomes, as a function of changes in the organic carbon profile. Shifts in the carbon profile were quantified using the Sorensen dissimilarity metric (ranges from 0 to 1) on the presence/absence of peaks from the FTICR–MS data. b, c Van Krevelen diagrams based on FTICR–MS peaks unique to the RW or the HZ. Colors indicate the fraction of peaks found within a grid cell that were unique to the HZ (see color bar for scale). Overlaid rectangles indicate regions consistent with different classes of organic molecules. bd differ in terms of showing data from all peaks (b), peaks with molecular formulas containing only C, H, and O (c), and peaks with molecular formulas containing only C, H, O, and N. e Biochemical transformations inferred from FTICR–MS data that appear to be overrepresented in either the river or the nearshore HZ; for clarity, only transformations with an absolute value on the vertical axis of 0.1 are shown (60 transformations not shown, see Supplementary Data 1). Values of 0 on the vertical axis indicate equal representation, whereas values above/below 0 indicate overrepresentation in the river/HZ, respectively. Colors indicate whether a given transformation involved N and closed vs. open blue circles indicate whether the N was organic or inorganic, respectively

References

    1. Stegen JC, et al. Groundwater-surface water mixing shifts ecological assembly processes and stimulates organic carbon turnover. Nat. Commun. 2016;7:11237. doi: 10.1038/ncomms11237. - DOI - PMC - PubMed
    1. Stanford JA, Ward JV. An ecosystem perspective of alluvial rivers - Connectivity and the hyporheic corridor. J. N. Am. Benthol. Soc. 1993;12:48–60. doi: 10.2307/1467685. - DOI
    1. Boulton AJ, Findlay S, Marmonier P, Stanley EH, Valett HM. The functional significance of the hyporheic zone in streams and rivers. Annu. Rev. Ecol. Syst. 1998;29:59–81. doi: 10.1146/annurev.ecolsys.29.1.59. - DOI
    1. Krause S, et al. Inter-disciplinary perspectives on processes in the hyporheic zone. Ecohydrology. 2011;4:481–499. doi: 10.1002/eco.176. - DOI
    1. Gibert, J., Stanford, J. A., Dole-Olivier, M. J. & J.V., W. in Groundwater Ecology (eds J. Gibert, D. L. Danielopol, & J. A. Stanford) 7–40 (Academic Press, 1994).

Publication types

LinkOut - more resources