. 2018 Feb 8;9(1):559.
doi: 10.1038/s41467-018-03050-0.

Vascular niche IL-6 induces alternative macrophage activation in glioblastoma through HIF-2α

Affiliations

Vascular niche IL-6 induces alternative macrophage activation in glioblastoma through HIF-2α

Qirui Wang et al. Nat Commun. .

Abstract

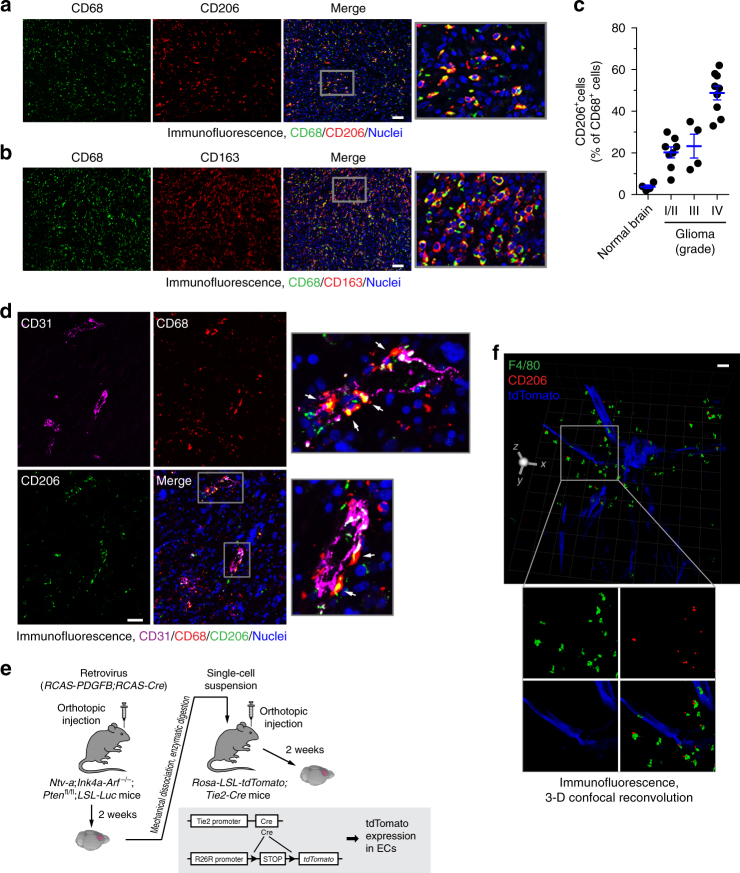
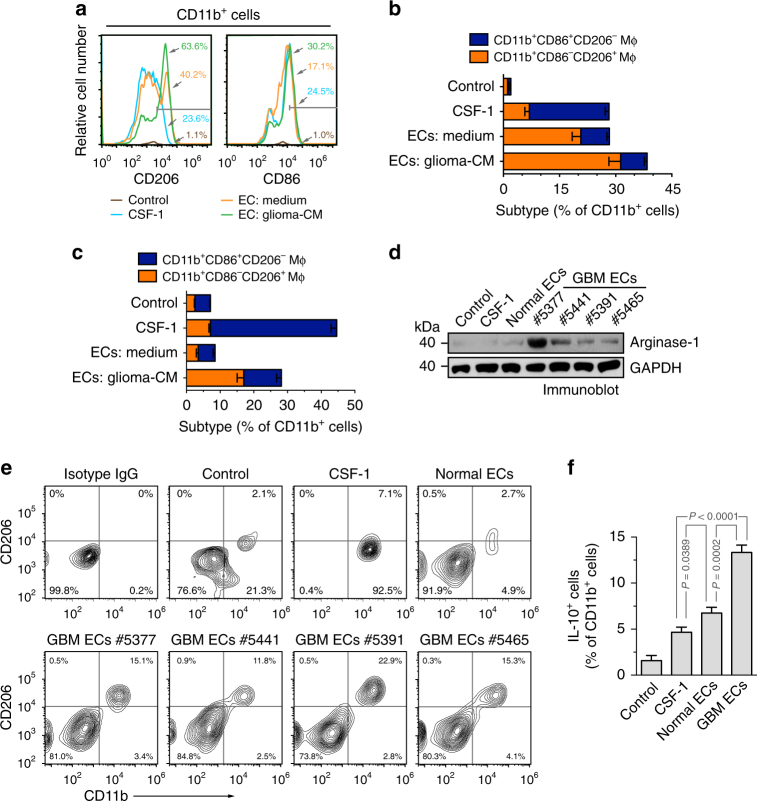
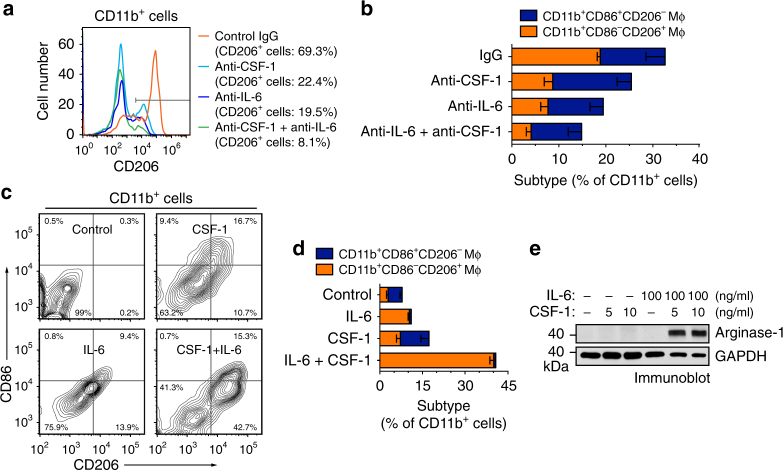
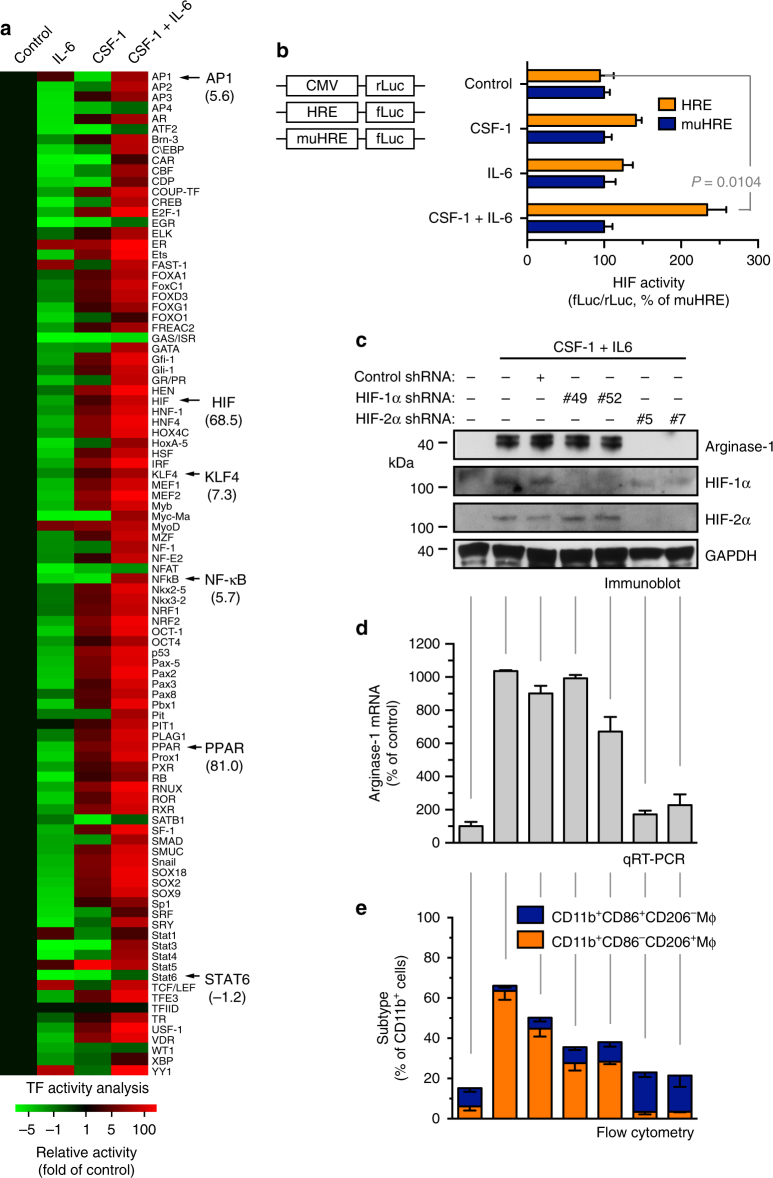
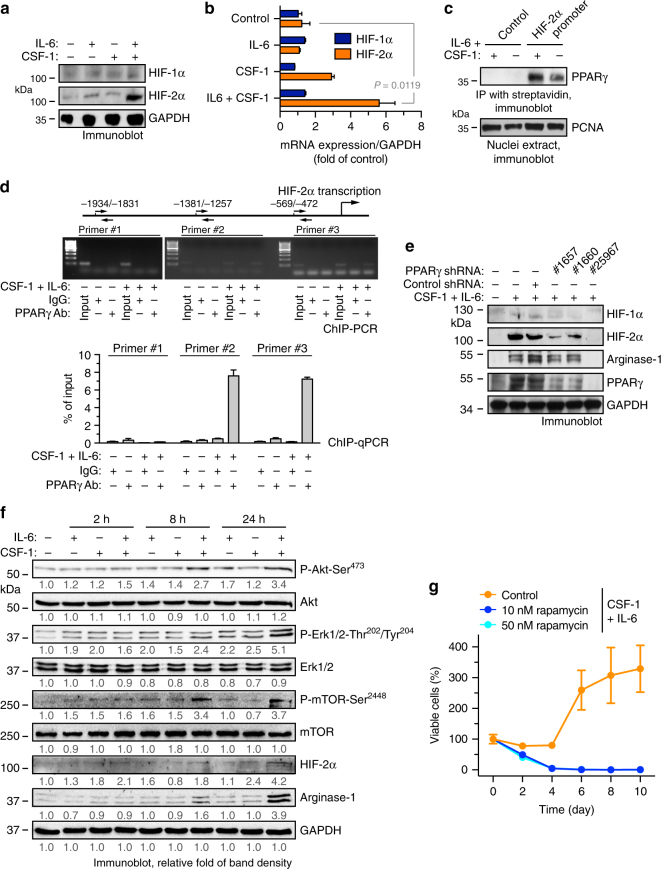
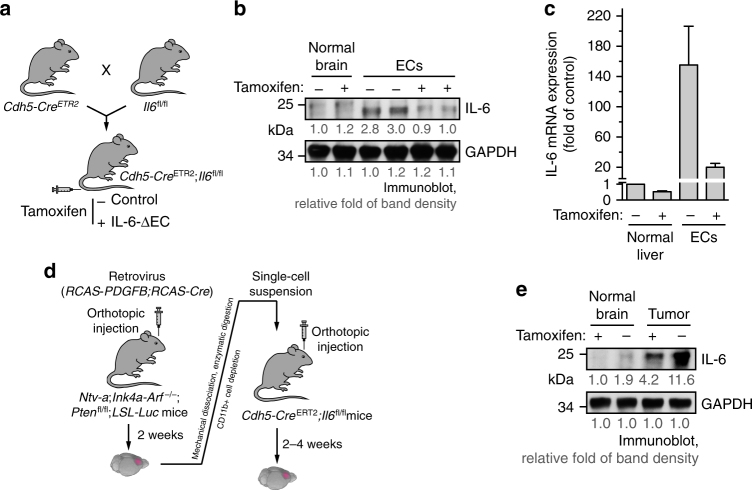
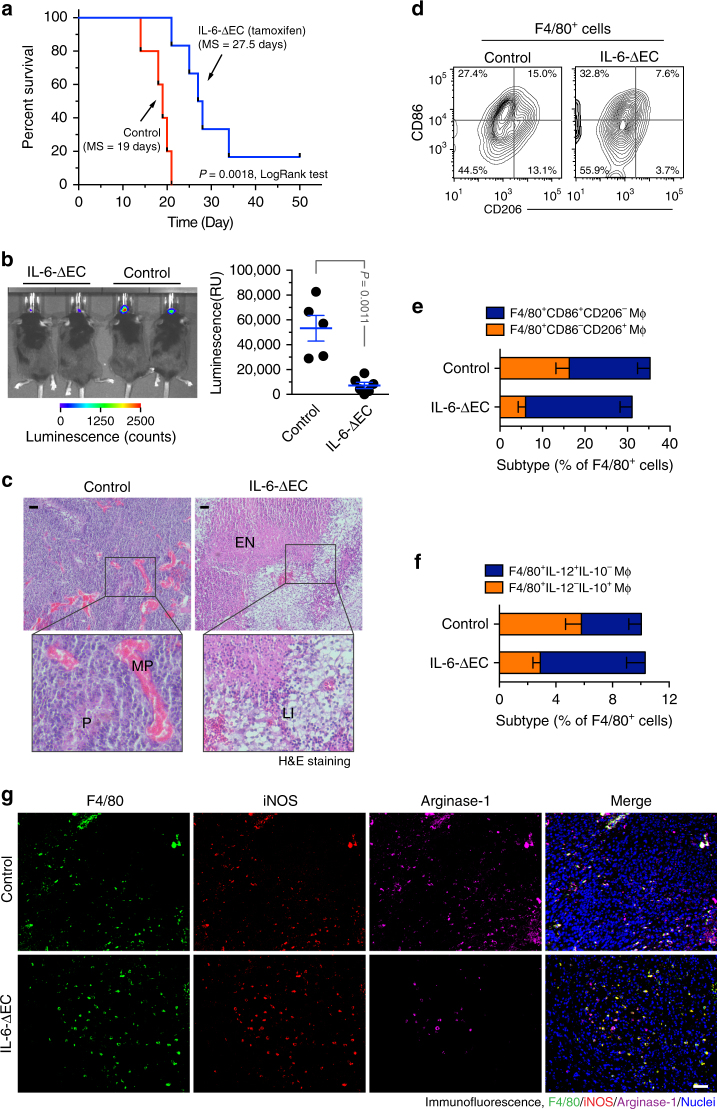
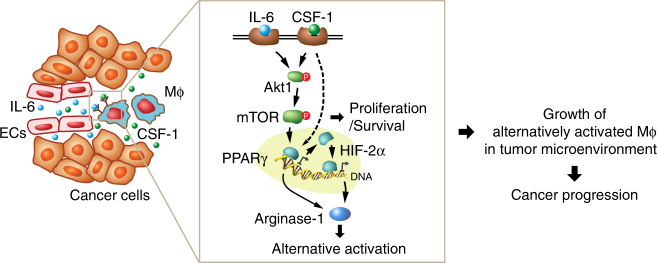
Spatiotemporal regulation of tumor immunity remains largely unexplored. Here we identify a vascular niche that controls alternative macrophage activation in glioblastoma (GBM). We show that tumor-promoting macrophages are spatially proximate to GBM-associated endothelial cells (ECs), permissive for angiocrine-induced macrophage polarization. We identify ECs as one of the major sources for interleukin-6 (IL-6) expression in GBM microenvironment. Furthermore, we reveal that colony-stimulating factor-1 and angiocrine IL-6 induce robust arginase-1 expression and macrophage alternative activation, mediated through peroxisome proliferator-activated receptor-γ-dependent transcriptional activation of hypoxia-inducible factor-2α. Finally, utilizing a genetic murine GBM model, we show that EC-specific knockout of IL-6 inhibits macrophage alternative activation and improves survival in the GBM-bearing mice. These findings illustrate a vascular niche-dependent mechanism for alternative macrophage activation and cancer progression, and suggest that targeting endothelial IL-6 may offer a selective and efficient therapeutic strategy for GBM, and possibly other solid malignant tumors.


Conflict of interest statement

The authors declare no competing financial interests.

Figures

Fig. 1
Fig. 1
Alternatively activated macrophages are localized proximately to GBM-associated ECs. ad Tissue sections from human normal brain and surgical specimens of human glioma tumors were probed with different antibodies. a GBM tumor sections were stained with anti-CD68 and anti-CD206 antibodies. Representative images are shown (n = 5 GBM patient tumors). Bar represents 100 μm. Zoom-in factor: 4. b GBM tumor sections were stained with anti-CD68 and anti-CD163 antibodies. Representative images are shown (n = 5 patient GBM tumors). Bar represents 100 μm. Zoom-in factor: 4. c Normal brain and GBM tumor sections were stained with anti-CD68 and anti-CD206 antibodies. Quantified data are shown (total n = 4 normal brains and 21 glioma tumors, mean ± SEM). d GBM tumor sections were stained with anti-CD31, anti-CD206, and anti-CD68 antibodies. Representative images are shown (n = 5 patient GBM tumors). Arrows indicate CD68+CD206+ cells. Bar represents 100 μm. Zoom-in factor: 4. e, f GBM was induced by RCAS-mediated gene transfer in Ntv-a;Ink4a-Arf−/−;Ptenfl/fl;LSL-Luc mice, followed by orthotopic tumor transplantation into Rosa-LSL-tdTomato;Tie2-Cre mice. e Experimental procedure. f Thick sections were stained with anti-F4/80 and anti-CD206 antibodies, and subjected to confocal scanning imaging. 3-D images were generated and shown. Bar represents 200 μm. Zoom-in factor: 1.6
Fig. 2
Fig. 2
GBM ECs induce alternative activation of macrophages. a, b Mouse brain microvascular ECs were pretreated with the glioma-conditioned medium (glioma-CM, harvested from medium supernatant of mouse GL26 glioma cells under 1% hypoxia) or control medium for 24 h. Mouse bone marrow (BM)-derived macrophages were incubated with CSF-1 or co-cultured with pretreated ECs for 5 days, stained with anti-CD11b, anti-CD86, anti-CD206 antibodies, and analyzed by flow cytometry. a Representative results of CD206 and CD86 expression in CD11b+ cells. b Quantified data in sorted CD11b+ macrophages (Mϕ, n = 3–4 mice, mean ± SEM). c Human brain microvascular ECs were pretreated with the glioma-CM (harvested from medium supernatant of human U251 glioma cells under 1% hypoxia) or control medium for 24 h. Human peripheral blood mononuclear cell (PBMC)-derived monocytes were incubated with CSF-1 or co-cultured with pretreated ECs for 5 days, stained with anti-CD11b, anti-CD86, anti-CD206 antibodies, and subjected to flow cytometry analysis. Quantified data in sorted CD11b+ cells (n = 3, mean ± SEM). d Human PBMC-derived monocytes were incubated for 5 days with CSF-1, or co-cultured with tumor-associated ECs isolated from different GBM patients or human normal brain microvascular ECs in upper and lower chambers of transwells, respectively. Monocytes were harvested and subjected to immunoblot analysis with anti-arginase-1 and anti-GAPDH antibodies. e Human PBMC-derived monocytes were incubated for 5 days with CSF-1, or co-cultured with tumor-associated ECs isolated from different GBM tumors (n = 4 patients) or human normal brain microvascular ECs. Cells were harvested, stained with anti-CD206, and anti-CD86 antibodies, and subjected to flow cytometry analysis. Representative images are shown. f PBMC-derived monocytes were incubated for 5 days with CSF-1, or co-cultured with tumor-associated ECs isolated from GBM patient #5377 or human normal brain microvascular ECs. Cells were harvested, stained with anti-IL-10 and anti-CD11b antibodies, and subjected to flow cytometry analysis (n = 5, mean ± SEM). P values were determined by Student’s t test
Fig. 3
Fig. 3
GBM ECs express IL-6. a Human brain ECs were treated with glioma-CM for 24 h, and cell lysates were subjected to multiplex cytokine array analysis. Left, a representative blot. Right, quantified dot intensity of most significantly changed cytokines. b Human microvascular brain ECs were treated with glioma-CM that were harvested from different human glioma cells. Cell lysates were immunoblotted. c Human microvascular brain ECs and tumor-associated ECs isolated from different GBM patients were subjected to immunoblot analysis. d Mouse GBM was induced by orthotopic injection of GL26 glioma cells into wild-type mouse. The brain sections that include normal brains and tumors were stained with anti-CD31, anti-IL-6, and anti-CSF-1 antibodies. Representative immunofluorescence images are shown. Right, enlarged area in normal and tumor tissues. Bar represents 50 μm. Zoom-in factor: 4
Fig. 4
Fig. 4
IL-6 is critical for EC-induced macrophage alternative activation. a, b Mouse microvascular brain ECs were pretreated with the glioma-CM for 24 h. Mouse BM-derived macrophages were co-cultured with pretreated ECs for 5 days in the presence of control IgG, anti-CSF-1 antibody, or anti-IL-6 antibody or both antibodies. The cells were stained with anti-CD11b, anti-CD86, anti-CD206 antibodies, and analyzed by flow cytometry. a Representative sorting for CD206 expression in CD11b+ cells. b Quantified data in sorted CD11b+ cells (n = 3–5, mean ± SEM). ce Mouse BM-derived macrophages were treated with IL-6 and CSF-1 for 5 days. c, d The cells were stained with anti-CD11b, anti-CD86, and anti-CD206 antibodies, and analyzed by flow cytometry. c Representative sorting for CD206 and CD86 expression in CD11b+ cells. d quantified data in sorted CD11b+ cells (n = 3, mean ± SEM). e Cell lysates were immunoblotted
Fig. 5
Fig. 5
HIF-2α is critical for IL-6-mediated arginase-1 expression and alternative macrophage activation. a Mouse BM-derived macrophages were treated with CSF-1 and IL-6 for 3 days. Nuclei proteins were subjected to multiplex profiling analysis for transcriptional factor activation. Activity was normalized with transcription factor IID, and expressed as the folds of control. b Mouse BM-derived macrophages were transduced with lentivirus that expresses CMV promoter-driven renilla luciferase (CMV-rLuc), hypoxia response element-driven firefly luciferase (HRE-fLuc), and mutated HRE-fLuc (muHRE-fLuc), followed by treatment with CSF-1 and IL-6 for 2 days. Reporter activity radio of fLuc versus rLuc was determined by bioluminescence. Results were expressed as the percentage of muHRE (n = 3, mean ± SEM). P value was determined by Student’s t test. ce Mouse BM-derived macrophages were transduced with lentivirus that expresses shRNAs targeting control scrambled sequence, HIF-1α (#49 and #52) and HIF-2α (#5 and #7), followed by treatment with CSF-1 and IL-6 for 10 days. c Cells were lysed and subjected to immunoblot analysis. d Arginase-1 mRNA was analyzed by real-time RT-PCR. Shown are quantified data (normalized with GAPDH expression, n = 3, mean ± SEM). e Cells were stained with anti-CD11b, anti-CD86, and anti-CD206 antibodies, followed by flow cytometry analysis (n = 3, mean ± SEM)
Fig. 6
Fig. 6
PPARγ induces HIF-2α and arginase-1 expression in macrophages. a, b Mouse BM-derived macrophages were treated with or without CSF-1 and IL-6 for 5 days. a Cell lysates were immunoblotted. b mRNA was extracted and subjected to quantitative RT-PCR analysis. Results were normalized with GAPDH level and expressed as folds of control (n = 3, mean ± SEM). P value was determined by Student’s t test. c, d Mouse BM-derived macrophages were treated with or without CSF-1 and IL-6 for 3 days. c Nuclei protein was incubated with biotin-labeled synthetic DNAs that encode control scrambled or HIF-2α promoter sequence, followed by immunoprecipitation with streptavidin-conjugated beads. Precipitants and nuclei protein were immunoblotted. d Nuclei extracts were subjected to chromatin immunoprecipitation (ChIP) analysis. Immunoprecipitants with control IgG or anti-PPARγ antibody were analyzed by PCR and electrophoresis (upper) or by quantitative PCR (bottom, n = 3, mean ± SD). e Mouse BM-derived macrophages were transduced with lentivirus that expresses shRNAs targeting control scrambled sequence and PPARγ (#1657, #1660, and #25967), followed by treatment with CSF-1 and IL-6 for 10 days. Cells were lysed and subjected to immunoblot analysis. f Mouse BM-derived macrophages were treated with or without CSF-1 and IL-6. At different time points post-treatment, cells were lyzed and subjected to immunoblot analysis. Band density was quantified. g Mouse BM cells were pretreated with or without rapamycin, followed by incubation with CSF-1 and IL-6. Cell viability was determined (n = 3 mice, mean ± SEM)
Fig. 7
Fig. 7
ECs are a major source for IL-6 expression in GBM. ac Cdh5-CreERT2;Il6fl/fl mice were generated by crossing Cdh5-CreERT2 mice with Il6fl/fl mice. Mice (2 weeks old) were injected with tamoxifen for consecutive 5 days to induce EC-specific IL-6 knockout. a Schematic approach. b, c ECs were isolated from mouse aortas. b Brain tissue and ECs were subjected to immunoblot analysis. Band density was quantified. c mRNA was extracted and subjected to quantitative RT-PCR analysis. Results were normalized with GAPDH level and expressed as folds of control (n = 3, mean ± SEM). d, e The primary GBM in Ntv-a;Ink4a-Arf−/−;Pten−/−;LSL-Luc donor mice was induced by RCAS-mediated somatic gene transfer. Recipient mice were Cdh5-CreERT2;Il6fl/fl mice. d Schematic approach. e Normal brain and tumor tissues were homogenized. Tissue lysates were immunoblotted. Band density was quantified
Fig. 8
Fig. 8
Endothelial IL-6 is critical for macrophage alternative activation and GBM growth and progression. The genetically engineered GBM model was induced in Ntv-a;Ink4a-Arf−/−;Pten−/−;LSL-Luc donor mice, followed by orthotopic tumor implantation into Cdh5-CreERT2;Il6fl/fl mice that were treated with (IL-6-ΔEC) or without (Control) tamoxifen. a Animal survival was monitored for 50 days post-injection (n = 5–6 mice, one representative result from three independent experiments). P values were determined by log-rank (Mantel–Cox) tests. MS, median survival. b Tumor growth was analyzed by bioluminescence. Left, representative images. Right, quantitative analysis of integrated luminescence in tumors at day 12 (mean ± SEM, n = 5–6, one representative result from three independent experiments). P value was determined by Student’s t test. c Tumor sections were stained with hematoxylin and eosin (H&E). Representative images are shown (n = 10 mice). P pseudopalisades, MP microvascular proliferation, EN extensive necrosis, LI leukocyte infiltration. Bar represents 100 μm. Zoom-in factor: 3. e, f Tumors were excised. Single-cell suspensions were prepared and subjected to flow cytometry analysis. d, e Single-cell suspensions were probed with anti-F4/80, anti-CD86, and anti-CD206 antibodies. CD206 and CD86 expression were analyzed in sorted F4/80+ cells. d Representative sorting. e Quantified results (mean ± SEM, n = 10–14 mice). f Single-cell suspensions were probed with anti-F4/80, anti-IL-10, and anti-IL-12 antibodies. IL-10 and IL-12 expression was analyzed in sorted F4/80+ cells. Show are quantified results (mean ± SEM, n = 8–13 mice). g Tumor sections were stained and analyzed by immunofluorescence. Tumor sections were probed with anti-iNOS, anti-arginase-1, anti-F4/80 antibodies (n = 10 mice). Bar represents 100 μm
Fig. 9
Fig. 9
A schematic model. In glioma microenvironment, endothelial cell-derived IL-6 and microenvironmental CSF-1 synergistically activate downstream Akt1/mTOR pathway and induces transcriptional activation of PPARγ in macrophages (Mϕ), in turn leading to HIF-2α-mediated arginase-1 expression, and inducing macrophage alternative polarization. The activation of mTOR also induces cell proliferation, contributing to cell survival and growth of alternatively activated macrophages, eventually leading to glioma progression

References

    1. Pollard JW. Tumour-educated macrophages promote tumour progression and metastasis. Nat. Rev. Cancer. 2004;4:71–78. doi: 10.1038/nrc1256. - DOI - PubMed
    1. Ruffell B, Coussens LM. Macrophages and therapeutic resistance in cancer. Cancer Cell. 2015;27:462–472. doi: 10.1016/j.ccell.2015.02.015. - DOI - PMC - PubMed
    1. Ostuni R, Kratochvill F, Murray PJ, Natoli G. Macrophages and cancer: from mechanisms to therapeutic implications. Trends Immunol. 2015;36:229–239. doi: 10.1016/j.it.2015.02.004. - DOI - PubMed
    1. Sica A, Mantovani A. Macrophage plasticity and polarization: in vivo veritas. J. Clin. Invest. 2012;122:787–795. doi: 10.1172/JCI59643. - DOI - PMC - PubMed
    1. Murray PJ, Wynn TA. Protective and pathogenic functions of macrophage subsets. Nat. Rev. Immunol. 2011;11:723–737. doi: 10.1038/nri3073. - DOI - PMC - PubMed

Publication types

MeSH terms

Substances