. 2018 Feb 8;9(1):558.
doi: 10.1038/s41467-017-02646-2.

Unravelling the immune signature of Plasmodium falciparum transmission-reducing immunity

Affiliations

Unravelling the immune signature of Plasmodium falciparum transmission-reducing immunity

Will J R Stone et al. Nat Commun. .

Erratum in

  • Publisher Correction: Unravelling the immune signature of Plasmodium falciparum transmission-reducing immunity.
    Stone WJR, Campo JJ, Ouédraogo AL, Meerstein-Kessel L, Morlais I, Da D, Cohuet A, Nsango S, Sutherland CJ, van de Vegte-Bolmer M, Siebelink-Stoter R, van Gemert GJ, Graumans W, Lanke K, Shandling AD, Pablo JV, Teng AA, Jones S, de Jong RM, Fabra-García A, Bradley J, Roeffen W, Lasonder E, Gremo G, Schwarzer E, Janse CJ, Singh SK, Theisen M, Felgner P, Marti M, Drakeley C, Sauerwein R, Bousema T, Jore MM. Stone WJR, et al. Nat Commun. 2018 Apr 11;9(1):1498. doi: 10.1038/s41467-018-03769-w. Nat Commun. 2018. PMID: 29643330 Free PMC article.

Abstract

Infection with Plasmodium can elicit antibodies that inhibit parasite survival in the mosquito, when they are ingested in an infectious blood meal. Here, we determine the transmission-reducing activity (TRA) of naturally acquired antibodies from 648 malaria-exposed individuals using lab-based mosquito-feeding assays. Transmission inhibition is significantly associated with antibody responses to Pfs48/45, Pfs230, and to 43 novel gametocyte proteins assessed by protein microarray. In field-based mosquito-feeding assays the likelihood and rate of mosquito infection are significantly lower for individuals reactive to Pfs48/45, Pfs230 or to combinations of the novel TRA-associated proteins. We also show that naturally acquired purified antibodies against key transmission-blocking epitopes of Pfs48/45 and Pfs230 are mechanistically involved in TRA, whereas sera depleted of these antibodies retain high-level, complement-independent TRA. Our analysis demonstrates that host antibody responses to gametocyte proteins are associated with reduced malaria transmission efficiency from humans to mosquitoes.


Conflict of interest statement

P.F. owns stock and is a board member at Antigen Discovery, Inc. The remaining authors declare no competing financial interests.

Figures

Fig. 1
Fig. 1
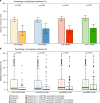
Antibody responses to Pfs48/45, Pfs230 and to the microarray proteins with age. Antibody responses to correctly folded, recombinant Pfs48/45-10C and Pfs230 (230CMB) were measured using ELISA, with antibody intensity given as the ELISA optical density (OD) values (450 nm). Antibody responses to microarray proteins are given as the log2-transformed signal intensity (SI) minus the vehicle SI, which equates to the log2-fold change over this background. All graphs show only individuals from endemic areas (Dutch migrants excluded). Sample size: 0–5 = 131, 5–15 = 366, 15+ = 71. a, c Bars show the seroprevalence of α-Pfs48/45 and α-Pfs230 antibodies with age, with Clopper–Pearson confidence intervals. b, d Boxplots showing α-Pfs48/45 and α-Pfs230 antibody intensity with age. e Boxplots showing responses to the microarray protein targets (n = 528). Antibody breadth is the number of proteins reactive above background in each individual, within the given groups. f Magnitude of antibody response to microarray protein targets. Each dot represents the average SI of response to each protein target by all individuals within given groups. p-values for prevalence data are from likelihood ratio test for differences in seroprevalence between all age groups, derived from logistic regression and adjusted for gametocyte density. p-values for intensity data and response breadth are from an F-test for differences in OD/SI between all age groups, derived from linear regression and adjusted for gametocyte density or from ANOVA (for magnitude only). For all boxplots, outliers are shown in black, whereas all data points are shown in grey as a bee-swarm
Fig. 2
Fig. 2
Transmission-reducing activity (TRA) and antibody responses to Pfs48/45, Pfs230 and microarray proteins. TRA was categorised as described, to compare responses between gametocyte-positive individuals with <10% TRA, and individuals with >90% TRA. Antibody responses to correctly folded, recombinant Pfs48/45-10C and Pfs230 (230CMB) were measured using ELISA, with antibody intensity given as the ELISA optical density (OD) values (450 nm). Antibody responses to microarray proteins are given as the log2-transformed signal intensity (SI) minus the vehicle SI, which equates to the log2-fold change over this background. a, b Boxplots of α-Pfs48/45 and α-Pfs230 antibody intensity with TRA. c Responses to the microarray protein targets (n = 528). Antibody breadth is the number of proteins reactive above background in each individual, within the given groups. d Magnitude of antibody response to microarray protein targets. Each dot represents the average SI of response to each protein target by all individuals within given groups. p-values for intensity data and response breadth are from an F-test for differences in OD/SI between all age groups, derived from linear regression, and adjusted for gametocyte density or from students t-test (for magnitude only). For all boxplots, outliers are shown in black, whereas all data points are shown in grey as a bee-swarm. e Volcano plot showing the log2-fold change of the mean signal intensity for TRA as defined above. The p-value shown by the dotted line is unadjusted for false discovery. Black-circled data points are those that remain significant after p-values have been adjusted to control the rate of false discovery below 5%, using the Benjamini–Hochberg method
Fig. 3
Fig. 3
Seroprevalence to Pfs48/45, Pfs230, and novel TRA-associated microarray proteins, and infectiousness in the direct membrane-feeding assay (DMFA). Individuals with DMFA data were categorised according to their possession of antibodies specific to: Pfs48/45 (positive (+)/negative (−)); Pfs230 (positive (+)/negative (−)); ≥14 of the 61 novel microarray proteins with TRA-associated antibody responses (14 being the 75th percentile of the breadth of response to these microarray targets among the entire sample set); ≥4 of the 16 novel microarray proteins with TRA-associated antibody responses that are also plausible targets of antibodies with TRA (4 being the 75th percentile of the breadth of response to these microarray targets among the entire sample set). a Bars show the proportion of infectious individuals among seropositive/seronegative gametocytaemic individuals with DMFA data, with Clopper–Pearson confidence intervals. n/N = number of individuals seropositive/total number of individuals with DMFA data. P-values are from logistic regression, with adjustment for gametocyte density. b Boxplots show the percentage of mosquitoes that became infected after feeding. n/N = the number of mosquitoes feeding on seropositive individuals/the total number of mosquitoes feeding on individuals with DMFA data. p-values are from logistic models, adjusted for gametocyte density and with host (individual the mosquitoes were feeding upon) as a random effect. For all boxplots, outliers are shown as hollow black circles, whereas all data points are shown as solid coloured circles
Fig. 4
Fig. 4
Gamete surface immuno-fluorescence assay (SIFA) using wild-type and Pfs48/45 knockout (KO) NF54 gametes, with Pfs48/45 mAb, Pfs230 mAb, and IgG from a malaria-exposed serum donor. Donor IgG is from donor A in Table 2, and was performed using total IgG, and total IgG depleted of α-Pfs48/45-10c and α-Pfs230 (230CMB) IgG. Δ Pfs48/45 = Pfs48/45 KO. BF Bright-field, FITC fluorescein isothiocyanate. Anti-Pfs48/45 is mAb 45.1, and anti-Pfs230 is mAb 2A2, as described in the methods. Scale bar is 20 µm

References

    1. Silvestrini F, et al. Protein export marks the early phase of gametocytogenesis of the human malaria parasite Plasmodium falciparum. Mol. Cell. Proteom. 2010;9:1437–1448. doi: 10.1074/mcp.M900479-MCP200. - DOI - PMC - PubMed
    1. Florens L, et al. A proteomic view of the Plasmodium falciparum life cycle. Nature. 2002;419:520–526. doi: 10.1038/nature01107. - DOI - PubMed
    1. van Dijk MR, et al. A central role for P48/45 in malaria parasite male gamete fertility. Cell. 2001;104:153–164. doi: 10.1016/S0092-8674(01)00199-4. - DOI - PubMed
    1. Rener J, Graves PM, Carter R, Williams JL, Burkot TR. Target antigens of transmission-blocking immunity on gametes of plasmodium falciparum. J. Exp. Med. 1983;158:976–981. doi: 10.1084/jem.158.3.976. - DOI - PMC - PubMed
    1. Muirhead-Thomson RC. The malarial infectivity of an African village population to mosquitoes (Anopheles gambiae); a random xenodiagnostic survey. Am. J. Trop. Med. Hyg. 1957;6:971–979. doi: 10.4269/ajtmh.1957.6.971. - DOI - PubMed

Publication types

Substances