. 2018 Feb 8;8(1):2671.
doi: 10.1038/s41598-018-20966-1.

Evaluating the potential of endothelial cells derived from human induced pluripotent stem cells to form microvascular networks in 3D cultures

Affiliations

Evaluating the potential of endothelial cells derived from human induced pluripotent stem cells to form microvascular networks in 3D cultures

Jonathan R Bezenah et al. Sci Rep. .

Abstract

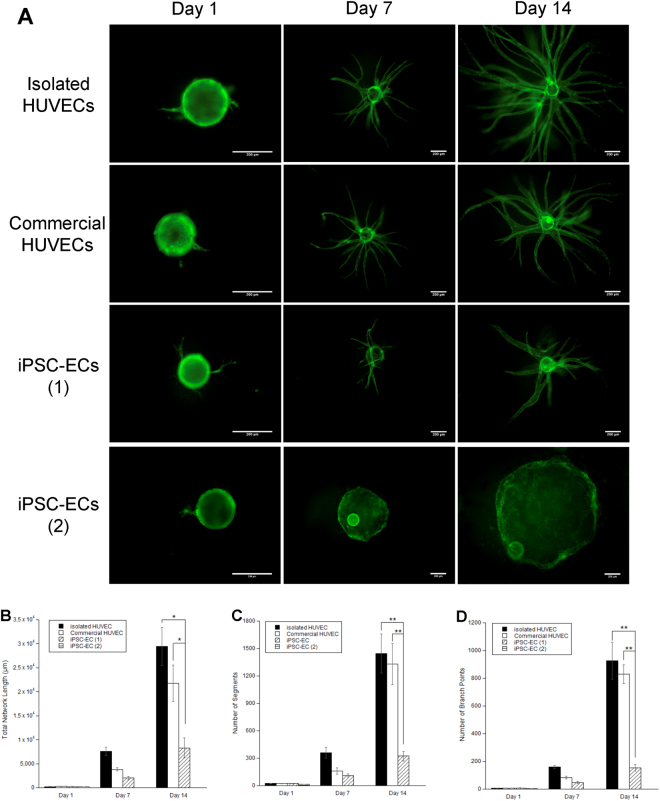
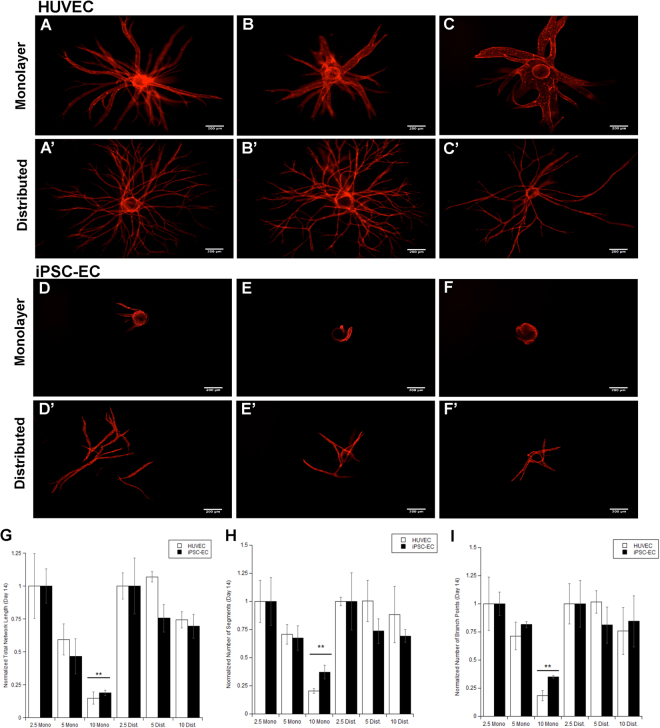
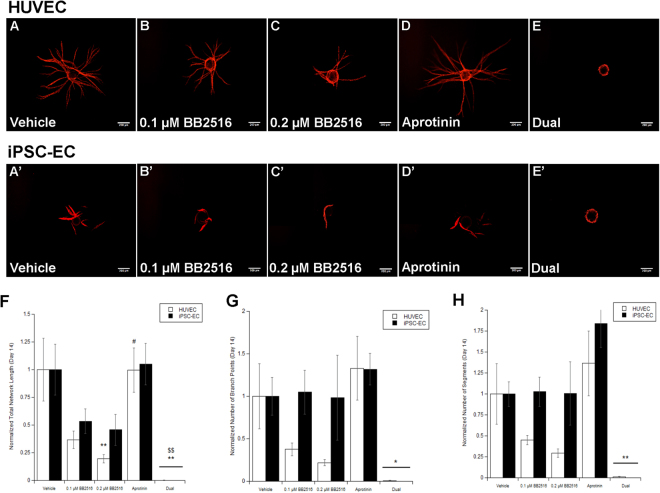
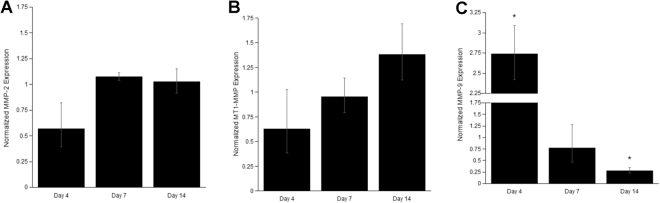
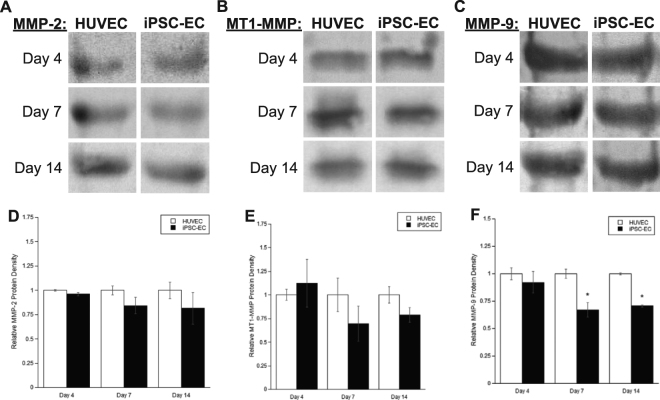
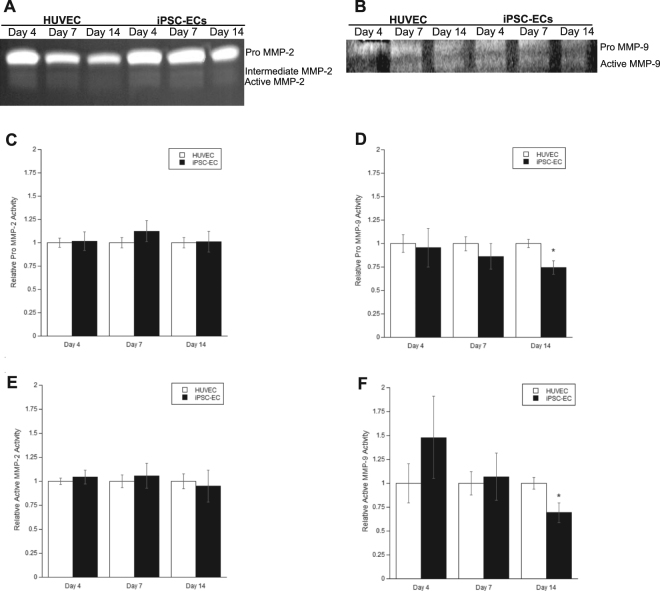
A major translational challenge in the fields of therapeutic angiogenesis and regenerative medicine is the need to create functional microvasculature. The purpose of this study was to assess whether a potentially autologous endothelial cell (EC) source derived from human induced pluripotent stem cells (iPSC-ECs) can form the same robust, stable microvasculature as previously documented for other sources of ECs. We utilized a well-established in vitro assay, in which endothelial cell-coated (iPSC-EC or HUVEC) beads were co-embedded with fibroblasts in a 3D fibrin matrix to assess their ability to form stable microvessels. iPSC-ECs exhibited a five-fold reduction in capillary network formation compared to HUVECs. Increasing matrix density reduced sprouting, although this effect was attenuated by distributing the NHLFs throughout the matrix. Inhibition of both MMP- and plasmin-mediated fibrinolysis was required to completely block sprouting of both HUVECs and iPSC-ECs. Further analysis revealed MMP-9 expression and activity were significantly lower in iPSC-EC/NHLF co-cultures than in HUVEC/NHLF co-cultures at later time points, which may account for the observed deficiencies in angiogenic sprouting of the iPSC-ECs. Collectively, these findings suggest fundamental differences in EC phenotypes must be better understood to enable the promise and potential of iPSC-ECs for clinical translation to be realized.


Conflict of interest statement

The authors declare no competing interests.

Figures

Figure 1
Figure 1
iPSC-ECs exhibit deficiencies in capillary morphogenesis compared to HUVECs. (A) EC-coated microbeads embedded in 2.5 mg/mL fibrin with NHLF at various time points were stained for CD31 and visualized via fluorescent microscopy. Scale bar = 200 µm. Over 3 separate experiments, a total of 30 beads per EC were quantified and averaged for (B) total capillary network length, (C) number of segments, and (D) number of branch points. *p < 0.05 and **p < 0.01 when comparing the indicated condition to the isolated HUVEC control at that time point. Error bars indicate ±SEM.
Figure 2
Figure 2
Both HUVECs and iPSC-ECs form vessel-like structures with characteristics of mature capillaries. HUVECs (A–F) or iPSC-ECs (A’–F’) were coated on micro carrier beads and embedded in a fibrin ECM with NHLFs interspersed throughout. Beads were monitored over a 14-day period. (A,A’). Cultures were fixed and IF stained at day 14 for UEA (red), F-Actin (green), and αSMA (blue). Pericytic association was observed for both EC types. Cultures were fixed and IF stained at day 14 for (B,B’) UEA (red), and collagen IV (green) or (C,C’) UEA (red), and laminin (green). Basement membrane deposition was observed for both EC types. Hollow lumen formation was demonstrated through laser confocal microscopy at the bottom (D,D’), middle (E,E’), and top (F,F’) slice of vessel-like structures. The schematic in the upper right of each of these subsets indicates the slice relative to the vessel. Arrows indicate areas of focus. Scale bars = 100 µm.
Figure 3
Figure 3
Distributing stromal cells throughout the matrix abrogates reductions in EC sprouting caused by elevated fibrin concentrations for both HUVECs and iPSC-ECs. Fluorescent images of UEA-stained HUVEC (AC,AC’) or iPSC-EC (DF,D’–F’) coated microcarrier beads with (AF) overlaying monolayer or (A’–F’) distributed NHLFs. Beads are embedded in (A,A’,D,D’) 2.5 mg/mL, (B,B’,E,E’) 5 mg/mL, (C,C’,F,F’) 10 mg/mL fibrin matrices. Scale bar = 200 µm. A total of 30 beads over three separate experiments at day 14 were quantified, averaged, and normalized to the respective 2.5 mg/mL stromal cell distribution of each EC type for (G) total capillary network length, (H) number of segments, and (I) number of branch points. *p < 0.05 and **p < 0.01 when comparing the indicated condition to the 2.5 mg/mL monolayer condition. Error bars indicate ±SEM.
Figure 4
Figure 4
Capillary morphogenesis by iPSC-ECs and HUVECs proceed via similar preoteolytic mechanisms. HUVEC (A–E) or iPSC-EC (A’–E’) coated microcarrier beads were embedded in a fibrin matrix dispersed with NHLFs. Shown are fluorescent images stained for UEA at day 14 of the capillary network formation from cultures treated with (A,A’) vehicle (DMSO), (B,B’) 0.1 µM, or (C,C’) 0.2 µM of the broad spectrum MMP inhibitor BB2516, (D,D) 22 nM of the serine protease inhibitor aprotinin, or with a combination of BB2516 (0.1 µM) and aprotinin (22 nM) (“dual”). Scale = 200 µm. (F) Total capillary network length, (G) number of segments, and (H) number of branch points from a minimum of 30 beads over three separate experiments at day 14 were quantified, averaged, and normalized to the respective EC vehicle control. *p < 0.05 and **p < 0.01 when comparing the indicated condition to the vehicle control. @p < 0.05 and @@p < 0.01 when comparing the indicated condition to the 0.1 µM BB2516 condition. #p < 0.05 and ##p < 0.01 when comparing the indicated condition to the 0.2 µM BB2516 condition. $p < 0.05 and $$p < 0.01 when comparing the indicated condition to the aprotinin condition. Error bars indicate ±SEM.
Figure 5
Figure 5
iPSC-ECs co-cultures show differences in MMP RNA expression levels compared to HUVEC co-cultures. The expression levels of key matrix metalloproteases [(A) MMP-2, (B) MT1-MMP, and (C) MMP-9] involved in capillary morphogenesis were quantified from iPSC-EC/NHLF co-cultures via qPCR. Expression levels were averaged across three separate experiments at the indicated time points and normalized to HUVEC/NHLF co-culture controls. *p < 0.05 when comparing the indicated time point to the HUVEC control. Error bars indicate ±SEM.
Figure 6
Figure 6
iPSC-EC/NHLF co-cultures show differences in MMP protein expression levels compared to HUVEC/NHLF co-cultures. Representative images of Western blots for (A) MMP-2, (B) MT1-MMP, (C) MMP-9 from HUVEC or iPSC-EC coated microcarrier beads co-cultured with NHLFS at various time points. Images were quantified and averaged across three separate experiments via scanning densitometry. Protein levels for (D) MMP-2, (E) MT1-MMP, and (F) MMP-9 were normalized to their respective HUVEC co-culture controls. *p < 0.05 when comparing the indicated time point to the HUVEC control. Error bars indicate ±SEM. Full (uncropped) Western blot images are shown in supplemental information (Fig. S1).
Figure 7
Figure 7
iPSC-EC/NHLF co-cultures show differences in the levels of MMP activity compared to HUVEC/NHLF co-cultures. HUVEC or iPSC-EC coated microcarrier beads co-cultured with NHLFs were digested and pooled to assay for activity via gelatin zymography. Representative images of zymograms performed at various time points for (A) MMP-2, and (B) MMP-9. A standard for MMP-2 and -9 was used to identify bands for pro-MMP-9 (92 kDa), active MMP-9 (88 kDa), pro-MMP-2 (72 kDa), intermediate MMP-2 (64 kDa), and active MMP-2 (62 kDa). Images were quantified, and averaged across three separate experiments via scanning densitometry. The levels for (C) pro-MMP-2, (D) pro-MMP-9, (E) active-MMP-2, and (F) active-MMP-9 were normalized to their respective HUVEC/NHLF co-culture controls. *p < 0.05 when comparing the indicated condition to the HUVEC control. Error bars indicate ±SEM. Images were set to 8-bit color and contrast enhanced in an identical manner for each gel prior to quantification. Representative enhanced images are shown here. Full unedited gelatin images are shown in supplemental information (Fig. S2).

Similar articles

Cited by

References

    1. Simons M, Ware JA. Therapeutic angiogenesis in cardiovascular disease. Nat Rev Drug Discov. 2003;2:863–72. doi: 10.1038/nrd1226. - DOI - PubMed
    1. Tarride J-E, et al. A review of the cost of cardiovascular disease. The Canadian Journal of Cardiology. 2009;25(6):e195–e202. doi: 10.1016/S0828-282X(09)70098-4. - DOI - PMC - PubMed
    1. Roger VL, et al. Heart Disease and Stroke Statistics 2011 Update: A Report From the American Heart Association. Circulation. 2011;123:e18–e209. doi: 10.1161/CIR.0b013e3182009701. - DOI - PMC - PubMed
    1. Davies M. Critical Limb Ischemia Epidemiology. Methodist DeBakey Cardiovasc J. 2012;8(4):10–14. doi: 10.14797/mdcj-8-4-10. - DOI - PMC - PubMed
    1. Nor JE, Christensen J, Mooney DJ, Polverini PJ. Vascular endothelial growth factor (VEGF)- mediated angiogenesis is associated with enhanced endothelial cell survival and induction of Bcl-2 expression. American Journal of Pathology. 1999;154(2):375–84. doi: 10.1016/S0002-9440(10)65284-4. - DOI - PMC - PubMed

Publication types

MeSH terms