. 2017 Dec 17;9(3):3815-3829.
doi: 10.18632/oncotarget.23378. eCollection 2018 Jan 9.

The anti-rheumatic drug, leflunomide, synergizes with MEK inhibition to suppress melanoma growth

Affiliations

The anti-rheumatic drug, leflunomide, synergizes with MEK inhibition to suppress melanoma growth

Kimberley Hanson et al. Oncotarget. .

Erratum in

Abstract

Cutaneous melanoma, which develops from the pigment producing cells called melanocytes, is the most deadly form of skin cancer. Unlike the majority of other cancers, the incidence rates of melanoma are still on the rise and the treatment options currently available are being hindered by resistance, limited response rates and adverse toxicity. We have previously shown that an FDA approved drug leflunomide, used for rheumatoid arthritis (RA), also holds potential therapeutic value in treating melanoma especially if used in combination with the mutant BRAF inhibitor, vemurafenib. We have further characterized the function of leflunomide and show that the drug reduces the number of viable cells in both wild-type and BRAFV600E mutant melanoma cell lines. Further experiments have revealed leflunomide reduces cell proliferation and causes cells to arrest in G1 of the cell cycle. Cell death assays show leflunomide causes apoptosis at treatment concentrations of 25 and 50 µM. To determine if leflunomide could be used combinatorialy with other anti-melanoma drugs, it was tested in combination with the MEK inhibitor, selumetinib. This combination showed a synergistic effect in the cell lines tested. This drug combination led to an enhanced decrease in tumor size when tested in vivo compared to either drug alone, demonstrating its potential as a novel combinatorial therapy for melanoma.

Keywords: MEK inhibitors; combinatorial therapy; leflunomide; melanoma; selumetinib.


Conflict of interest statement

CONFLICTS OF INTEREST The authors declare no potential conflicts of interest.

Figures

Figure 1
Figure 1. Leflunomide reduces the cell viability of melanoma cell lines
(A) Leflunomide causes a dose-dependent decrease in cell viability in eight human melanoma cell lines. BRAFWT cell lines; M202 (blue), M285 (red), M375 (green) and M296 (purple). BRAFV600E mutant cell lines; A375 (orange), M229 (grey), SKmel28 (khaki) and SKmel5 (black). Cell viability was determined by using CellTiter-Glo reagent and all values are represented as a percentage (%) relative to the vehicle control. Data is presented as the mean ± SEM of three independent experiments each performed with cell culture triplicates. (B) Leflunomide reduces cell viability at a similar rate in BRAFWT (wtBRAF) melanoma cells and BRAFV600E mutant (mBRAF) cell lines. The data from the four wildtype cell lines was averaged (black). The same was done for the four BRAFV600E mutant lines (red). Cell viability was determined by using CellTiter-Glo reagent and all values are represented as a percentage (%) relative to the vehicle control. Data is presented as the mean ± SEM of twelve independent experiments each performed with cell culture triplicates. (C) Leflunomide causes a dose-dependent decrease in cell viability in melanocytes, HEK293 and RD1 cells. Melanocytes (black), HEK293 cells (red) and RD1 cells (blue). Cell viability was determined using CellTiter-Glo reagent and all values are represented as a percentage (%) relative to the vehicle control. Data is presented as the mean ± SEM of three independent experiments each performed with cell culture triplicates.
Figure 2
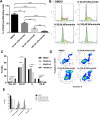
Figure 2. Leflunomide causes a G1 cell cycle arrest in A375 melanoma cells and induces apoptosis
(A) Leflunomide inhibits cell proliferation in A375 cells. Percentage of BrdU positive A375 cells after 72 hours treatment with leflunomide. Data is presented as the mean ± SEM of the three independent experiments each performed with cell culture triplicates. Asterisks indicate the degree of statistical difference determined by one-way ANOVA with Turkey’s post-hoc test. *P ≤ 0.05, **P ≤ 0.01, ***P ≤ 0.001 and ****P ≤ 0.0001. (B) Representative DNA histogram plots of the cell cycle analysis performed in A375 cells treated for 72 hours with leflunomide. (Bi) shows DMSO treated cells. (Bii), (Biii) and (Biv) show cells treated with 25, 50 and 100 μM leflunomide respectively. (C) Leflunomide causes a G1 cell cycle arrest in A375 melanoma cells and induces apoptosis. Cell cycle phase distribution for A375 cells treated for 72 hours with leflunomide. Data is presented as the mean ± SEM of three independent experiments each performed with cell culture triplicates. Asterisks indicate the degree of statistical difference comparing DMSO control to the varying concentrations of Leflunomide using student’s t-tests. *P ≤ 0.05, **P ≤ 0.01, ***P ≤ 0.001 and ****P ≤ 0.0001. (D) Representative pseudo plots of cell death analysis determined by flow cytometry. A375 cells were treated with DMSO, 25, 50 and 100 μM leflunomide for 72 hours and stained with annexin V and PI. The numbers indicate the percentage of cells present in each quadrant. (E) Graph quantifying the percentage of A375 cells that are viable, early apoptotic, late apoptotic and necrotic after 72 hours of treatment with leflunomide. Data is presented as the mean ± SEM of three independent experiments each performed with cell culture triplicate. Asterisks indicate the degree of statistical difference comparing each leflunomide condition to the DMSO control determined by two-way ANOVA with Turkey’s post-hoc test. *P ≤ 0.05, **P ≤ 0.01, ***P ≤ 0.001 and ****P ≤ 0.0001.
Figure 3
Figure 3. MEK inhibition reduces the viability of melanoma cells
(A) Selumetinib caused a dose-dependent decrease in cell viability in eight human melanoma cell lines. Melanoma cell lines include M202 (blue), M285 (red), M375 (green) and M296 (purple), A375 (orange), M229 (grey), SKmel28 (khaki), SKmel5 (black) and melanocytes (pink; open triangle). Cell viability was determined by using CellTiter-Glo reagent and all values are represented as a percentage (%) relative to the vehicle control. Data is presented as the mean ± SEM of three independent experiments each performed in triplicate. (B) Western blot analysis confirming the decrease in phospho-ERK upon treatment with 0.1 or 1 µM selumetinib in A375 and M202 melanoma cell lines in triplicate. The molecular weights are shown on the left. Results for pERK and total ERK (tERK) are from a single experiment representative of three independent experiments. (C) Quantification data from Western blot.
Figure 4
Figure 4. Leflunomide and Selumetinib synergize in melanoma cells
Cell viability plots when different concentrations of Selumetinib and Leflunomide are added to the cells simultaneously. Graph A(i) shows he concentrations of leflunomide along the x-axis. The statistical analysis on this graph compared the combinations of drugs to leflunomide alone. Graph A(ii) shows the concentrations of selumetinib along the x-axis. The statistical analysis on this graph compared the drug combinations to selumetinib alone. All values are represented as a percentage (%) relative to the vehicle control. Data is presented as the mean ± SEM of three independent experiments each performed in triplicate. Asterisks indicate the degree of statistical difference comparing each leflunomide and selumetinib condition to leflunomide alone (graph A(i)) or selumetinib alone (graph A(ii)). Statistical analysis was determined by two-way ANOVA with Turkey’s post-hoc test. *P ≤ 0.05, **P ≤ 0.01, and ****P ≤ 0.0001. (A) Combination index values for M375 melanoma cell line with leflunomide and selumetinib in combination at increasing concentrations. B(i) Along the x-axis is the Fraction Affected (FA) which corresponds to the cell viability data inputted (i.e. what fraction of the cells were affected/how much of the cell viability was being reduced by this combination of leflunomide and selumetinib). Along the y-axis is the CI values. A dotted line placed across the CI value of 1 makes it easier to see if a particular combination of leflunomide or selumetinib was synergistic or not. A CI value of 1 suggests that drug combination is acting additively. A value greater that 1 suggests the drug combination is acting antagonistically and a value below 1 suggests they are working synergistically. The closer the value to 0 the stronger the synergism. B(ii) This graph utilises the CI value data with the CI values again shown along the y–axis but along the x-axis is the concentration of selumetinib with the data sets on the graph corresponding to the leflunomide concentrations. The degree of synergism increases with increasing concentrations of leflunomide. The Synergy graphs for the other melanoma lines tested are shown in Supplementary Figure 5.
Figure 5
Figure 5. The combination of Leflunomide and Selumetinib reduces tumor growth in vivo
(A) SCID mice xenotransplanted with human melanoma cells (M375; 3 × 10⁶/animal, subcutaneous injection) until tumors were palpable (4-weeks post implantation), were treated daily with leflunomide/selumetinib as individual drugs or in combination as indicated for 12 days. A control arm was also included where comparable vehicle only treatments were administered. Tumor volumes were measured at 4 time-points (T1–T4) during the 12-day treatment period as indicated. I.P., intraperitoneal. O.G., oral gavage. (B) The combination of leflunomide and selumetinib reduced the average tumor volume greater than either drug alone. Data is presented as the mean ± SD of one independent experiment. Statistical analysis compares either drug alone to them in combination determined by two-way ANOVA with Turkey’s post-hoc test. *P ≤ 0.05, **P ≤ 0.01, ***P ≤ 0.001 and ****P ≤ 0.0001. (C) The combination of leflunomide and selumetinib reduced tumor weight greater than either drug alone. Data is presented as the mean ± SD of one independent experiment. Asterisks indicate the degree of statistical difference comparing the combination of leflunomide and selumetinib to each drug alone determined by unpaired student t-test. *P ≤ 0.05, **P ≤ 0.01, ***P ≤ 0.001 and ****P ≤ 0.0001. (D) Visualisation of the excised tumors from the xenograft study.

Similar articles

Cited by

References

    1. Ward EM, Thun MJ, Hannan LM, Jemal A. Interpreting cancer trends. Ann N Y Acad Sci. 2006;1076:29–53. - PubMed
    1. Bandarchi B, Ma L, Navab R, Seth A, Rasty G. From melanocyte to metastatic malignant melanoma. Dermatol Res Pract. 2010;2010 - PMC - PubMed
    1. Hodi FS, O’Day SJ, McDermott DF, Weber RW, Sosman JA, Haanen JB, Gonzalez R, Robert C, Schadendorf D, Hassel JC, Akerley W, van den Eertwegh AJ, Lutzky J, et al. Improved survival with ipilimumab in patients with metastatic melanoma. N Engl J Med. 2010;363:711–723. - PMC - PubMed
    1. Robert C, Schachter J, Long GV, Arance A, Grob JJ, Mortier L, Daud A, Carlino MS, McNeil C, Lotem M, Larkin J, Lorigan P, Neyns B, et al. Pembrolizumab versus Ipilimumab in Advanced Melanoma. N Engl J Med. 2015;372:2521–2532. - PubMed
    1. Larkin J, Chiarion-Sileni V, Gonzalez R, Grob JJ, Cowey CL,Lao CD, Schadendorf D, Dummer R, Smylie M, Rutkowski P, Ferrucci PF, Hill A, Wagstaff J, et al. Combined Nivolumab, Ipilimumab or Monotherapy in Untreated Melanoma. N Engl J Med. 2015;373:23–34. - PMC - PubMed