

Nucleoside reverse transcriptase inhibitor-induced rat oocyte dysfunction and low fertility mediated by autophagy
- PMID: 29423092
- PMCID: PMC5790509
- DOI: 10.18632/oncotarget.23243
Nucleoside reverse transcriptase inhibitor-induced rat oocyte dysfunction and low fertility mediated by autophagy
Abstract
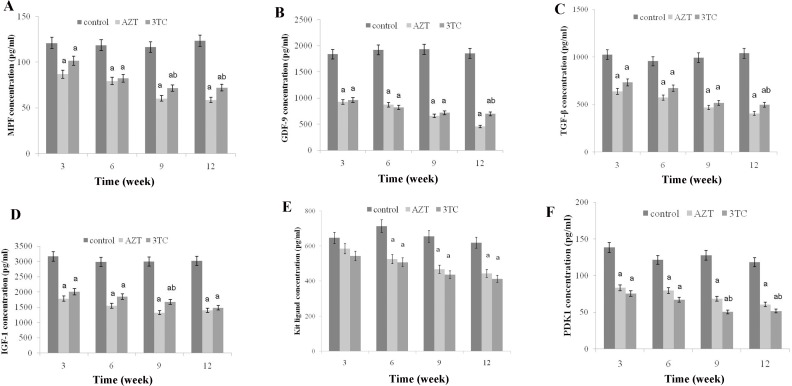
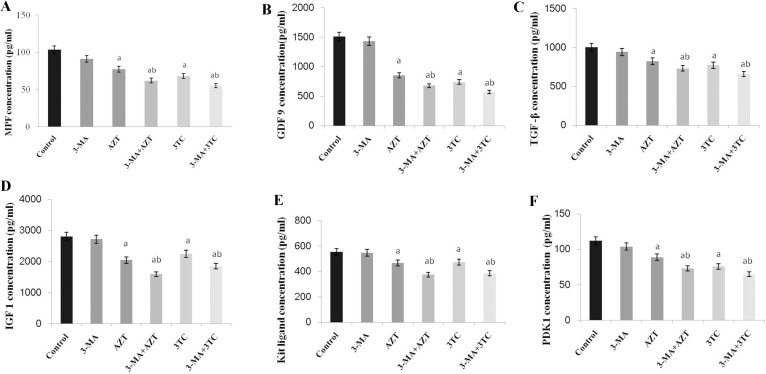
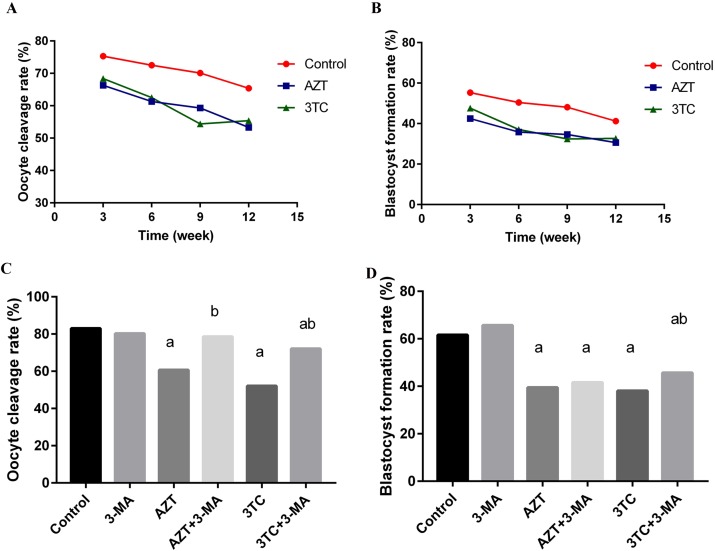
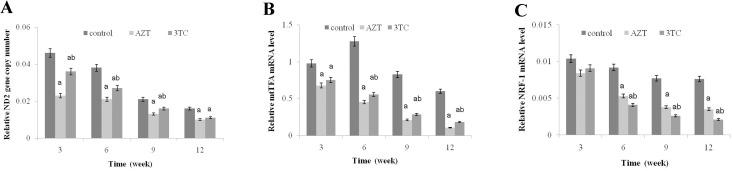
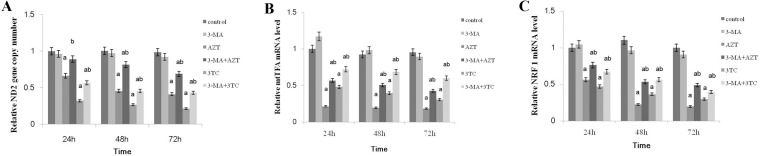
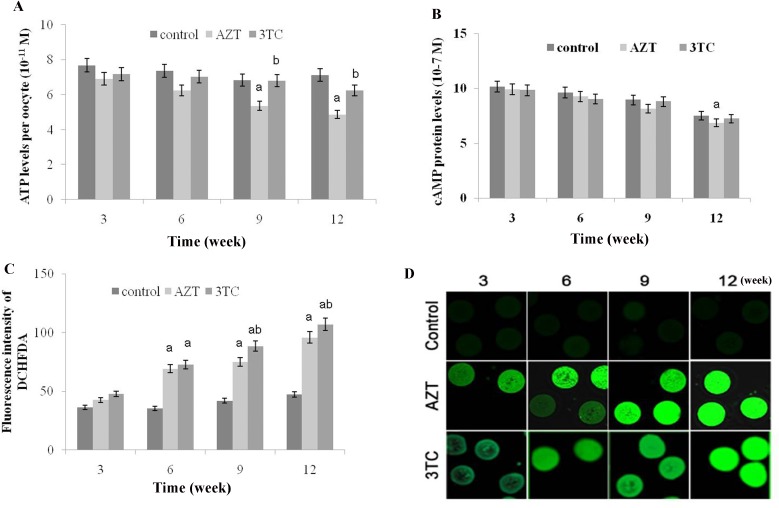
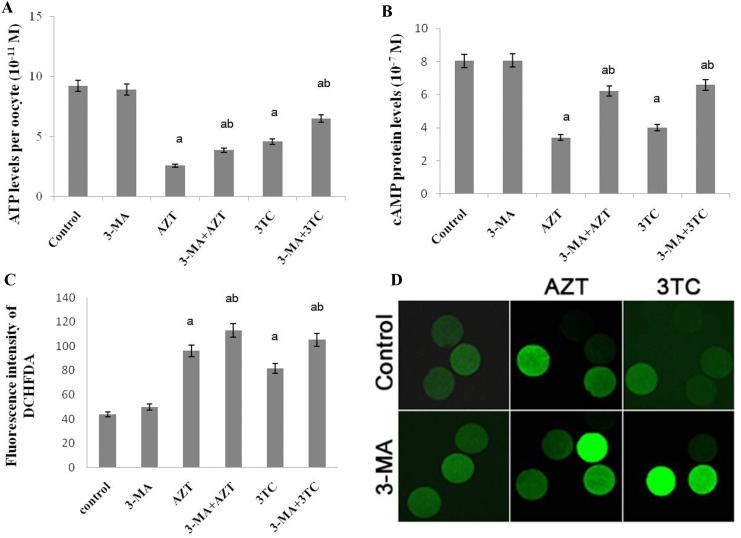
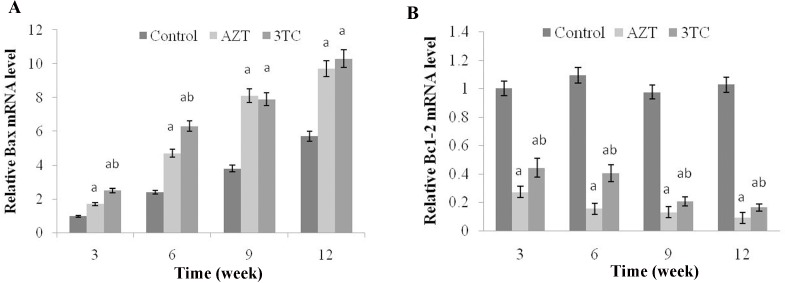
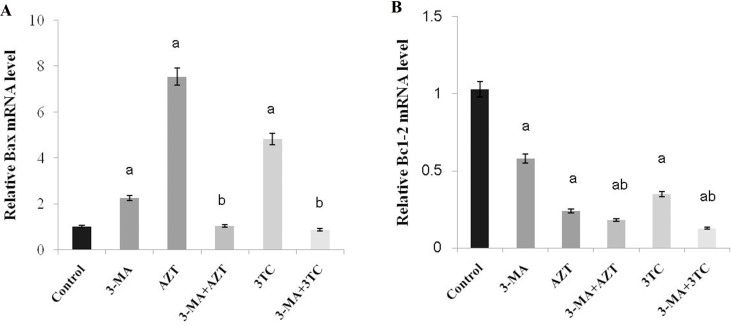
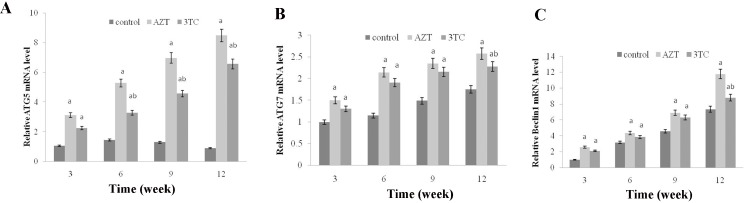
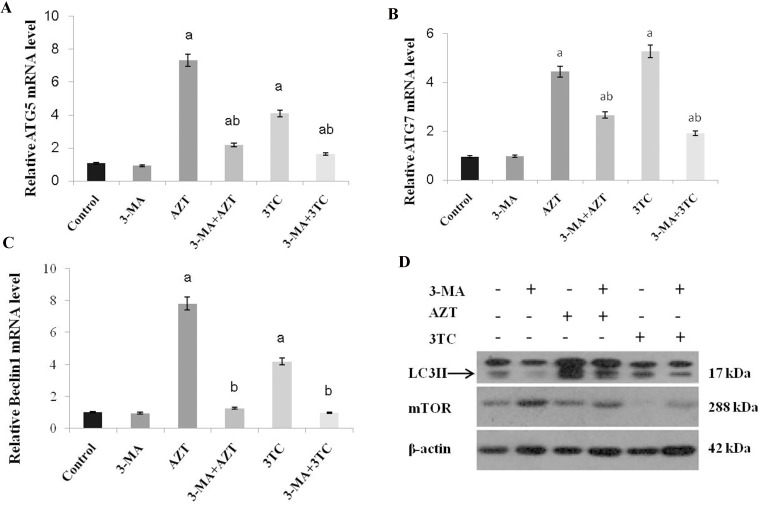
Low fertility is one of the most common side effects caused by nucleoside reverse transcriptase inhibitors (NRTIs), whereas the molecular mechanism underlying this process were largely unclear. This study was conducted to investigate whether autophagy plays a role in NRTIs-induced oocyte dysfunction and low fertility in female rat. Both in vivo and in vitro experiments were conducted. For the in vivo experiment, female adult Sprague-Dawley rats were subjected to zidovudine (AZT) and lamivudine (3TC) intragastric treatment for 3, 6, 9, and 12 weeks; a control was also set. Oocytes were collected for maturation evaluation, in vitro fertilization and mitochondrial function assays, and apoptosis and autophagy analysis. For the in vitro experiment, oocytes were collected and assigned to the control, 3-methyladenine (3-MA, an effective autophagy inhibitor), AZT, AZT+3-MA, 3TC, and 3TC+3-MA groups. The oocytes were cultured with the abovementioned drugs for 24, 48, and 72 h and then, subjected to the same assays as in the in vivo study. The results showed a significant time-dependent decrease in oocyte maturation-related maker levels, oocyte cleavage rate, blastocyst formation rate, mitochondrial DNA copy number and adenosine triphosphate level, and apoptosis, and a significant increase in the reactive oxygen species levels (all P-values < 0.05), in both the in vivo and the in vitro experiments. These changes, except for the changes in the oocyte maturation-related markers, were partially attenuated by 3-MA. In conclusion, we demonstrated that NRTIs can cause rat oocyte dysfunction and low fertility, and this damage was, at least partially, mediated by autophagy.
Keywords: NRTIs; low fertility; mitochondrial toxicity, autophagy.
Conflict of interest statement
CONFLICTS OF INTEREST None.
Figures
Similar articles
-
Nucleoside reverse transcriptase inhibitors (NRTIs)-induced expression profile of mitochondria-related genes in the mouse liver.Mitochondrion. 2008 Mar;8(2):181-95. doi: 10.1016/j.mito.2008.01.002. Epub 2008 Feb 1. Mitochondrion. 2008. PMID: 18313992
-
Mitochondrial toxicity in hearts of CD-1 mice following perinatal exposure to AZT, 3TC, or AZT/3TC in combination.Environ Mol Mutagen. 2007 Apr-May;48(3-4):190-200. doi: 10.1002/em.20191. Environ Mol Mutagen. 2007. PMID: 16395692
-
Transplacentally exposed human and monkey newborn infants show similar evidence of nucleoside reverse transcriptase inhibitor-induced mitochondrial toxicity.Environ Mol Mutagen. 2007 Apr-May;48(3-4):201-9. doi: 10.1002/em.20201. Environ Mol Mutagen. 2007. PMID: 16538687
-
Effect of nucleoside and nucleotide analog reverse transcriptase inhibitors on cell-mediated immune functions.AIDS Res Hum Retroviruses. 2011 Jan;27(1):47-55. doi: 10.1089/aid.2010.0067. Epub 2010 Oct 7. AIDS Res Hum Retroviruses. 2011. PMID: 20929390
-
Pharmacology of nucleoside and nucleotide reverse transcriptase inhibitor-induced mitochondrial toxicity.Clin Ther. 2000 Jun;22(6):685-708. doi: 10.1016/S0149-2918(00)90004-3. Clin Ther. 2000. PMID: 10929917 Review.
Cited by
-
Histopathological changes in Oreochromis mossambicus (Peters, 1852) ovaries after a chronic exposure to a mixture of the HIV drug nevirapine and the antibiotics sulfamethoxazole and trimethoprim.Chemosphere. 2021 Jul;274:129900. doi: 10.1016/j.chemosphere.2021.129900. Epub 2021 Feb 9. Chemosphere. 2021. PMID: 33979944 Free PMC article.
-
The neglected part of early embryonic development: maternal protein degradation.Cell Mol Life Sci. 2020 Aug;77(16):3177-3194. doi: 10.1007/s00018-020-03482-2. Epub 2020 Feb 24. Cell Mol Life Sci. 2020. PMID: 32095869 Free PMC article. Review.
-
Antiretroviral Drugs Impact Autophagy with Toxic Outcomes.Cells. 2021 Apr 15;10(4):909. doi: 10.3390/cells10040909. Cells. 2021. PMID: 33920955 Free PMC article. Review.
References
-
- Clumeck N, Pozniak A, Raffi F, Committee EE. European AIDS Clinical Society (EACS) guidelines for the clinical management and treatment of HIV-infected adults. HIV Med. 2008;9:65–71. - PubMed
-
- Maiese EM, Johnson PT, Bancroft T, Goolsby Hunter A, Wu AW. Quality of life of HIV-infected patients who switch antiretroviral medication due to side effects or other reasons. Curr Med Res Opin. 2016;32:2039–46. - PubMed
-
- Chattopadhyay K, Aldous C. A brief review on human mtDNA mutations and NRTI-associated mtDNA toxicity and mutations. Mitochondrial DNA Part A, DNA mapping, sequencing, and analysis. 2016;27:1685–7. - PubMed
LinkOut - more resources
Full Text Sources
Other Literature Sources
