Review
. 2018 Feb;8(1):10.1128/ecosalplus.ESP-0009-2017.
doi: 10.1128/ecosalplus.ESP-0009-2017.

Pathogenesis of Proteus mirabilis Infection

Affiliations
Review

Pathogenesis of Proteus mirabilis Infection

Chelsie E Armbruster et al. EcoSal Plus. 2018 Feb.

Abstract

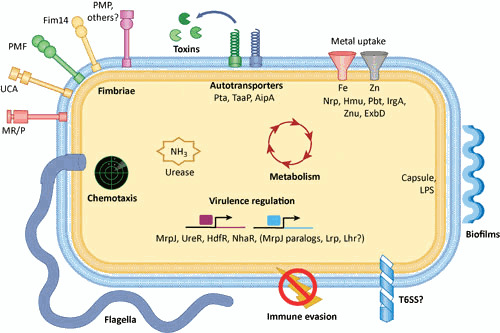
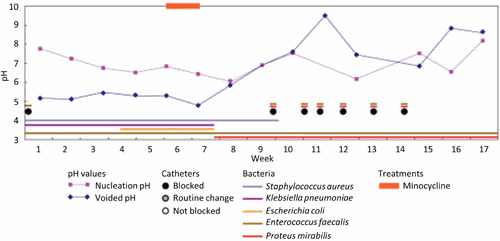
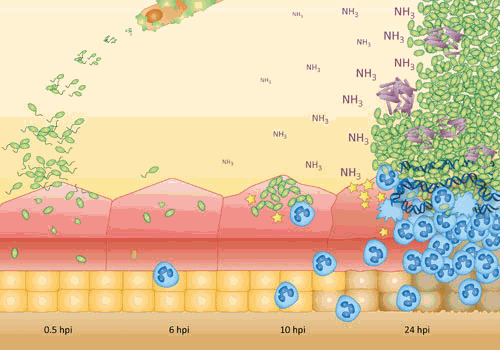
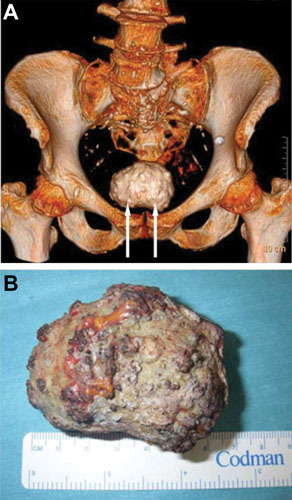
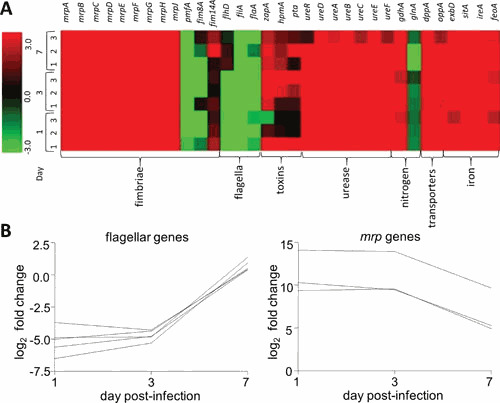
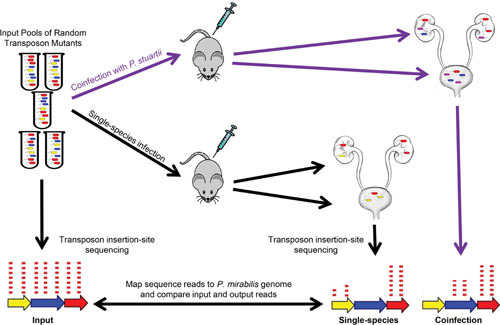
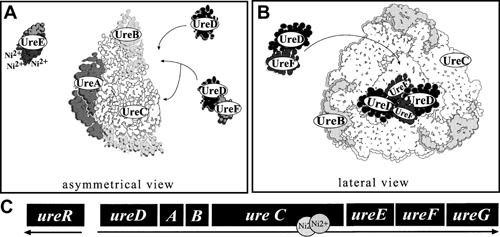
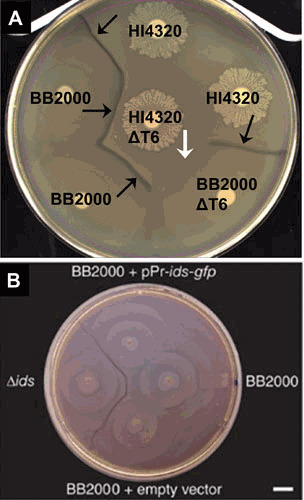
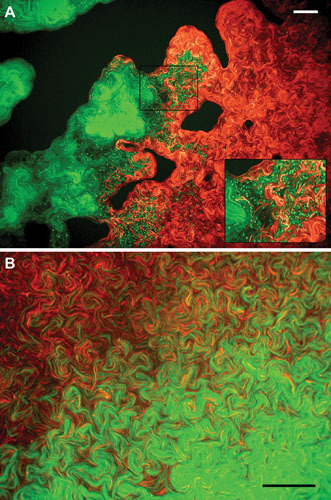
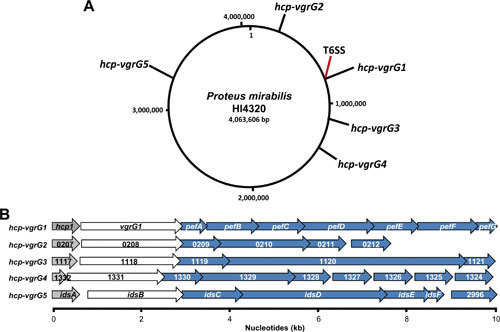
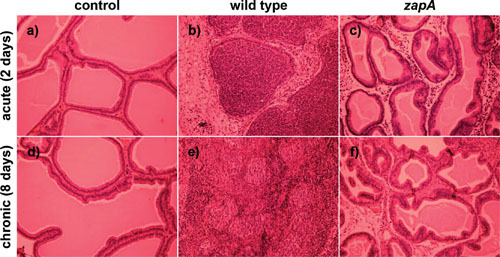
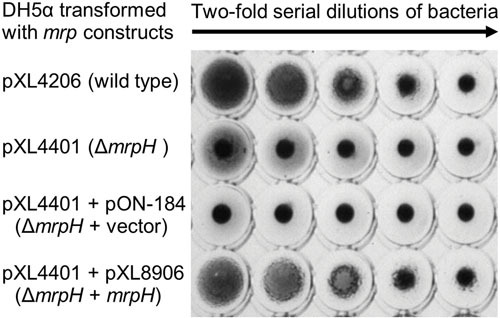
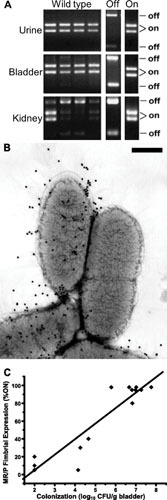
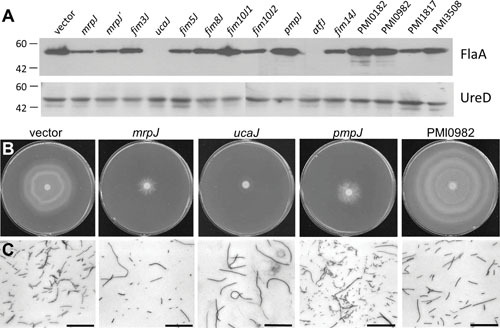
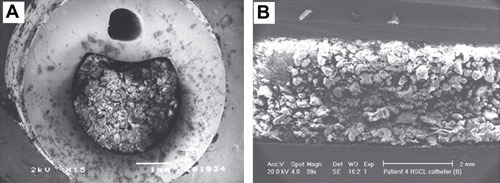
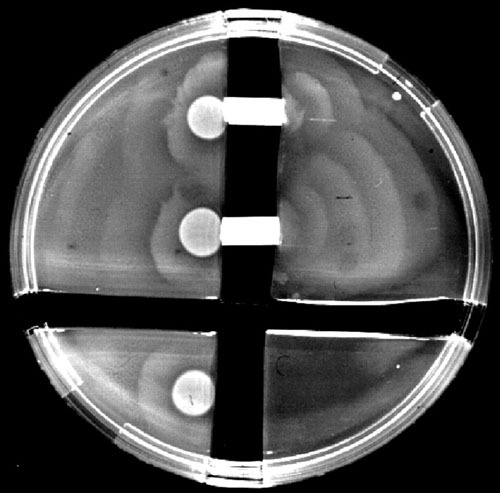
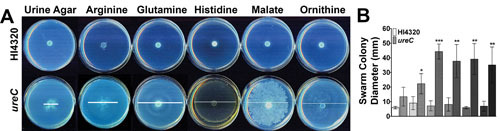
Proteus mirabilis, a Gram-negative rod-shaped bacterium most noted for its swarming motility and urease activity, frequently causes catheter-associated urinary tract infections (CAUTIs) that are often polymicrobial. These infections may be accompanied by urolithiasis, the development of bladder or kidney stones due to alkalinization of urine from urease-catalyzed urea hydrolysis. Adherence of the bacterium to epithelial and catheter surfaces is mediated by 17 different fimbriae, most notably MR/P fimbriae. Repressors of motility are often encoded by these fimbrial operons. Motility is mediated by flagella encoded on a single contiguous 54-kb chromosomal sequence. On agar plates, P. mirabilis undergoes a morphological conversion to a filamentous swarmer cell expressing hundreds of flagella. When swarms from different strains meet, a line of demarcation, a "Dienes line," develops due to the killing action of each strain's type VI secretion system. During infection, histological damage is caused by cytotoxins including hemolysin and a variety of proteases, some autotransported. The pathogenesis of infection, including assessment of individual genes or global screens for virulence or fitness factors has been assessed in murine models of ascending urinary tract infections or CAUTIs using both single-species and polymicrobial models. Global gene expression studies performed in culture and in the murine model have revealed the unique metabolism of this bacterium. Vaccines, using MR/P fimbria and its adhesin, MrpH, have been shown to be efficacious in the murine model. A comprehensive review of factors associated with urinary tract infection is presented, encompassing both historical perspectives and current advances.


Figures

Figure 1
Figure 1
Concepts of Proteus mirabilis pathogenesis during urinary tract infection (UTI). Adherence: binding catheters, host tissues, and neighboring bacteria may all contribute to disease. Adherence is mediated by chaperone-usher fimbriae and autotransporter adhesins. Urease: involved in stones, crystalline biofilms, and possibly nutrition or host sensing. Motility: P. mirabilis swarms across catheters and may ascend to the kidneys using swimming motility. Both forms of motion are mediated by flagella. Chemotaxis proteins allow the bacteria to follow chemical gradients. Metabolism: likely permits establishment of a nutritional niche, competition with other species, and response to host cues. Metal scavenging: iron and zinc uptake are essential for growth, but are sequestered by the host; therefore, specialized proteins are required for bacteria to scavenge these metals. Toxins: proteins such as HpmA and Pta may aid in nutrient accessibility, immune evasion, or provision of surfaces to colonize. Biofilm formation: Crystalline biofilms readily form on catheters, and bacterial clusters in the bladder may be a biofilm-mediated process. Immune evasion: this can include antibody and antimicrobial peptide degradation, polymyxin resistance, lipopolysaccharide (LPS) variation, and physical obstruction of phagocytosis. Virulence regulation: required to coordinate all steps of infection. Type 6 secretion system (T6SS): involved in self-recognition; unknown role during UTI. MrpJ-controlled systems in this figure are bolded. Figure adapted, with permission, from reference .
Figure 2
Figure 2
Treatments, nucleation pH, voided pH, catheter changes, and bacterial isolates in a patient undergoing long-term urinary catheterization. Colonization occurred with multiple species, but P. mirabilis colonization specifically led to an increase in urinary pH and repeated catheter blockage. Figure adapted, with permission, from reference .
Figure 3
Figure 3
Lifestyle of Proteus mirabilis. P. mirabilis bacteria (green) form crystalline biofilms on the surface of catheters (Top). Once inside the bladder (0.5–6 h postinfection [hpi]), this organism can invade urothelial cells of the bladder. As early as 10 to 24 hpi, P. mirabilis forms intraluminal clusters that can extend the length of the bladder and are associated with urothelial cell destruction (perhaps through the production of toxins [yellow stars] or an increase in urine pH) and mineral deposition (purple rods). Host innate immune cells such as neutrophils (blue) are recruited to the site of infection and can form NETs (neutrophil extracellular traps). Figure adapted, with permission, from reference .
Figure 4
Figure 4
A particularly large urolith. (A) Reconstructed computed tomography image, showing the location and relative size of the urate cystolith (indicated by arrows). (B) Photograph of the urate cystolith, showing its absolute size. Reproduced from reference with permission.
Figure 5
Figure 5
P. mirabilis extracellular clusters are precursors to stone formation. (A and B) Detection of mineral deposition using Alizarin Red staining of P. mirabilis-infected bladder sections at 6 (A) and 24 hpi (B) (scale bars, 100 μm). L, bladder lumen; purple staining indicates extracellular cluster. (C) A representative image of a P. mirabilis cluster at 24 hpi (scale bar, 100 μm). Staining of bacteria (green), UPIIIa (red), and DNA (blue) shows accumulation of bacterial clusters at the bacteria-bladder interface. An asterisk indicates an extracellular cluster; L, bladder lumen. The thin arrow indicates a region with increased 4′,6-diamidino-2-phenylindole (DAPI) signal, whereas thick arrows indicate areas of extensive urothelial damage. (D and E) Scanning electron micrographs of P. mirabilis urease-induced bladder stone (7 dpi). (D) One-quarter of the bladder viewed at a low magnification (bar, 500 μm). The orientation of the bladder is indicated by an arrow pointing to the inferior end of the bladder (the end leading to the urethra). (E) Higher magnification (bar, 5 μm) of the area enclosed in a box in panel D. Figure adapted, with permission, from reference (A–C) and reference (D and E).
Figure 6
Figure 6
P. mirabilis invades the urothelium, but infrequently forms intracellular bacterial communities (IBCs). (A–D) Representative images of P. mirabilis (A and B) and uropathogenic E. coli (UPEC) (C and D) attachment and invasion. Bacteria (green), UPIIIa (red), and DNA (blue) show localization of the bacteria relative to the apical surface of the urothelium. Scale bars, 10 μm. (B and D) A regional view of the bladder section containing the 10 hpi IBC shown in A and C, respectively. Scale bars, 100 μm. L, bladder lumen. (E and F) Quantification of P. mirabilis (E) and UPEC (F) bladder invasion at 0.5 hpi following either ex vivo gentamicin treatment (Gent) or mock treatment (Mock) (n = 6–8). *P < 0.05. Figure adapted, with permission, from reference .
Figure 7
Figure 7
P. mirabilis induces neutrophil recruitment and NET formation. (A and B) Visualization of neutrophil recruitment at extracellular clusters at 24 hpi. Individual channels for the region enclosed in the dashed rectangle are shown below at the same magnification. Scale bars, 100 μm. (C) Identification of NET formation in regions of neutrophil recruitment at 24 hpi. Individual channels representing nuclear stains (H2A and DAPI) and membrane stains (Ly6G) show the overlap of DAPI and H2A distant from Ly6G staining. Scale bars, 10 μm. (D) Neutrophil phagocytosis of P. mirabilis at 24 hpi. Arrows indicate neutrophils that have phagocytosed bacteria. (E) Individual neutrophil recruitment in sections of murine bladders infected with P. mirabilis without clusters at 24 hpi and UPEC-infected sections at 10 hpi. Bacteria (green), Ly6G (red), and DNA (blue) show neutrophils adjacent to bacteria. Arrows indicate intact neutrophils. Figure adapted, with permission, from reference .
Figure 8
Figure 8
Real-time monitoring of P. mirabilis UTI using biophotonic imaging. Mice were inoculated with a P. mirabilis strain, Xen 44, engineered to constitutively produce luciferase. A representative animal is shown. Bacteria were initially observed in the bladder (ventral view), with kidney progression visible by day 2 (dorsal view). Figure adapted, with permission, from reference .
Figure 9
Figure 9
Example of a competitive index (CI) calculated from a cochallenge CAUTI experiment. Mice were challenged with a 1:1 ratio of wild-type P. mirabilis HI4320 and a lon mutant; a 4mm segment of catheter tubing was retained in the bladder for the duration of the study. P. mirabilis was recovered at 4 days postinoculation (dpi). Wild-type and mutant bacteria were distinguished by plating on solid media with or without antibiotic selection. (A) Cochallenge data. Solid circles represent wild-type CFU, and open squares are mutant CFU recovered from each mouse. Bars show median CFU. The limit of detection in this assay is 200 CFU/g tissue. (B) In vivo CIs calculated from cochallenge data. Each dot represents the CI from an individual animal in the urine (U), bladder (B), kidneys (K), or spleen (S). Bars indicate the median CI. Significant differences in colonization (*P<0.05) were determined with the Wilcoxon signed-rank test. A CI <1 indicates a fitness defect. Figure adapted, with permission, from reference .
Figure 10
Figure 10
Conservation of P. mirabilis sequences. (A) Comparison of proteomes of three P. mirabilis strains against the HI4320 type strain using the PATRIC Proteome Comparison service (120). The majority of predicted proteins are ≥99% identical across all four genomes (blue and purple). Notable highly variable proteins (≤70% identical; orange and red) are indicated with arrows. (B) Genome alignment showing synteny (red) between P. mirabilis HI4320 and BB2000. The largest gaps are ICEPm1, a conjugative transposon, and phage. Most blue lines indicate highly repetitive transposase genes. Plot generated using the Artemis Comparison Tool (346).
Figure 11
Figure 11
Conservation of fimbriae encoded by P. mirabilis. The percentage of isolates with each fimbria is shown. For the six sequenced strains, fimbriae were identified using BLAST using the HI4320 fimbrial major structural subunit gene as the query. For the 1980s (n = 10) and hospital isolates (n = 48), fimbrial genes were detected by PCR. Reproduced from reference , with permission.
Figure 12
Figure 12
T6SS effector operons are highly variable. The T6SS effector operon immediately adjacent to the conserved T6SS secretion apparatus operon is depicted for P. mirabilis HI4320 (top) and BB2000 (bottom). The HI4320 locus, called pef for primary effector operon, comprises PMI0750-0758, and the BB2000 locus, called idr for identity recognition, comprises BB2000_0822-0826. The proteins encoded by the first gene (red) and the first 596 amino acids of the second gene (orange) are 99% identical, but the remaining ∼130 amino acids of the encoded proteins share no homology. The rest of the operons are not homologous (black). A portion of IdrD shares identity with PMI0761, which is not part of the pef operon. The scale at the top is in nucleotides.
Figure 13
Figure 13
P. mirabilis gene expression during experimental UTI. (A) Heat map of expression data for specific virulence-associated genes, depicting the ratio of expression in LB broth versus in vivo. The legend at the left indicates the color associated with log2 fold change: red, upregulated in vivo; green, downregulated in vivo; black, not differentially regulated. (B) Adherence and motility genes are inversely regulated during UTI. Each line represents fold change of a specific flagellar (left panel) or fimbrial (right panel) gene in vivo relative to mid-logarithmic phase culture in vitro. Genes in the mrp operon are highly induced early during infection, but expression falls by 7 days postinfection. Flagellar genes are initially repressed, but expression increases late in infection. Figure adapted, with permission, from reference .
Figure 14
Figure 14
Integration of the urease suicide plasmid into the chromosome of P. mirabilis HI4320 by homologous recombination. E. coli SM10 λ pir (Kanr), carrying transfer genes integrated into its chromosome, was used to mobilize pBSJ102 (Apr) into P. mirabilis HI4320. Integration of pBDJ102 into the chromosome was selected on medium containing tetracycline and ampicillin. Transconjugants (Apr Tetr) were urease negative. Bla, β-lactamase; C, ClaI; Ei, EcoRI; Ev, EcoRV; H, HindIII; N, NruI; P, PvuI. The 1.5-kb HindIII fragment of ureC (solid), a 277-bp deletion (striped), and chromosomal urease gene sequences (open) are shown. Adapted from reference , with permission.
Figure 15
Figure 15
Conceptual model of single-species and polymicrobial CAUTI Tn-Seq. For each of five transposon mutant library pools, mice were infected as follows: (i) 5–10 CBA/J mice were transurethrally inoculated with 1×10⁵ CFU of the transposon library for single-species infection, and (ii) 5–10 CBA/J mice were inoculated with 1×10⁵ CFU of a 1:1 mixture of the transposon library and wild-type P. stuartii BE2467 (purple) for coinfection. Thus, for each input pool, the single-species infections and coinfections were conducted in parallel to utilize the same input inoculum. Input and output samples were enriched for transposon-containing sequences and subjected to next-generation Illumina sequencing of the transposon-chromosome junctions. The resulting reads were mapped to the P. mirabilis genome, and the abundance of reads at each insertion site from all output samples were compared with the input samples to determine a fold change for each gene. The gene in yellow represents a candidate P. mirabilis fitness factor for single-species CAUTI that is even more important during coinfection; the gene in blue represents a P. mirabilis fitness factor for single-species CAUTI that is no longer important during coinfection; the gene in red represents a factor that does not contribute to P. mirabilis CAUTI and was therefore recovered at a similar density from the infection output pools as the input pools. Reproduced from reference , with permission.
Figure 16
Figure 16
Model of P. mirabilis urease interactions with structural and accessory proteins based on yeast two-hybrid experiments. The three-dimensional structure of urease, inferred from the closely related urease of Klebsiella aerogenes. (A) UreD associates with UreC in the context of the apourease independently of the UreA structural protein. Although UreD and UreF interact in the absence of structural proteins, UreD is still capable of associating with the apourease without coaccessory proteins such as UreF. (B) A single molecule of UreD associated with UreABC may interact with additional UreD molecules bound to adjacent UreABC heterotrimers. These interactions could stabilize the accessory protein interactions with the apourease and hypothetically coordinate nickel uptake among the three active sites of urease. A similar hypothesis applies to UreF; homomultimeric UreF interactions in vivo could occur between individual UreF molecules bound through UreD to adjacent UreABC heterotrimers. (C) The 6,500-bp P. mirabilis urease gene cluster encodes eight proteins that comprise, regulate, and assemble the urease homoenzyme. Figure adapted, with permission, from reference .
Figure 17
Figure 17
Contact-dependent preemptive antagonism is dependent on the T6SS. (A) A Dienes line (black arrows) forms between two different wild-type isolates, HI4320 and BB2000 (strain A and B kill each other). Loss of the T6SS (ΔT6) in either isolate by disruption of PMI0742 does not affect the discriminatory Dienes line (strain A kills strain B or strain B kills strain A). Loss of the T6SS in both isolates allows nonidentical swarms to merge, and the lack of T6SS-dependent killing appears as recognition (white arrow). (B) Swarm plate of the wild-type strain BB2000, BB2000 idsABCDEF deletion mutant (Δids), and BB2000 with the idsA-gfp vector pKG100 (labeled pPr-ids-gfp) or with an empty vector. A visible boundary formed between swarms of the wild type and the deletion mutant. Swarms of the wild type merged regardless of the presence of pKG100. Scale bar = 1 cm. Figure adapted, with permission, from reference (A) and reference (B).
Figure 18
Figure 18
Incompatible Dienes types have distinctive reactions when swarming colonies meet. (A) A P. mirabilis strain expressing red fluorescent protein (DsRed) (2R) intersecting with a strain expressing green fluorescent protein (GFP) (3G). Strain 3G produces round cells, whereas strain 2R produces no round cells. The dark areas are agar with no growth. Magnification, ×400. (Inset) Intersection and rounded cells in more detail (magnification, ×800). (B) Intersection zone for strain 2 expressing either GFP or DsRed (2G and 2R) without boundary formation or rounded cells (magnification, ×1,000). Scale bars = 50 μm. Figure adapted, with permission, from reference .
Figure 19
Figure 19
The P. mirabilis HI4320 genome contains one primary and four orphan hcp-vgrG effector operons that are expressed during swarming. (A) A circular representation of the P. mirabilis HI4320 genome depicting the location of the primary hcp-vgrG effector operon (hcp-vgrG1), divergent T6SS, and the four orphan hcp-vgrG effector operons (hcp-vgrG2-5). (B) PMI0750 to PMI0758 encode the primary hcp-vgrG1 effector operon (pef) adjacent to the T6SS operon; PMI0207 to PMI0212 encode the hcp-vgrG2 effector operon; PMI1117 to PMI1121 encode the hcp-vgrG3 effector operon; PMI1332 to PMI1324 encode the hcp-vgrG4 effector operon; and PMI2990 to PMI2996 are the ids operon (hcp-vgrG5). Genes with homology to hcp (gray), vgrG (white), and predicted T6SS effectors (blue) are shown. Reproduced from reference , with permission.
Figure 20
Figure 20
HpmA265 crystallographic dry dimer interface leads to a filamentous appearance. Solid lines represent hydrogen bonds shared between β23 strands of both subunits. Reproduced from reference , with permission.
Figure 21
Figure 21
Tissue histology of acute and chronic P. mirabilis prostate infections. (a to c) Hematoxylin and eosin-stained rat prostate sections, showing the typical appearance of saline-treated controls (a) and WT (b)- and ZapA mutant (c)-infected prostate tissue in acute infection. (d to f) Histology of chronic infection for saline controls (d), WT infection (e), and ZapA mutant infection (f). Reproduced from reference with permission.
Figure 22
Figure 22
Characteristics of ICEPm1. (A) Modular structure of ICEPm1. Modules in yellow represent core modules; variable regions are depicted in gray. Direct repeats (DRs) are represented as triangles. (B) G+C content of ICEPm1 and the flanking chromosome. Boundaries of ICEPm1 are denoted by vertical black lines. Horizontal lines represent G+C content, with the middle line representing 39% G+C (that of the P. mirabilis HI4320 genome). DRs show the modularity of the island and suggest the evolutionary history of acquisition of regions of ICEPm1. Reproduced from reference , with permission.
Figure 23
Figure 23
Mannose-resistant hemagglutination (MRHA) patterns of MR/P fimbriae expressed in E. coli. E. coli DH5α expressing the entire mrp operon under its native promoter (mrpA-J) (pXL4206), mrp minus mrpH and mrpJ (“ΔmrpH”; pXL4401), ΔmrpH plus empty vector (pON-184), or ΔmrpH plus complemented mrpH (pXL8906) were cultured in Luria broth at 37°C and mixed with chicken erythrocytes. MRHA only occurs when MR/P tip adhesin MrpH is present. Figure adapted, with permission, from reference .
Figure 24
Figure 24
Phase variation of P. mirabilis MR/P fimbriae. (A) Urine, bladder and kidney samples were collected at 7 dpi from mice infected with wild-type P. mirabilis HI4320, an MR/P locked-off mutant or an MR/P locked-on mutant and subjected to the invertible element (IE) assay. (B) Electron micrograph showing the phase variation of MR/P fimbrial expression in a broth culture of P. mirabilis. MrpH, the tip adhesin of MR/P fimbriae, is immunogold labeled. Note that the top left bacterium is gold labeled, while the top right bacterium is unlabeled. Scale bar, 500 nm. (C) Correlation between MR/P fimbrial expression and bacterial colonization in the bladder. Bladders from mice challenged with P. mirabilis HI4320 were collected at 7 dpi, and bacteria were both quantitatively cultured and subjected to the IE assay. A positive correlation was found between MR/P fimbrial expression (percentage of IE in the ON orientation; y axis) and bacterial colonization in the bladder (log10 CFU/g tissue; x axis): y = 17x − 30, r2 = 0.9, n = 18, P < 0.0001. Figure adapted, with permission, from reference (A) and reference (B and C).
Figure 25
Figure 25
P. mirabilis mrpA mutant is defective in cluster formation. (A–D) Representative sections of (A and B) P. mirabilis wild-type and (C and D) mrpA-infected murine bladders at 24 hpi. (A and C) The wild-type-infected bladder shows a regional view of clusters, whereas the mutant-infected bladder shows a close-up of the urothelial surface. Bacteria are in green, UPIIIa in red, and DAPI in blue. (Scale bars, in micrometers, are as marked.) (B and D) Alizarin Red staining of bladder sections. Only wild-type P. mirabilis-infected bladders contain significant mineral deposition. L, bladder lumen; an asterisk indicates an extracellular cluster. Arrows indicate regions with increased DAPI signal. (E and F) Scanning electron micrographs of MR/P ON and MR/P OFF cells colonizing the murine bladder at 4 dpi. MR/P ON colonized the bladder uroepithelium (E), while MR/P OFF colonized the lamina propria where bladder cells had sloughed off (F). Bars = 10 μm (E), 2 μm (F). Figure adapted, with permission, from reference (A–D) and reference (E and F).
Figure 26
Figure 26
MR/P and PMF fimbriae have additive roles in urinary tract infection. Virulence of wild-type P. mirabilis Pr2921 (wt), single fimbrial mutants (mrpA-D or pmfA), and double mrpA-D pmfA mutant was assessed in an ascending UTI model in mice at 7 dpi. (A and B) Independent challenge. The double mutant is significantly less fit compared with either single mutant. (A) CFU recovered per kidney. (B) CFU recovered per bladder. (C and D) Mice were challenged with a 1:1:1 mixture of three strains (trichallenge). (C) Trichallenge with wt, mrpA-D, and mrpA-D pmfA double mutant. (D) Trichallenge with wt, pmfA, and mrpA-D pmfA double mutant. Each dot represents the log10 CFU recovered from each organ. The median (horizontal bar) is indicated for each group. The range of detection in this assay is 102 to 109 CFU per organ. Figure adapted, with permission, from reference .
Figure 27
Figure 27
MR/P and ATF expression during ascending UTI. (A and B) Phase-locked mutants express MR/P fimbriae (MR/P ON) (A) or do not express MR/P fimbriae (MR/P OFF) (B) during experimental UTI at 2 dpi. Green, GFP-expressing P. mirabilis; blue, DAPI-stained bladder cell nuclei; red, rabbit anti-MrpA reacted with goat anti-rabbit IgG conjugated to Alexa Fluor 568; yellow, colocalization of bacteria and MR/P. (C and D) MR/P ON does not express ATF (C), but MR/P OFF does (D). Green, GFP-expressing P. mirabilis; blue, DAPI-stained bladder cell nuclei, red, rabbit anti-ATF serum reacted with goat anti-rabbit IgG conjugated to Alexa Fluor 568; yellow, colocalization of bacteria and ATF. Bars = 10 μm. Reproduced from reference , with permission.
Figure 28
Figure 28
Elevated expression of MrpJ in P. mirabilis inhibits motility due to reduced flagella production. The three strains assayed here are P. mirabilis HI4320 transformed with pLX3607 (vector), pLX3805 (+MrpJ), and pLX5401 (ΔmrpJ). (A) The three strains were assayed for swarming on 1.5% Luria agar and for swimming in 0.35% Luria agar. (B) Three overnight Luria broth cultures of each of the three strains were adjusted to the same optical density, and equal volumes processed for SDS-PAGE and subsequent Western blot analyses with antiserum against MrpJ or P. mirabilis flagella (FlaA). Reproduced from reference , with permission.
Figure 29
Figure 29
MrpJ paralogs exert unique control over flagella and swarming. (A) Western blot of flagellin expression in P. mirabilis HI4320 mrpJ or mrpJ paralog overexpression strains. Whole cell lysates of uninduced strains were denatured, electrophoresed on 10% SDS-PAGE, and blotted with anti-FlaA antibody, which recognizes the major subunit of the flagellum. Lysates were also blotted with anti-UreD antibody as a loading control (lower panel). Molecular weight markers are indicated on the left side in kDa. (B and C) P. mirabilis cultures were spotted onto the center of swarming agar. (B) Representative swarming phenotypes of strain HI4320 expressing mrpJ paralogs. (C) Gram stains of bacteria taken from the edge of swarm fronts. The reference bar is 50 μm. Figure adapted, with permission, from reference .
Figure 30
Figure 30
Scanning electron micrographs of crystalline biofilms encrusting catheters. (A) shows a cross section of an all-silicone catheter removed from a patient after 8 weeks; (B) shows a longitudinal section of a blocked silver/hydrogel-coated latex catheter removed from a patient after 11 days. In both these cases, extensive crystalline material can be seen occluding the catheter lumen. Figure adapted, with permission, from reference (A) and reference (B).
Figure 31
Figure 31
Swarming behavior of P. mirabilis. (A) Swarming colony of P. mirabilis HI4320. (B) The swarming migration distance of wild-type strain P19 (open circles) and a super-swarming rsbA mutant (solid circles). The periodic shift from swarming to consolidation can be seen. (C) Cartoon and transmission electron microscopy showing differentiated swimmer (broth-cultured) and swarmer cells. (D and F) The edge of an advancing swarm colony during consolidation (D) or swarming (F). (E and G) Gram stains showing consolidate (E) and swarmer cells (G) obtained from the edge of a growing P. mirabilis swarm. Figure adapted, with permission, from reference (A and C), reference (B), and reference (C–G).
Figure 32
Figure 32
P. mirabilis swarms across 1-cm sections of hydrogel-coated latex catheter. Reproduced from reference , with permission.
Figure 33
Figure 33
Swarming on urine agar in response to five cues. (A) Urine agar is not normally permissive for swarming as the high pH resulting from urease activity inhibits swarming. A ureC mutant is capable of modest swarming on urine agar, and supplementation with any of five swarming cues to a final concentration of 20 mM dramatically enhances swarming. (B) Quantitation of swarm colony diameter on urine agar for P. mirabilis HI4320 and a ureC mutant. White lines indicate swarm diameter. Error bars represent means and standard deviations for four independent experiments with four replicates each. Statistical significance was determined by comparing the swarm diameter under each condition to the diameter on plain medium for each strain. *P < 0.05; **P < 0.01; ***P < 0.001. Figure adapted, with permission, from reference .
Figure 34
Figure 34
Expression of the virulence genes zapA and hpmB is coordinately regulated with swarming. The upstream promoter regions of zapA and hpmB, respectively, were fused to a promoterless luxCDABE cassette harbored on a low-copy-number plasmid and transformed into wild-type P. mirabilis. Each of the resulting strains was inoculated as a 5-μl spot in the center of an L agar plate and incubated at 37°C. Gene expression was measured as luminescence (Lux), which is displayed in false color corresponding to relative Lux intensity, where blue is the lowest and red is the most intense. An image of the colony growth photographed in natural light is shown below its corresponding Lux image. Expression of zapA (first two rows) and hpmB (third and fourth row) is shown at 4, 8, 12, and 16 h. Figure adapted, with permission, from reference .
Figure 35
Figure 35
Central metabolism during P. mirabilis UTI and CAUTI. Microarray analysis and targeted mutagenesis studies in an ascending UTI model both point to roles for glycolysis, oxidative pentose phosphate pathway (PPP), Entner-Doudoroff pathway (E-D), and both oxidative and branched/reductive TCA cycles during infection, while gluconeogenesis appears to be dispensable. Induction and requirement of gdhA suggests a low carbon-to-nitrogen ratio. Gene names in red were induced in vivo compared with broth culture as detected by microarray analysis; gene names in black were not differentially regulated, while names in purple were repressed. An “X” over a pathway indicates that a targeted mutant was assessed in cochallenge, with a red X indicating that the mutant was outcompeted and a purple X indicating no fitness defect. Interestingly, a different picture emerges from Tn-Seq in a CAUTI model, where a catheter remains in the bladder. Here, gluconeogenesis contributes to fitness instead of glycolysis, and ammonia uptake relies on glnA instead of gdhA. During coinfection with Providencia stuartii in the CAUTI model, gluconeogenesis remains important, and PPP, E-D, and the oxidative TCA cycle are once again contributors to fitness. Figure adapted from references , , and .
Figure 36
Figure 36
P. mirabilis colonization in bladders and kidneys of naive mice and mice nasally immunized with MrpH using cholera toxin (CT) as an adjuvant. Immunized mice were given primary immunization on day 0 and two booster immunizations on days 14 and 24. On day 34, all mice were challenged with 5 × 10⁷ CFU P. mirabilis. After 7 days, bacterial burden was assessed. MHT, maltose-binding protein fusion of MrpH truncate; MHT-CT, MHT covalently coupled to CT; HA2-B, MrpH23-157-CT chimera; HA2-B + CT, HA2-B mixed with CT. Each diamond represents the log10 CFU per gram of tissue from an individual mouse. Samples with undetectable colonization were given a value of 2 log10 CFU/g tissue (the limit of detection). Horizontal bars represent the median log10 CFU per gram of tissue for each column. One-tailed P values were determined by the Mann-Whitney test, comparing the colonization levels in bladders and kidneys of the naive mice with those of the immunized mice. Reproduced from reference , with permission.

References

    1. Adeolu M, Alnajar S, Naushad S, Gupta RS. 2016. Genome-based phylogeny and taxonomy of the ‘Enterobacteriales’: proposal for Enterobacterales ord. nov. divided into the families Enterobacteriaceae, Erwiniaceae fam. nov., Pectobacteriaceae fam. nov., Yersiniaceae fam. nov., Hafniaceae fam. nov., Morganellaceae fam. nov., and Budviciaceae fam. nov. Int J Syst Evol Microbiol 66:5575–5599. [PubMed] - PubMed
    1. Wenner JJ, Rettger LF. 1919. A systematic study of the Proteus group of bacteria. J Bacteriol 4:331–353. [PubMed] - PMC - PubMed
    1. Armbruster CE, Mobley HLT. 2012. Merging mythology and morphology: the multifaceted lifestyle of Proteus mirabilis. Nat Rev Microbiol 10:743–754. [PubMed] - PMC - PubMed
    1. Warren JW, Tenney JH, Hoopes JM, Muncie HL, Anthony WC. 1982. A prospective microbiologic study of bacteriuria in patients with chronic indwelling urethral catheters. J Infect Dis 146:719–723. [PubMed] - PubMed
    1. Mobley HLT, Warren JW. 1987. Urease-positive bacteriuria and obstruction of long-term urinary catheters. J Clin Microbiol 25:2216–2217. [PubMed] - PMC - PubMed

Publication types

Substances

LinkOut - more resources