

Lipopolysaccharide enhances TGF-β1 signalling pathway and rat pancreatic fibrosis
- PMID: 29424488
- PMCID: PMC5867168
- DOI: 10.1111/jcmm.13526
Lipopolysaccharide enhances TGF-β1 signalling pathway and rat pancreatic fibrosis
Abstract
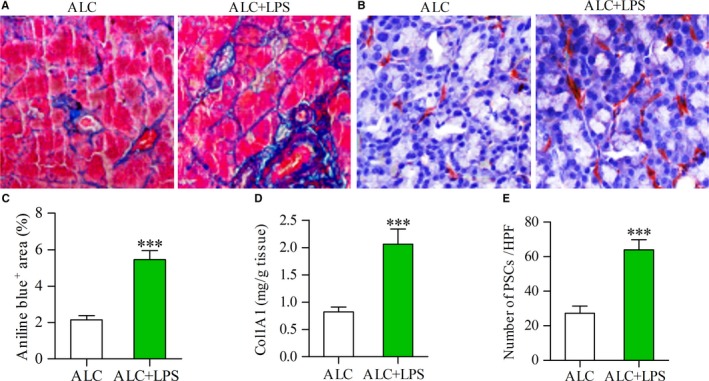
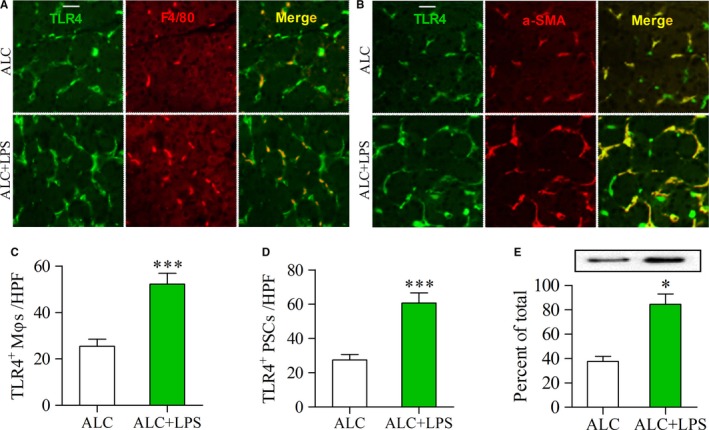
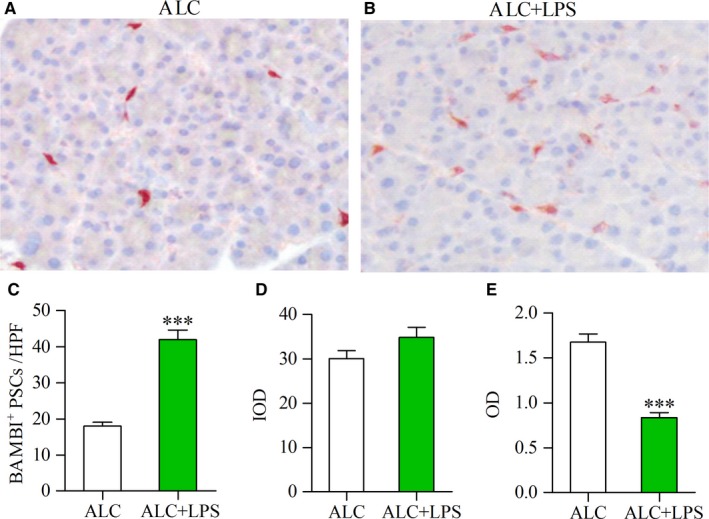
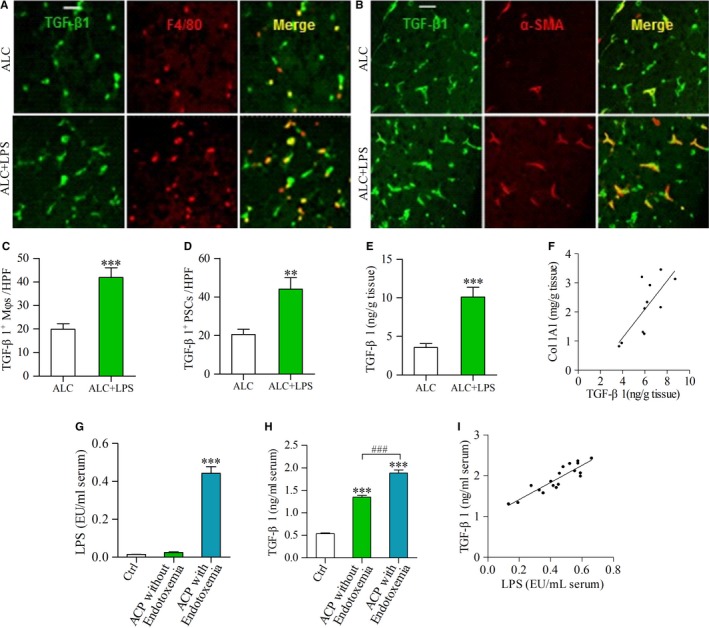
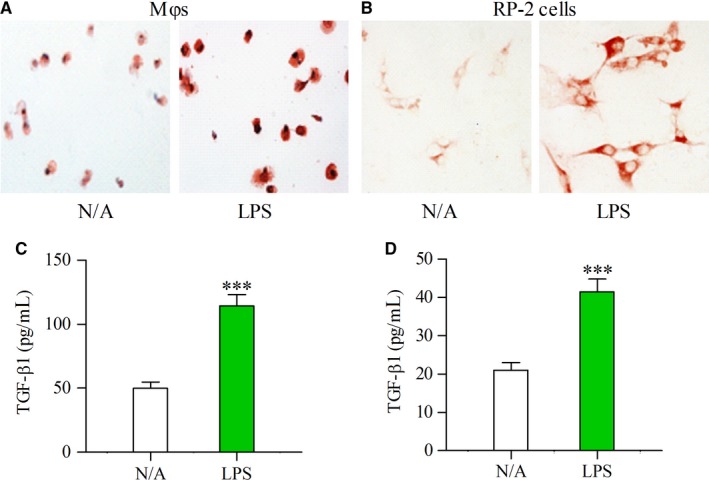
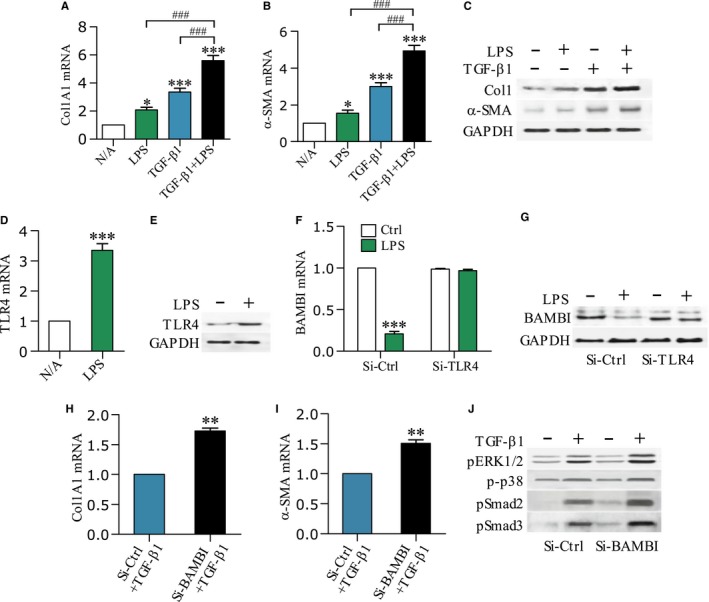
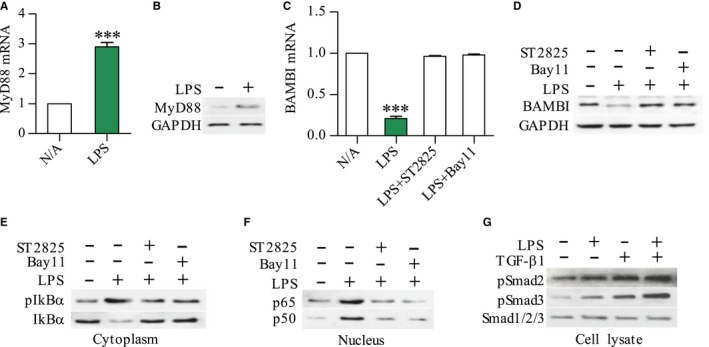
Pancreatic stellate cells (PSCs) play a critical role in fibrogenesis during alcoholic chronic pancreatitis (ACP). Transforming growth factor-beta1 (TGF-β1) is a key regulator of extracellular matrix production and PSC activation. Endotoxin lipopolysaccharide (LPS) has been recognized as a trigger factor in the pathogenesis of ACP. This study aimed to investigate the mechanisms by which LPS modulates TGF-β1 signalling and pancreatic fibrosis. Sprague-Dawley rats fed with a Lieber-DeCarli alcohol (ALC) liquid diet for 10 weeks with or without LPS challenge during the last 3 weeks. In vitro studies were performed using rat macrophages (Mφs) and PSCs (RP-2 cell line). The results showed that repeated LPS challenge resulted in significantly more collagen production and PSC activation compared to rats fed with ALC alone. LPS administration caused overexpression of pancreatic TLR4 or TGF-β1 which was paralleled by an increased number of TLR4-positive or TGF-β1-positive Mφs or PSCs in ALC-fed rats. In vitro, TLR4 or TGF-β1 production in Mφs or RP-2 cells was up-regulated by LPS. LPS alone or in combination with TGF-β1 significantly increased type I collagen and α-SMA production and Smad2 and 3 phosphorylation in serum-starved RP-2 cells. TGF-β pseudoreceptor BAMBI production was repressed by LPS, which was antagonized by Si-TLR4 RNA or by inhibitors of MyD88/NF-kB. Additionally, knockdown of Bambi with Si-Bambi RNA significantly increased TGF-β1 signalling in RP-2 cells. These findings indicate that LPS increases TGF-β1 production through paracrine and autocrine mechanisms and that LPS enhances TGF-β1 signalling in PSCs by repressing BAMBI via TLR4/MyD88/NF-kB activation.
Keywords: TGF-β1; alcohol; lipopolysaccharide; pancreatic fibrosis; pancreatic stellate cell.
© 2018 The Authors. Journal of Cellular and Molecular Medicine published by John Wiley & Sons Ltd and Foundation for Cellular and Molecular Medicine.
Figures
Similar articles
-
Role of Gut-Derived Endotoxin on Type I Collagen Production in the Rat Pancreas After Chronic Alcohol Exposure.Alcohol Clin Exp Res. 2018 Feb;42(2):306-314. doi: 10.1111/acer.13550. Epub 2017 Dec 18. Alcohol Clin Exp Res. 2018. PMID: 29121396
-
Interleukin-6 participates in human pancreatic stellate cell activation and collagen I production via TGF-β1/Smad pathway.Cytokine. 2021 Jul;143:155536. doi: 10.1016/j.cyto.2021.155536. Epub 2021 Apr 21. Cytokine. 2021. PMID: 33893003
-
Bacterial endotoxin: a trigger factor for alcoholic pancreatitis? Evidence from a novel, physiologically relevant animal model.Gastroenterology. 2007 Oct;133(4):1293-303. doi: 10.1053/j.gastro.2007.06.062. Epub 2007 Jul 3. Gastroenterology. 2007. PMID: 17919500
-
Activation and Regulation of Pancreatic Stellate Cells in Chronic Pancreatic Fibrosis: A Potential Therapeutic Approach for Chronic Pancreatitis.Biomedicines. 2024 Jan 4;12(1):108. doi: 10.3390/biomedicines12010108. Biomedicines. 2024. PMID: 38255213 Free PMC article. Review.
-
Calcium signalling in pancreatic stellate cells: Mechanisms and potential roles.Cell Calcium. 2016 Mar;59(2-3):140-4. doi: 10.1016/j.ceca.2016.02.003. Epub 2016 Feb 28. Cell Calcium. 2016. PMID: 26960936 Review.
Cited by
-
Biological and Proteomic Characteristics of an Immortalized Human Pancreatic Stellate Cell Line.Int J Med Sci. 2020 Jan 1;17(1):137-144. doi: 10.7150/ijms.36337. eCollection 2020. Int J Med Sci. 2020. PMID: 31929747 Free PMC article.
-
Lobeglitazone inhibits LPS-induced NLRP3 inflammasome activation and inflammation in the liver.PLoS One. 2023 Aug 24;18(8):e0290532. doi: 10.1371/journal.pone.0290532. eCollection 2023. PLoS One. 2023. PMID: 37616215 Free PMC article.
-
Baicalin Ameliorates Pancreatic Fibrosis by Inhibiting the Activation of Pancreatic Stellate Cells in Mice with Chronic Pancreatitis.Front Pharmacol. 2021 Jan 18;11:607133. doi: 10.3389/fphar.2020.607133. eCollection 2020. Front Pharmacol. 2021. PMID: 33536916 Free PMC article.
-
Zinc-nanoparticles alleviate the ovarian damage induced by bacterial lipopolysaccharide (LPS) in pregnant rats and their fetuses.Histochem Cell Biol. 2023 Nov;160(5):453-475. doi: 10.1007/s00418-023-02222-4. Epub 2023 Jul 26. Histochem Cell Biol. 2023. PMID: 37495867 Free PMC article.
-
Animal Models: Challenges and Opportunities to Determine Optimal Experimental Models of Pancreatitis and Pancreatic Cancer.Pancreas. 2019 Jul;48(6):759-779. doi: 10.1097/MPA.0000000000001335. Pancreas. 2019. PMID: 31206467 Free PMC article. Review.
References
-
- Apte M, Pirola RC, Wilson JS. Pancreatic stellate cell: physiologic role in fibrosis and cancer. Curr Opin Gastroenterol. 2015;31:416‐423. - PubMed
-
- Hisaoka M, Haratake J, Hashimoto H. Pancreatic morphogenesis and extracellular matrix organization during rat development. Differentiation. 1993;53:163‐172. - PubMed
Publication types
MeSH terms
Substances
LinkOut - more resources
Full Text Sources
Other Literature Sources
Molecular Biology Databases
